These are all acronyms for things that have lost value over the last 30 years. The first four are outdated and of little use outside of nostalgic purposes, due to modern technological advances. The latter is a fantasy baseball term that stands for Multiple Position Eligibility.
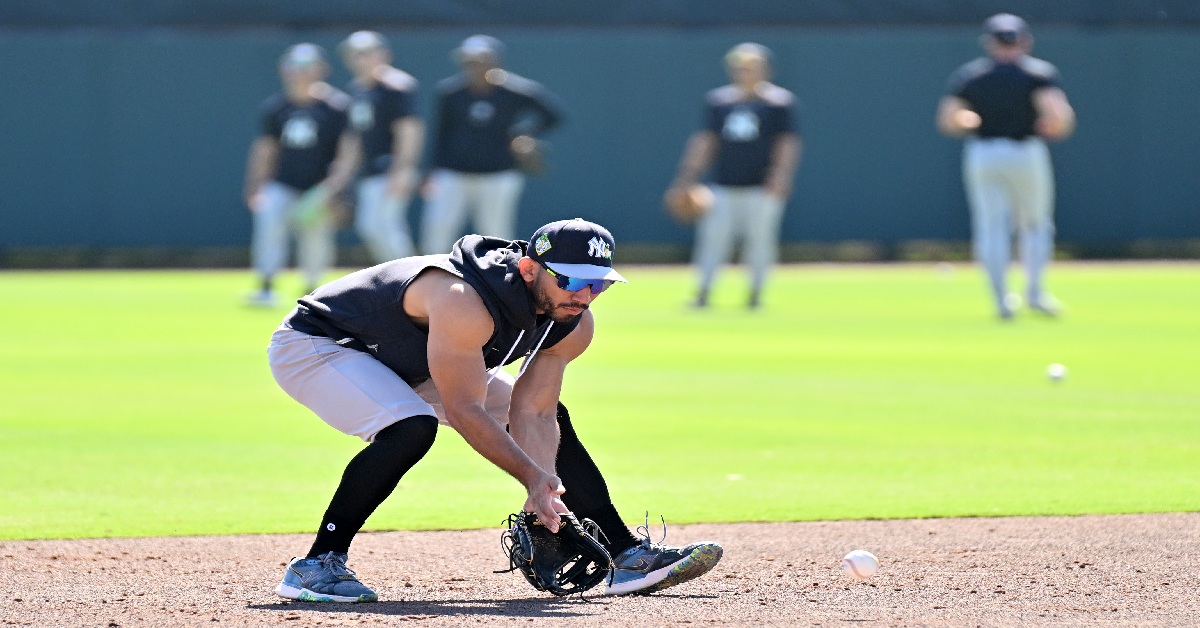
We all love the hitter with an extra position of eligibility or three. That urge to bump José Caballero (2B, SS, 3B, OF) two rounds ahead of his ADP is strong! He’s that hot bowl of chicken noodle soup, wrapping your roster in a warm blanket of full positional coverage, with some steals on the side. There’s only one problem with MPE hitters in fantasy baseball these days – they aren’t as scarce or valuable as they used to be. Or at least that’s what it’s felt like recently.
For the National Fantasy Baseball Championship (NFBC) in 2026, hitters qualify at a position where they played at least 20 games in 2025 and gain in-season eligibility at a position once they’ve played 10 games there.
Here is some recent data on multi-position eligible hitters from NFBC’s all-time career earner, Phil Dussault:
Among the top 300 hitters per the 2024 NFBC Main Event ADP, 47 started the season with more than one position of eligibility, and 75 ended with it. In 2025, there were 39 at the beginning of the season and 78 by the end. Over the last two seasons (less catchers and UT-only), 17% of the 15-team league player pool had at least two positions of eligibility during draft season, and 29% by the end of the regular season. So, nearly 1 of every 3 hitters provided coverage at another position. Is it possible that we are over-inflating the value of MPE hitters?
There is no doubting the extra value that multi-position-eligible hitters bring, especially in a format like NFBC Roto that has two scoring periods per week for hitters. Roster flexibility is extremely important for avoiding zeroes in our starting lineups. We’ve all fallen victim to the mid-week injury where, if not for a guy like Caballero on our bench, we’d be earning no stats at third base if our starter was Royce Lewis and he hit the IL on a Thursday.
MPE hitters are even more important in the NFBC Cutline, which is a hybrid best ball points format. Since we don’t set lineups and weekly scoring is optimized, the 3-4 round ADP bump for MPE hitters in Cutlines is justified. For example, Caballero has a 168 ADP in Cutlines, compared to 205 in traditional roto contests. In managed leagues, multi-position eligible value is measured by the size of the bench – the fewer bench spots we have, the more we should covet MPE guys. In daily H2H and Points leagues, we must be hyperactive managers who optimize each starting hitter spot every day. Most of the time, MPE hitters hang around our rosters because of their quick coverage capability.
Though I’ve been playing NFBC since 2009, I haven’t been good at maintaining historical data until the past few years. To help prove my theory that the MPE hitter market is oversaturated, other than anecdotally, I needed to see the rate of MPE hitters in the draftable player pool over the last 10-15 years. I have far from a complete picture, but thankfully, my old friend and high-stakes stalwart, Scott Jenstad, shared the NFBC ADP from 2017. It’s just a one-year sample, of course, but the findings were interesting. Only 8% of the 290 hitters drafted started the year with more than one position of eligibility. The only hitters with at least three were Javier Báez (2B, 3B, SS), Matt Carpenter (1B, 2B, 3B), and Jedd Gyorko (2B, 3B, SS). The only catcher with another position that year was Willson Contreras (C, OF).
Despite not having a full picture of the last decade or two, most of us who managed fantasy baseball leagues last season recognize the surplus of MPE options on the waiver wire every week. There was always a Zach McKinstry or a Brooks Lee available. The draw of the MPE hitter lost its allure, as we attempted to reset our focus on a player’s projected fantasy output for the upcoming week, not just peacocking our fancy bench of multi-positional hitters for the sake of it.
Most Valuable Multi-Position Eligibles (MVMPE)
Let’s quickly touch on some of the most valuable types of multi-position-eligible hitters.
The Catcher Who Doesn’t Catch
Ben Rice is the prime example this season. He plays for the Yankees, hits the ball hard, and is eligible at catcher, but will mostly play first base and DH. Just like we didn’t draft Buster Posey in 2018 for the first base eligibility, we’re locking Rice into our catcher slot. Evan Gattis (C, OF) was another fun blast from the past. Willson Contreras fit the bill last season, though he eventually found a way back to his second home, the IL. Iván Herrera may sneak his way back into catcher eligibility, which would make him even more valuable, but it may not happen. The Cardinals may opt to utilize him in left field and at first base. In very deep draft-and-hold leagues, Luis Campusano is an option as a UT-only hitter with a high likelihood of earning catcher eligibility in April. Campusano currently projects as Freddy Fermin’s backup in San Diego.
The Crossover Guy
Arguably, the most important type of MPE hitter is one who earns eligibility outside his MI or CI vertical – the middle infielder adding third base eligibility who we plug in at 2B, SS, MI, 3B, and CI, or the corner infielder who earns middle infield or outfield eligibility. The crossover is especially meaningful if it’s a corner infielder who earns middle infield eligibility and can provide fantasy squads with a much-needed power boost.
Isaac Paredes is a prime example this draft season. The draft market has been lukewarm on Paredes due to his one-dimensionality, trade rumors, and the possibility of platooning. His NFBC ADP has dropped from 188 to 237 since December 1. The 27-year-old hit 31 HR with 98 RBI in 2023 and crushed another 20 bombs in 438 plate appearances last season before suffering a severe hamstring strain in mid-July. Paredes played 89 of 102 games last season at third base, has been earning spring reps at second base, and may mix in at first base as well.
Toronto Blue Jays third baseman Kazuma Okamoto (ADP 221) is another hitter whose price doesn’t properly reflect the added value of potential in-season positional gains – outfield and first base. Okamoto is off to a roaring start in spring training, and his ADP is beginning to creep up into the top 200.
Keystone Versatility
Here is another interesting tidbit from Mr. Dussault’s vault – his percentage chance that a single-position player adds a second position during the season, based on their current position:
First Base – 11.9%
Second Base – 39.1%
Third Base – 27.1%
Shortstop – 21.8%
Outfield – 5.8%
With only Jazz Chisholm Jr., Ketel Marte, and Brice Turang in the top 100 ADP, second base is easily the weakest position in those early rounds, but it deepens later in drafts. At 39%, it is also the position most likely to gain additional in-season eligibility. Among second basemen drafted in the top 500, 56% (24 of 43) are currently eligible at a position beyond second base. The most popular real-life positional shifts this spring are among fantasy second basemen:
Most of these middle infielders were covered in my ADP Clusters last week, but I must remind you that the market is greatly undervaluing Seattle’s projected leadoff man, Brendan Donovan.
There are a handful of deep league or in-season stream-worthy fantasy second basemen who should also earn a second position of eligibility, though more likely in May than in April:
Since I won’t touch on every player expected to earn new position eligibility, I’ll point out the solid article by Mark Steubinger of Pitcher List that Jeff Zimmerman referenced in his latest Mining the News. Let’s wrap this up with a few final new position gainers.
The shortstop position is deep, and it’s important for folks who haven’t been drafting up a storm these last few months to know that you will be tempted to draft a second shortstop earlier than you may like. Those of us locked into a 1.03 pick, earning the pleasure of drafting Bobby Witt Jr., should not cross Bichette off, because he can play third base for us. It’s an especially valuable notion to recall on draft day since third base is the second shallowest position in the top 100 ADP. Just be sure to have another third baseman on the roster to hold down the fort until Bichette qualifies.
These two big boppers should pad our power categories, no matter which corner we start them at. Even the most meticulous planners won’t know for sure where they need these guys until they’re already drafting. Not to mention drafts have a funny way of throwing plans out of alignment. The most important thing is to be mindful of their eventual positional flexibility if one of these guys is a must-have target. Not everything in a draft will go to plan, but the chances of things going our way increase when less new information is introduced to us on the spot.
MPE hitters aren’t the scarce commodity they once were, but are nevertheless a vital element of our draft and in-season strategy, especially in the NFBC Cutline and in leagues with shallower benches. A second position of eligibility can absolutely be a draft pick tiebreaker between two hitters of relative value. Incorporating these projected new positions of eligibility into our player notes, rankings, or draft plans should add another layer of organization and confidence to make optimal decisions in our drafts. When it comes to in-season management, one of our primary assignments to ensure we don’t put ourselves in danger of taking zeroes in our lineup.
As many of you know, the fantasy baseball season never stops for a dedicated contingent that not only plays through the fall and winter but sometimes even does their first draft for the following season during the current one! But I don’t need to explain the concept of “diehards” to y’all, you’re already here. Over at the NFBC there have been 70 Draft Champions drafts completed (15-team, 50-round Draft & Hold leagues), but I’m going to focus on a tighter recent sample of 11 drafts since Christmas since it will give us more recent player movement better accounted for in the data. You can find the ADP data here and use the calendar feature to chop it up as you see fit.
I wanted to get a better feel for the ebbs of flows of where starters are going so this will be a tour through the SP market in the top 300. I’m not explicitly outlining the biggest risers and fallers in this piece. You can track the movement in the SP market (and all positions) in Justin’s reports. I’m going to look at some overall volume counts and then look at them through the prism of some category thresholds.