It has always been difficult for me to understand pitcher volatility. Well, the volatility part isn’t hard to understand, actually, it’s very simple. Pitching in the big leagues is incredibly difficult and one tiny little element of a pitcher’s game could be off to make the whole outing unravel. But, what is hard to understand is what little element that is. Did a 1 mph drop on a four-seamer really make it all go south? Or, was it a matter of half an inch of location? Is it even measurable? Like, what if it was just bad gas from the previous night’s chimichanga that threw things off? Do you see where I’m going? I want to know why a pitcher does so well one day and so poorly the next. For my first round of this, I’ll start slow and focus on only one pitch, narrowing the question down to, why does one pitch perform well one day and bad the next? In today’s investigation, I’ll analyze and compare Robbie Ray’s July 3rd 2.6 wSL Pval (Pitch Info) with his July 24th -3.4 wSL pVal. Let’s have some fun. Read the rest of this entry »
How would you define Jeff McNeil as a hitter in just a few words? If you had to place him in his own “group” of hitters, who else would you place him with? Last week, I used a cluster analysis to find a player that might compare to Luis Arraez and in turn, help provide some approach recommendations for increasing his power. This week, I’ll use that same cluster analysis, with just a few tweaks, to determine what combination of Statcast and plate discipline metrics increases roto value on average. Let’s start with a refresher on my process.
The 2022 American League batting title was won with .316. It was the lowest batting average to earn the award in the American League since Carl Yastrzemski hit .301 in 1968. Rod Carew earned the best AL batting average in 1972 with .318 and Tony Gwynn hit .313 in 1988 to earn the NL award. But typically, the batting title is awarded for a higher average. The average batting average of players winning the batting title in both the AL and NL over the past 50 seasons has been .345. Arraez’s .316 average was impressive, but it probably won’t benefit your fantasy team when quite enough when it brings only 8 home runs along with it.
Is there room for more power in Arraez’s approach? Don’t tinker with a good thing is what I immediately think, but then again, will .316 and probably slightly below (Arraez steamer 2022: avg .305), continue to top leaderboards? Furthermore, Arraez is up for arbitration prior to the 2023 season and won’t be a free agent until 2026. He has plenty of room to work for a few extra dollars in the power department. Shoot, he even said he wanted to add power himself when speaking with two of the most powerful in Giancarlo Stanton and Aaron Judge at the All-Star game (0:36):
So, what can he do? How can Luis Arraez add a little more power without changing who he is? I’m not a swing expert, but I did stay at a Holiday Inn last night and I know how to run a clustering model on high-dimensional data. But we’ll get to that in a minute.
Let’s start with who he is. First, he’s a man who does not strike out. He had the lowest K% at 7.1% among qualified hitters in 2022. He also never swings and misses. His 2.5% SwStr% was also the lowest among qualified hitters and lower than the new kid on the block Steven Kwan’s second place 3.1%. Second, he doesn’t steal bases. Four bags in 2022 and two bags in 2021 didn’t accentuate Arraez’s ability to get on base. Lastly, he doesn’t hit for power. His .104 ISO ranked 12th from the bottom among qualified hitters in 2022. From a fantasy perspective, Arraez is not necessarily a one-sided player, but he’s close. He got on base enough times to be driven in to score enough times and both his mR and mAVG returned positive value according to our auction calculator:
Luis Arraez, 2022 YTD Value
Name
PA
mAVG
mRBI
mR
mSB
mHR
PTS
aPOS
Dollars
Luis Arraez
603
$6.93
-$2.79
$3.07
-$1.53
-$3.61
$2.07
$9.51
$12.59
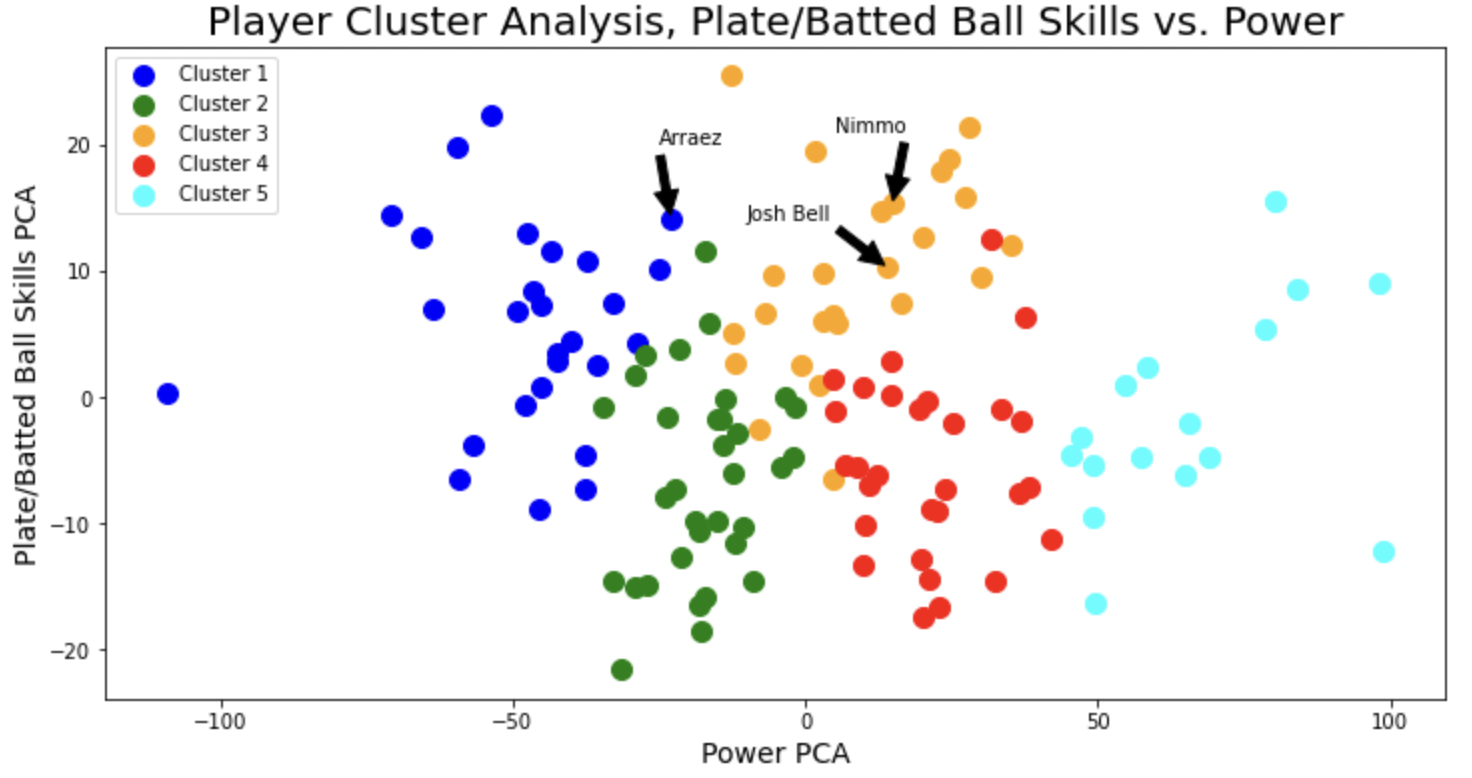
So where does this profile place him amongst his peers? Well, looking at a lot of columns in a spreadsheet can make it difficult to put a single label on a player. There’s just too much to sway your opinion. In order to combat this and help us create a more summarized view of many metrics, I’ll use a Principal Component Analysis (PCA) to “increas[e] the interpretability of data while preserving the maximum amount of information, and enabling the visualization of multidimensional data”. I created two sets of variables, one mostly batted ball, and plate discipline and the other Statcast metrics with a few non-Statcast metrics that more or less define power. Here they are:
With a PCA I’m able to reduce these lists to two numbers which can then be passed through a k-means cluster analysis, grouping players into nice segments for visualization. Typically, a cluster analysis is used to gather insights on unlabeled data and it is a type of unsupervised learning. In this case, we’re using it to make comparisons we otherwise wouldn’t have:
Arraez finds himself, surprisingly, in the high-power end of cluster 1. To better understand why that is, we can compare his Statcast/power metrics with the averages from cluster 1. In addition, I’ll throw in that player all the way to the left, Tony Kemp, to help us compare Arraez with his cluster-mates:
Cluster 1 Metrics
Name
HR/FB
EV
maxEV
LA
Barrels
Barrel%
HardHit
SLG
xSLG
Tony Kemp
4.3
84.4
103.2
15.0
7
1.6
65
0.334
0.291
Luis Arraez
4.8
88.9
107.3
12.9
18
3.6
153
0.420
0.408
Cluster 1 Average
7.7
86.7
108.8
12.2
17
4.2
126
0.383
0.365
SOURCE: Statcast
Now we have a group for Arraez that makes sense. Next, let’s look at a few players who are higher up on the power scale, but aren’t changing too much in the batted ball/plate discipline area. Here’s our cluster image from before but with two new names identified that might be able to help Arraez inch over to the next cluster:
I am not saying that Luis Arraez should just go up there and try to be more like Josh. But I am using him as an example to determine what makes his profile more powerful. Josh Bell, 6′ 4″ / 255, and Luis Arraez, 5′ 10″ / 175, are different. While I don’t expect Luis Arraez to just suddenly increase his exit velocity, I am certain he has the skills to change his approach. One place to start would be adding more pull.
Shifting into Cluster 3
Name
LD%
GB%
FB%
Pull%
Cent%
Oppo%
Swing%
Contact%
SwStr%
Josh Bell
18.6
50.4
30.9
38.4
36.0
25.7
45.3
80.6
8.8
Brandon Nimmo
17.7
50.5
31.7
32.1
38.5
29.4
43.7
82.6
7.6
Luis Arraez
25.8
41.2
32.9
31.6
37.9
30.6
42.7
94.1
2.5
SOURCE: Statcast
Josh pulls the ball more. Josh also swings and misses more often. But while not swinging and missing is really impressive in this day and age, how valuable is it from both a fantasy perspective and a real-life perspective? Increasing his swinging-strike percentage while also increasing his slugging percentage would benefit everyone involved. Arraez is already hitting the ball with decent slugging results when it’s put inside, though he could improve on high-inside pitches, and all of his 2022 home runs came off pulled balls:
–
–
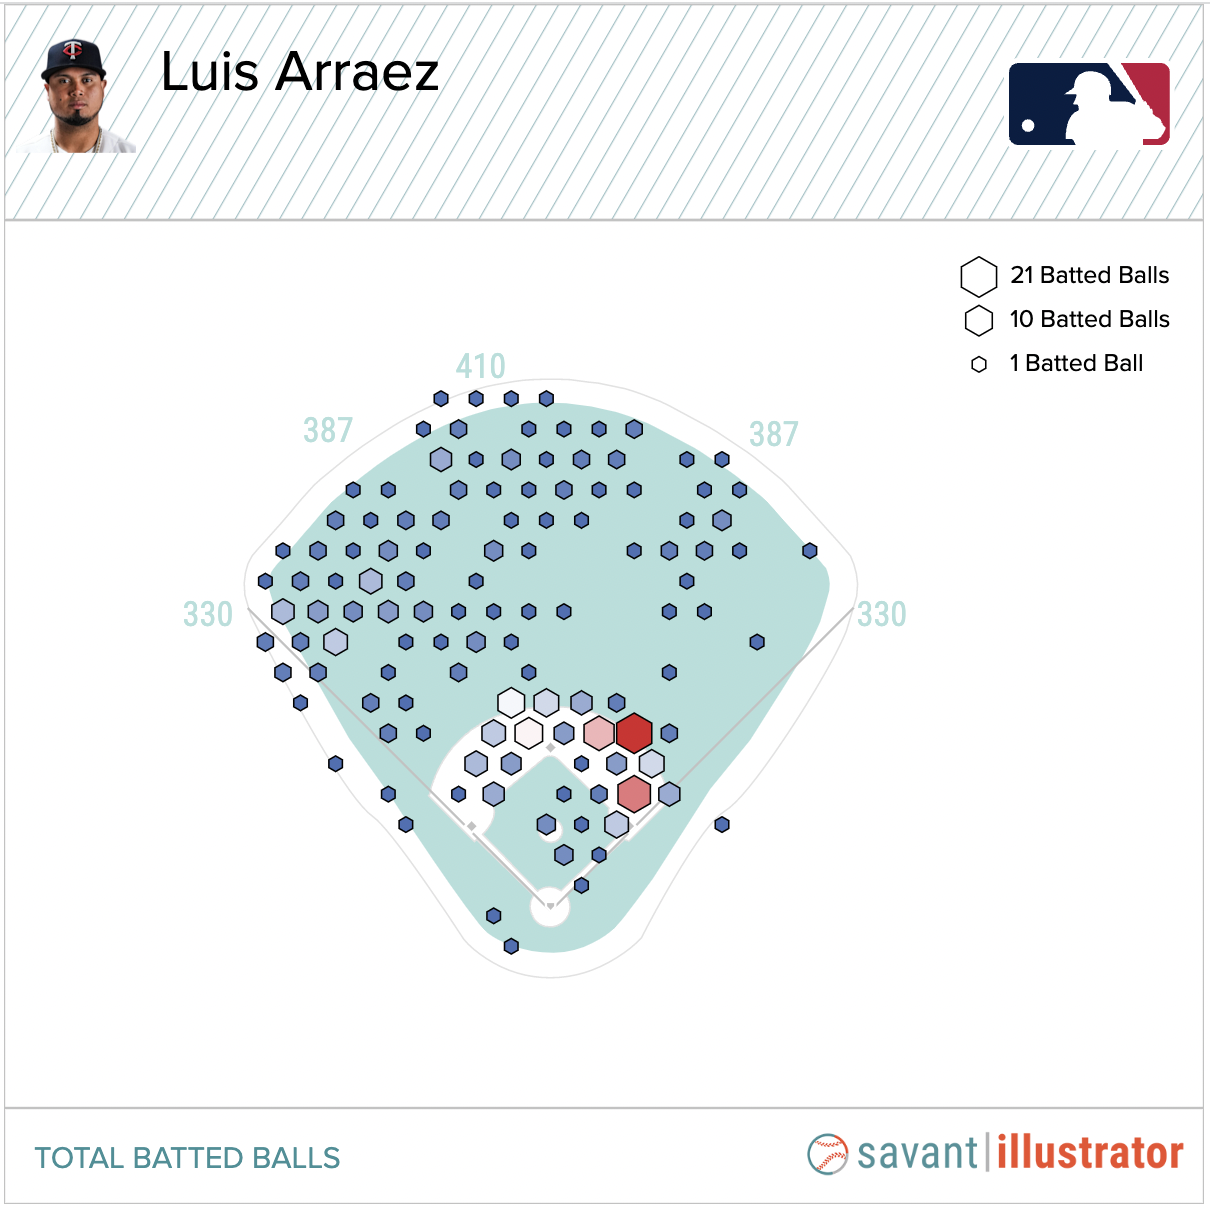
While watching a player who can spray the ball all over the field is fun, Arraez’s numbers aren’t great when going oppo. He slugged .638 when pulling the ball but when he slapped the ball the other way in 2022, he had mediocre results and his slugging percentage was brought down to .364. Just look at how many outs he hit into the opposite direction:
In 2022, Arraez’s HardHit% increased from 27.8% to 30.6% when he pulled the ball. When he was ahead in the count and pulled the ball, it jumped to 32.5%. Given a little more freedom from the worry of striking out, he added more power. But, here’s where things get a little odd. Arraez put the ball in the air more often than Bell and Nimmo in 2022 and his average launch angle was higher as well. If we look at his baseball savant radial chart isolated to singles, doubles and home runs (he only hit one triple in 2022), he clearly knows how to elevate the ball to hit for power:
But, without the exit velocity to take the ball out, he ends up with a lot of fly ball outs. Looking at the table above, he’s putting the ball in the air more often than Nimmo and Bell but with a significantly lower HR/FB rate.
Let’s summarize. Luis Arraez could be more valuable if he hit with a little more power. One way he might add power is to start pulling the ball more and leveling out his swing ever-so-slightly. This may cause him to swing and miss more often, but he can afford it. Arraez earned nearly $13 in 2022 and we should expect that to increase if he can adjust. It may seem nuts, but Luis Arraez needs to start swinging and missing more often.
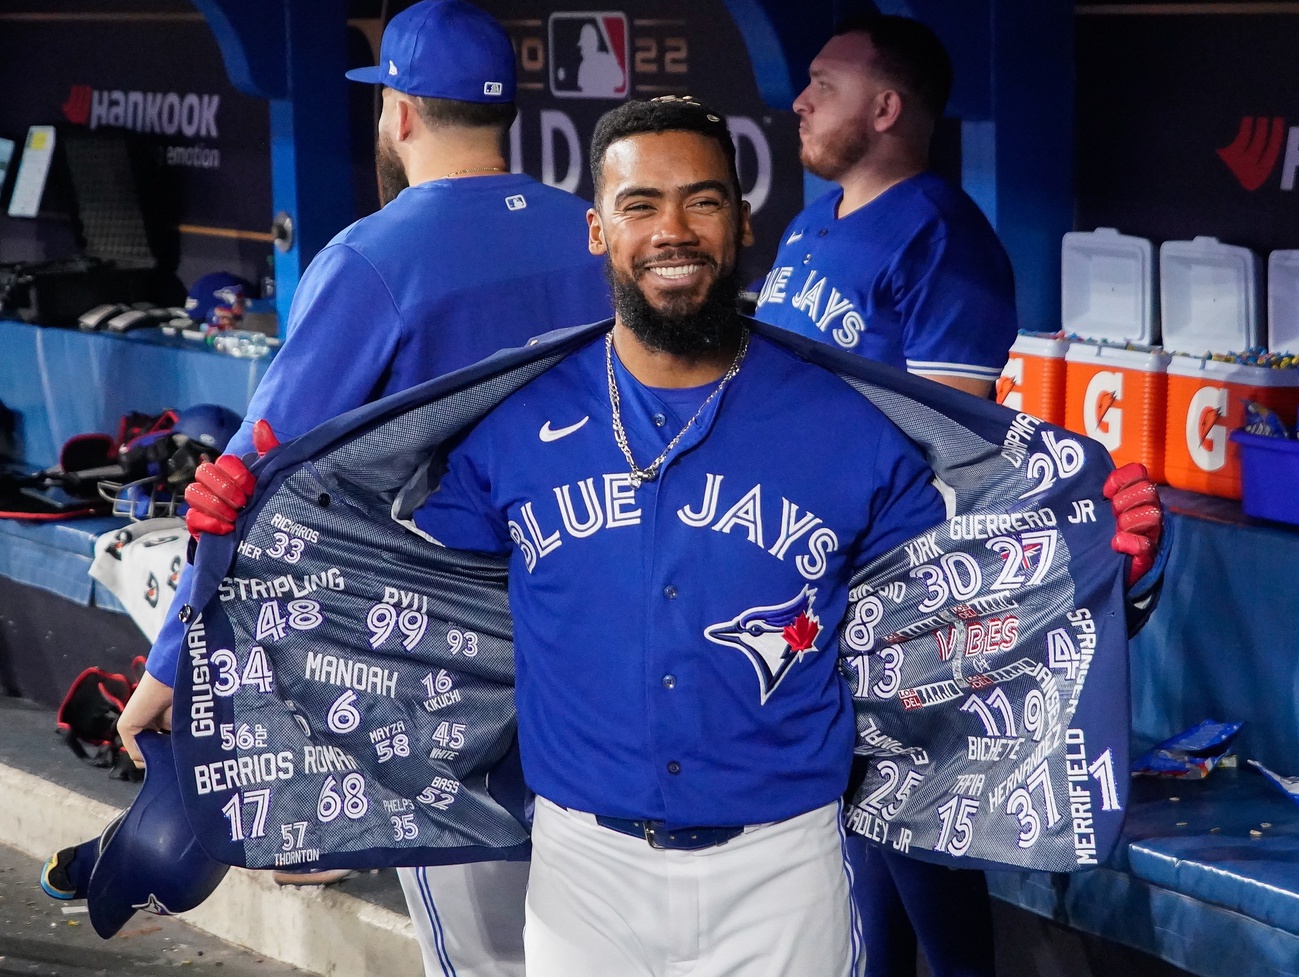
I’m sure everyone has seen this graphic on Baseball Savant but if not, go take a look.
This may be the most trusted but misleading graphic used in (fantasy) baseball analysis. It was all over Twitter today with the Teoscar Hernández trade to show off his greatness. Read the rest of this entry »
It’s like Dottie said, “Lay off the high ones.” But, it ain’t so easy. Just ask Kit. I feel like I’ve been seeing more swings and misses on pitches up and out of the zone. Here’s an example, courtesy of Pitching Ninja:
Have you ever been to a circus or county fair, and they have that game where random people hit a spot with a sledgehammer and try to ring the bell at the top? With enough force, it can be done, but contestants must be strong! The game, according to Wikipedia is called the high striker. You can hear the game being played from afar, a crack of a hammer, a crowd cheering, and every once in a while, a bell ringing. You can hear the shouts too, “Step right up, step right up! See if you have the strength to ring the bell! You sir! You look like a strong man who can impress all these people. Just five bucks a whack! Step right up and show us how strong you really are!”
Part of the reason this is so fun and entertaining is because it’s one of those cases where all else really is equal. In baseball, that rarely, if ever, truly happens. Take for example two hitters who have struck the same pitch type with the same launch angle. How would you determine which one was hit harder?
Guess That EV
Launch Angle
2022 MaxEV
2022 HardHit%
Exit Velocity
Player A
23
118.4
43.4%
?
Player B
23
117.4
61.2%
?
What other information would you like? The count? The pitcher? Whether or not runners were on base? Now, we’re adding in variation. We’re giving one person in our analogy a heavier hammer or maybe one of our contestants is somehow stronger when other people are watching. Ok, enough with the analogy, let’s add some variation to our baseball data points:
As we know, these two batted balls are not, could not be totally equal. They were in different cities with different weather scenarios with different pitchers with different runners on base. Both, however, did leave the yard for home runs:
So, what makes these two batted balls unique? Well, a lot actually. But, hit an in-the-zone pitch that hard and it’s going to go a long way. It just all depends on how hard you can swing the hammer. Without further ado, let’s play another round of, “Who Hit It Harder!”
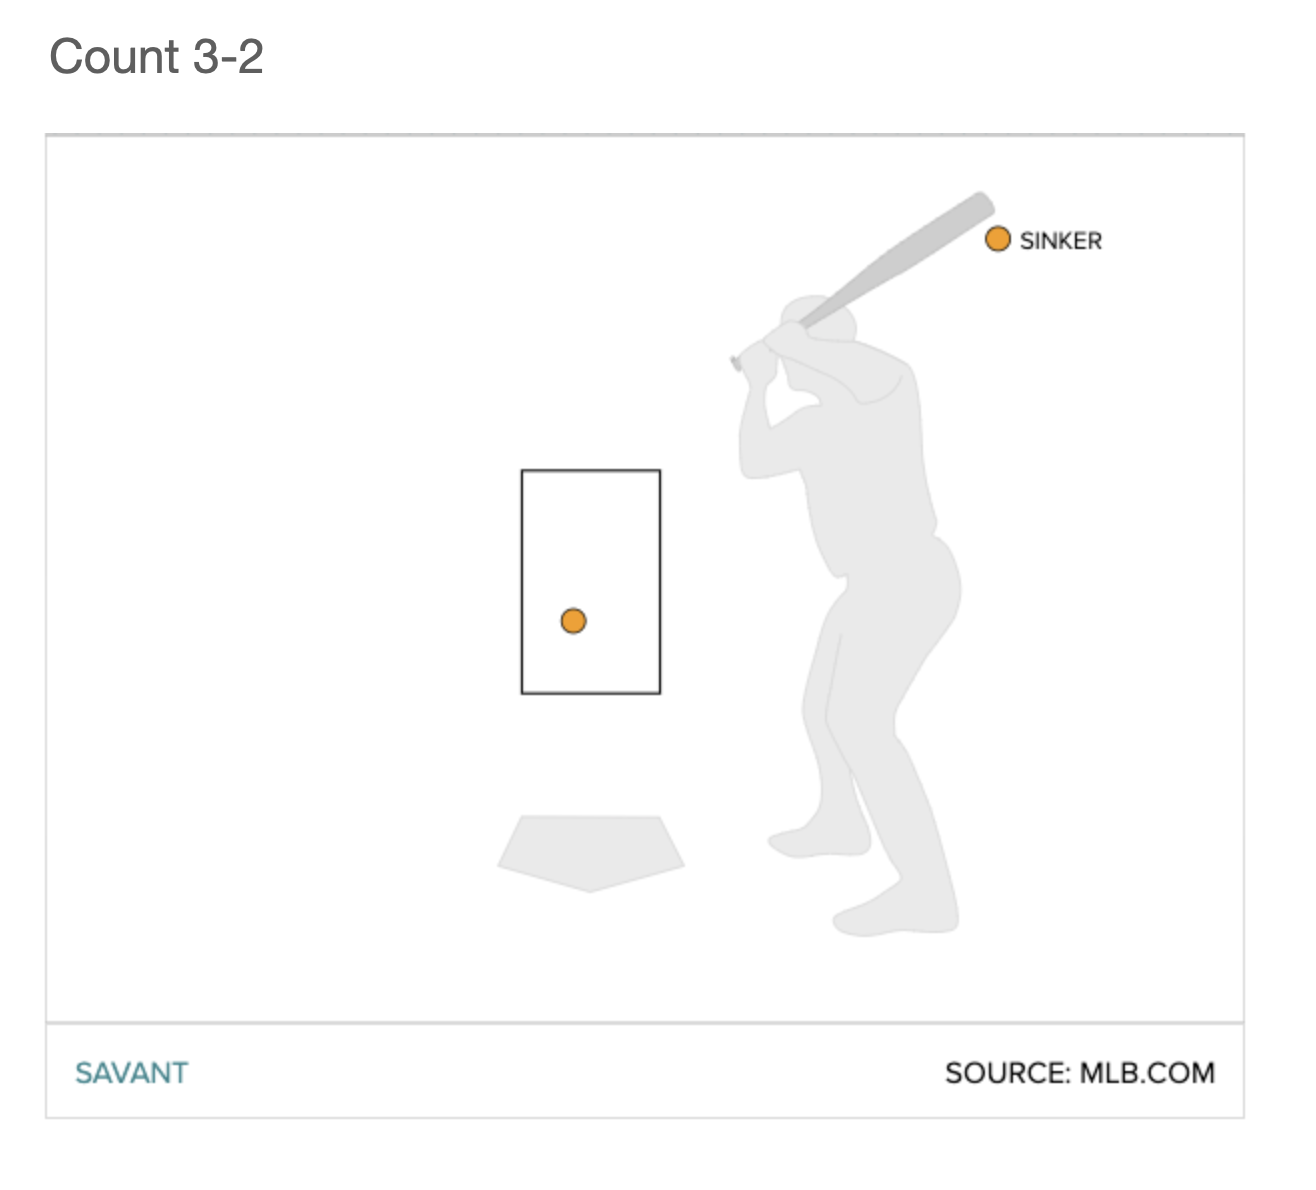
Who Hit It Harder? – Round 2
3-2 count, sinkers in statcast gameday zone 8.
In this exercise, I’ll give you three batted balls under somewhat similar conditions and your job is to determine which batter hit the ball harder. Here are our hitters along with some data points:
Here are three heavy hitters who have stepped up to the plate and worked their way into a full count. A sinker, low in the zone comes at them and they each put the ball in play. There’s not a whole lot of differentiation here. Santander certainly had a faster pitch to hit, but both he and Acuña benefited from a righty-lefty matchup. Here’s some more information for you to use to determine who hit it harder:
2022 Averages: Round 2
Batter
PA
maxEV
2022 Average EV
HardHit%
Barrel%
Keston Hiura
156
112.4
93.3
50%
18.2%
Ronald Acuña Jr.
368
117.9
91.1
52.3%
12.7%
Anthony Santander
460
113.2
90.1
42.7%
10.5%
2022 MLB Averages
–
–
88.6
38.3%
7.6%
SOURCE: Statcast
If you use HardHit% to simply help you decide then you can just play the percentages and choose Ronald Acuña. But, what about that perfect combination of exit velocity and launch angle? Percentages tell you that Hiura finds the sweet spot more often, but that’s misleading because he’s only had 156 plate appearances. So, what do we do? How about adding in, probably the most important metric to putting this puzzle together, launch angle:
Hint 1: Round 2
Batter
Launch Angle
Keston Hiura
35
Ronald Acuña Jr.
-12
Anthony Santander
3
SOURCE: Statcast
Remember that what we’re after is exit velocity. We know that each of these hitters can hit the ball hard, but under these conditions, who hit it harder? We can probably assume that Acuña’s ball goes into the ground. Does a sinker hit into the ground have a lower EV than one that is put in the air? How does the pitcher influence your decision?:
Here’s one graph that will show you it’s really anybody’s guess. Balls can usually be hit with high exit velocity despite the launch angle, but typically balls hit straight into the ground, angles of -40 or below, have a hard time getting above 100 MPH.
Now, it’s time to guess. Decide which hitter had the higher EV and cross your fingers. Want to see for yourself? Here are the links to each individual at-bat.
It may seem strange to have a groundball single take the cake by only .4 MPH. But if this were a leaderboard, Santander would be on top. It goes to show that a high exit velocity doesn’t always translate to a home run. But, exit velocity and launch angle together do. When a sinker low in the zone just doesn’t sink enough, it can go a long way. However, these three outcomes show us that context is key. A ball hit with a proper angle and force can make good things happen. But, that’s also why a sinker, low in the zone in a 3-2 count can make a monster hitter like Ronald Acuña Jr. head back to the dugout. Now, we just need to get him, Santander, and Hiura to swing by the high striker the next time the circus is in town.
Stop me if you’ve heard this one before; Aaron Judge hits the ball hard.
On June 6th, 2022 Dylan Bundy left a changeup right over the heart of the plate for none other than current 2022 MVP candidate Aaron Judge. If you’ve never seen Aaron Judge before, he’s big. He’s not the type of guy you want to leave one over the heart of the plate for. Can you guess what happened? It was smoked. The ball was scorched 116 MPH to left field and while it doesn’t look like much of an issue for the left fielder in the video below, I can guarantee that if it were me (and probably you too) in left field, there would be more avoidance of the ball than intentionally getting in front of it.
I haven’t done a lot of research on Statcast’s xERA metric, but it’s similar to batter xwOBA in that it uses a pitcher’s actual batted balls against to compute what a pitcher’s ERA “should” be. That means for all those who love justifying a pitcher’s low BABIP being the result of allowing soft contact, xERA should theoretically account for this. Now, this doesn’t mean the pitcher will continue to allow the types of batted balls that have resulted in a suppressed or inflated xERA, but it does suggest that what they have already allowed should yield the calculated xERA. So let’s review the pitchers who have most underperformed their xERA marks.
This early in the season it’s easy to jump all over players who are putting up big numbers. But just remember, you drafted a team while considering their projected season-long stats and while it may be tempting to drop a poor performing player at the start of the season for a hot starter, take caution. Players who hit doubles and triples and home runs early in the season can make a lot of noise, as they’re likely to put up strong category stats. Isolated power is a nice statistic that allows us to see, “how often a player hits for extra bases”. But, ISO does not stabilize until around 16o at-bats, and it will probably take another two weeks or so before we can really call this a good sample size. Let’s take a look at players who have shown strong early season ISO, how it compares to the ISO they showed at the start of last year and how that compares to their career average. Read the rest of this entry »