Having attained our dotage, we’ve accumulated quite a collection of apothegms embodying the bitter wisdom we’ve acquired over the years. You reap exactly what you sow. Smart don’t count for much. If it’s misspelled on the menu, don’t order it. There’s no such thing as a quick trip to CVS.
To our collection we must now add: there are no safe relief pitchers. It of course happens—every ten minutes, it seems—that a starting pitcher you were counting on goes down, and you search among the baldies and retreads in the free agent pool for a starter to replace him. Contrarian as ever, we decided before the season that, as starters pitch fewer and fewer innings and get fewer and fewer wins, reliable non-closer relievers become viable alternatives to the Ian Kennedys and Derek Hollands of the world. Read the rest of this entry »
At the beginning of the year, I revealed the latest and greatest xHR/FB rate equation for hitters. I discovered that the new Statcast metric Barrels was highly correlated with home run totals (duh), but better yet, the ratio of barrels to true fly balls (which is just fly balls minus pop-ups), was even more correlated. If Brls/True FB is an important metric for hitter HR/FB rate, then it follows that it’s also important for pitchers as it relates to their HR/FB rate allowed. So let’s compare a pitcher’s Brls/True FB rate to his HR/FB rate and see if we could find any discrepancies that would hint at improvement.
My population was the 92 qualified starting pitchers and that’s what the population average line is calculated from.
Eduardo Rodriguez’s HR/True FB sits below the league average, but not by much. He actually ranks fifth lowest in Brls/True FB, and out of the top 11 that includes him, he has the highest mark, outside of two Rockies pitchers. Fenway Park isn’t a home run friendly park, so can’t blame it on that. While it’s questionable whether E-Rod could actually maintain such a sterling Brls/True FB mark, his HR/True FB rate should probably be in the single digits given what has happened so far. He has maintained that strikeout rate surge he enjoyed last year and is backed by an excellent offense. He should be owned in all formats.
Man, there have been a lot of things that Blake Snell has done to truly impress me. Add his weak contact induced on fly balls to the growing list. Interestingly, he also plays half his games in a home run suppressing park, so you would think that ranking 12th in Brls/True FB would also lead to a single digit HR/True FB rate. With Snell, you’ll always be wondering if his control is going to desert him, but so far, so good. I’m a big fan.
Jameson Taillon allowed a homer in yesterday’s start, and that’s likely to change these rates. That said, he’s the third of three who sits with a HR/True FB rate above what his Brls/True FB would suggest, despite calling a pitching friendly venue home. Taillon reminds me of Gerrit Cole in that his stuff suggests much gaudier strikeout rates. It’s likely a Pirates organizational thing, but it’s silly. What Cole has done in Houston should make the team realize that pitching to contact isn’t a winning strategy.
Wow, what a transformation CC Sabathia has made! As his velocity and strikeout rate has tumbled, he has become better and better at generating soft contact. He needs to sit Felix Hernandez down and teach him how to pitch with diminished stuff. He’s the first guy on here who plays in a home run friendly venue, which certainly would push his HR/FB rate higher than his Brls/True FB. Still, he should be better than this.
Tanner Roark quietly does his thing, putting up solid ERA marks, despite mediocre underlying skills. But this year he’s really squashing fly ball contact quality. His appearance returns us to the list of pitchers playing in pitcher’s parks. Bizarre.
Speak of the devil, I had forgotten that Gerrit Cole made the list when I mentioned him in the Taillon blurb. If there was anything else we could point to in order to describe his dominance.
Jose Quintana easily owns the highest HR/True FB rate on this list, which has conspired to push his ERA above 4.00. Issues with the longball only exacerbates his sudden struggle with control. Interestingly, he never had issues in Chicago, another friendly home run park, and Wrigley Field isn’t nearly as bad. I would still never own a pitcher with such a weak SwStk%, as I don’t believe in his low-to-mid 20% strikeout rate, but at the very least, Quintana’s HR/True FB should decline.
Even as the samples grow larger, pitchers are always changing making it the most volatile market in the fantasy game. This volatility is exacerbated by the tightening talent pool, no doubt due in part due to the ability of teams and players to analyze all aspects of pitching and continually tweak a pitch here or alter mechanics there to unlock a pitcher’s full potential. Following pitchers closely and staying up on those changes is part of the fun of this game.
There is also just the natural ebbs and flows of a season.
Over the course of 30 starts, a guy will have his A+ stuff for 10 starts and then be lucky to have even a single reliable pitch in 10 others leaving those middle 10 to decide their fate. Even the best get knocked around a couple times per year, don’t freak out. Meanwhile, fourth-fifth starters usually end up with 12-15 good starts over the course of a season, even if it’s a 4.75 ERA kind of season, so be careful diving headfirst if it’s the same profile posting outlier numbers. I’ve got 119 guys ranked for June and then the injured guys on their own.
We’ve entered an era where we can no longer just completely ignore Rockies starting pitchers. OK, if you’re in a 10-team league, you needn’t give them a ton of attention, but anything beyond that probably has at least a couple of their guys rostered as spot starters. Perhaps most surprising is the fact that their perceived best has been their outright worst with Jon Gray posting a 5.68 ERA and 1.48 WHIP in 65 innings, though his base skills are also the best of the bunch with a 20% K-BB rate (he’s best among their SPs in both components, too). Yet the less-heralded Kyle Freeland has performed much better across the board (3.48 ERA, 1.23 WHIP) and remains much more available across the main fantasy outlets.
Should we chase Gray’s gaudy skills or settle for the staid workhorse-like profile of Freeland?
It has been 33 days since the Mariners moved Wade LeBlanc into their rotation. In that time he has quietly made six starts, all with game scores of 50 or higher. He has not allowed more than two runs in any of the outings, compiling a 1.72 ERA and 0.99 WHIP.
I say LeBlanc has done all of this quietly, because he is being ignored almost universally in mixed leagues. He is owned in 18 percent of the leagues on CBS and 10 percent of ESPN leagues. You could argue that, for all of LeBlanc’s accomplishments over the last five weeks, there are reasons to avoid him in fantasy. His track record is not exactly distinguished, and in nine prior seasons in the majors, only once did he pitch more than 80 innings. Even with the success LeBlanc has had with preventing runs and limiting baserunners this season, he is striking out batters at a pedestrian 19.1 percent rate.
According to ESPN’s Player Rater, he ranks just 55th in Roto value among starting pitchers over the past 30 days, though he ranks 29th among relief-eligible pitchers. In CBS points leagues with default settings, LeBlanc fares a little better, ranking 4oth among starters and 15th among relievers over the past 28 days.
However, this version of LeBlanc — the one of the last 33 days — has been different. He has been throwing his sinker more often, using it at a 34.0 percent rate, and it’s a pitch he throws for strikes. More importnat, he has substantially decreased his Z-Swing% on the pitch. Last season, hitters offered at his sinkers in the strike zone at a 64.1 percent rate, but this season (including his work in relief) they are swinging at it only 56.8 percent of the time in the zone. LeBlanc has also improved his control on his changeup, but when he locates it outside of the strike zone, he’s getting a few more chases, as his O-Swing% on the pitch has increased from 45.3 percent to 47.7 percent.
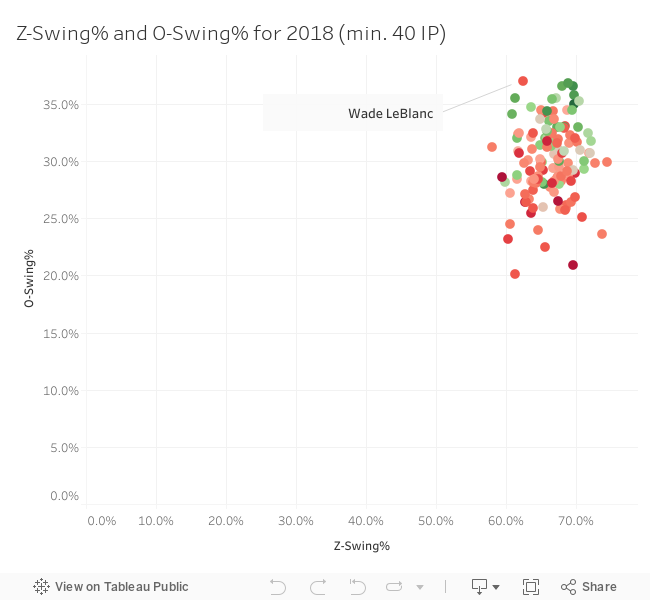
Since the beginning of May, LeBlanc has been almost unique in his ability to both freeze batters on good pitches and induce chases on bad ones. Last month, he and Zack Greinke were the only qualified starters to be among the 10 pitchers with the lowest Z-Swing% and the 10 pitchers with the highest O-Swing%. During that period, LeBlanc was the only one to make the top three of both lists.
The graph below includes stats for the entire 2018 season, and LeBlanc stands out, along with Greinke, Patrick Corbin and Domingo German, as a master of the freeze and the chase. What separates LeBlanc from the other three, aside from fantasy popularity, is the lack of a double-digit swinging strike rate. I have color-coded the pitchers in the graph for swinging strike rate, and the redder the dots, the fewer the whiffs. LeBlanc’s 8.0 swinging strike rate qualifies him for a very red dot.
While I did say that this version of LeBlanc is different, he has posted a high O-Swing% and low Z-Swing in the same season once before. In 2016, he got chases at a 35.7 percent rate and swings on pitches in the zone at a 64.1 percent rate. That year, however, LeBlanc allowed 14 home runs in 62 innings. He did get plenty of harmless flyballs; according to xStats.org, his popup rate was an above-average 22.6 percent. However, his high drive rate — representative of the most damaging type of contact — was 12.6 percent, as compared to the major league average of 10.0 percent.
What truly makes LeBlanc different this season is that he has made his contact-friendly approach work for him. His popup rate is up to 26.8 percent, while his high drive rate is a modest 8.0 percent. LeBlanc has allowed five home runs in 45 innings this season, and as a starter, he has given up three home runs in 31.1 innings. The sheer volume of popups has helped the lefty post a .271 BABIP on the season, and that in turn has contributed to a .240/.279/.368 slash line for opposing hitters.
To sum up, LeBlanc has been getting batters to leave his pitches in the strike zone alone and go after his pitches out of the zone. Hitters are connecting frequently when they do swing, but in contrast to his past track record, LeBlanc is not allowing them to do much damage, particularly in the form of extra-base hits. He is doing several things at an exceedingly high level except the one thing that fantasy owners typically care the most about.
Now that LeBlanc is stretched out, he should build on his grand total of one win, so he may be better than just a top-60 starting pitcher going forward. His lack of strikeouts will limit his value, but the same can be said of Kyle Hendricks, who also relies on favorable walk, called strike and soft contact rates for success. It’s taken Hendricks a while to get his due, and I suspect that even if LeBlanc continues to thrive, it will take him some time to get recognition as well. While there are good reasons to be reluctant to buy into LeBlanc right now, it’s time to take the gamble on him in deeper mixed leagues.
Watch the early innings of a Michael Fulmer start and you’ll see a damn fine 25-year old power arm evolving into one of the game’s quality workhorses. Keep watching, though, and you’ll find him unrecognizable by the sixth inning. Fulmer has consistently melted down in the latter innings of his starts, yielding a ghastly 4.73 ERA and 1.37 WHIP in 66.7 innings. Fulmer actually posted a 2.76 ERA and 1.26 WHIP in April with a lot of the damage coming in his lone blowup outing at Cleveland (3 IP, 9 R… 6 of them earned), but has allowed fewer than three runs just twice in his last seven. The sixth inning has become a clear point of demarcation between Good Fulmer and Bad Fulmer.
It seems like it’s been a decade that we’ve been waiting for a Kyle Gibson breakout. But, this is only his sixth MLB season. Surprisingly, to me at least, he’s actually already 30 years old. It’s not often that a 30 year old pitcher with six seasons under his belt suddenly breaks out.
Brad received a PSA in his chat yesterday that he then shared with us on our Slack channel regarding Jameson Taillon and his new slider:
Joey Boom Bats wasn’t lying! I mean, of course he wouldn’t lie about that. Who would lie about something that is so easily verifiable? Anyway, Taillon does in fact have a new slider and after dabbling with it a few times here and there in previous starts, he had it on full display this past Sunday against the St. Louis Cardinals.
If there is such a thing as a flyball revolution for pitchers, it appears that Blaine Hardy wants to be a part of it.
The Tigers’ 31-year-old reliever-turned-starter induced grounders at a mere 33.0 percent rate last season, but this season, he has gone extreme with a 24.1 percent rate. That might not seem like a good career move for someone who coughed up seven home runs in 33.1 innings a year ago, but he is making it work. In his 20 innings to date, Hardy has allowed two homers and a .143 Iso (which is 23 points below the American League average). Read the rest of this entry »
Back from Portugal! Thankfully, technology is amazing and I haven’t missed a baseball beat. Before I left, I listed and discussed the starting pitchers who had posted significantly worse wOBA against marks than their Statcast xwOBA marks. So today I’ll look at the pitchers on the other side of the coin, those who have most outperformed their xwOBA marks, and therefore may be in for some serious regression.