Much like Hot Right Now, Cold Right Now will be a weekly Ottoneu feature with a focus on players who are being dropped or who maybe should be dropped in Ottoneu leagues. Hot Right Now will focus on players up for auction, players recently added, and players generally performing well. Cold Right Now will have parallel two of those three sections:
- Roster Cuts: Analysis of players with high cut% changes.
- Cold Performers: Players with a low P/G or P/IP in recent weeks.
There won’t be a corresponding section to Current Auctions because, well, there is nothing in cuts that correspond to current auctions.
Roster Cuts
Louie Varland, Leagues with a Cut (7 days) – 24.36%
Varland is a Stuff+ All-Star, having posted great Minor League Stuff+ numbers and very good MLB Pitching+ numbers. The thing is, he’s also not very good. Through 82 MLB IP he has a 4.83 ERA and an even worse FIP. His xFIP and SIERA are stronger, but still not actually good. He has looked good in 41 Triple-A IP but not-so-good in 105 Double-A IP.
My take on Stuff+ is that it can be a very good early indicator if something is changing for a pitcher or if there is something positive going on that we aren’t seeing in the results. But at some point a bad pitcher with good Stuff+ is just a bad pitcher.
Varland is up to 228 innings between the high minors and the bigs and there it’s been up and down, at best. The limited innings in Triple-A have been great; the less limited (but still, to be fair, limited) innings in Double-A and MLB have not. It’s possible a breakout is coming, but I am not holding my breath.
With Varland sent back across town to St. Paul, plenty of managers are bailing and I can’t blame them. There are still hints of an exciting pitcher here, but if you are contending, you have to assume he won’t help you this year and either move on or, if you can, trade him.
John Schreiber, Leagues with a Cut (7 days) – 16.99%
Schreiber emerged as a legit bullpen piece last year and more or less picked up where he left off this year. Then in mid-May he hit the IL with a lat strain and he appeared in the May 22 Cold Right Now because, hey, injured reliever, time to move on! The cuts this week are either re-cuts from managers who were paying him more than $2 early in the year and are cutting back cap penalties now or managers who just finally gave up. He had been throwing as of three weeks ago, so you can imagine some managers were hoping to have him back by now.
This week, however, he was placed on the 60-day IL so he no longer takes up a roster spot. So if you still have him, unless you really need salary relief, you might as well sit on him and see what happens. If he’s a free agent in your league and you can pick him up for $1, I would consider it, as long as cap space isn’t an issue.
Seranthony Domínguez, Leagues with a Cut (7 days) – 16.3%
Dominguez, like Schreiber, is a reliever on the IL, and those are always easy cuts. He also hasn’t been pitching well. So if you did have him on your roster, this injury might be a blessing in disguise. Move on.
Gio Urshela, Leagues with a Cut (7 days) – 16.03%
Despite tanking in 2021, Urshela put up a .344 wOBA over his three seasons with the Yankees. He followed that up with a solid season in Minnesota (.332 wOBA) but has fallen hard again this year. The issue seems to be a continuation of a problem he has had since that last season in New York.
Urshela has never had a huge issue with strikeouts, nor has he ever been great at drawing walks, but he has flashed some solid exit velocities at times and in his big seasons in New York, hard contact drove him. But those have been trending down, and that trend turned ugly this year.

None of that looks particularly inspiring, does it? You can add one other data point to that. In his two best years in New York and his strong year with the Twins, his average launch angles were 13.5, 12.3 and 11.8. In his rough year as a Yankee his average launch angle was 7.5; this year it is 8.3.
He seems to have lost the ability to hit the ball hard and he isn’t elevating it much, at all, hitting a career-high 48.1% grounders.
Of course, the elephant in this section of the article is that Urshela suffered a season-ending injury, but leaving that for last wasn’t a mistake. Injured or not, Urshela had ceased to be a useful Ottoneu player. The injury just makes it that much easier to let him go.
Owen Miller, Leagues with a Cut (7 days) – 15.71%
On May 31, Lucas Kelly covered Miller in his Hot Right Now. Miller was being picked up across Ottoneu, with a hot performance driven by three things:
- An improved K-rate. That has fallen off. Since May 31, he is striking out in more than 23% of plate appearances. When Lucas wrote him up, Miller had decreased his rate of strikeouts for two straight seasons, but if his current form continues, that won’t be true for long.
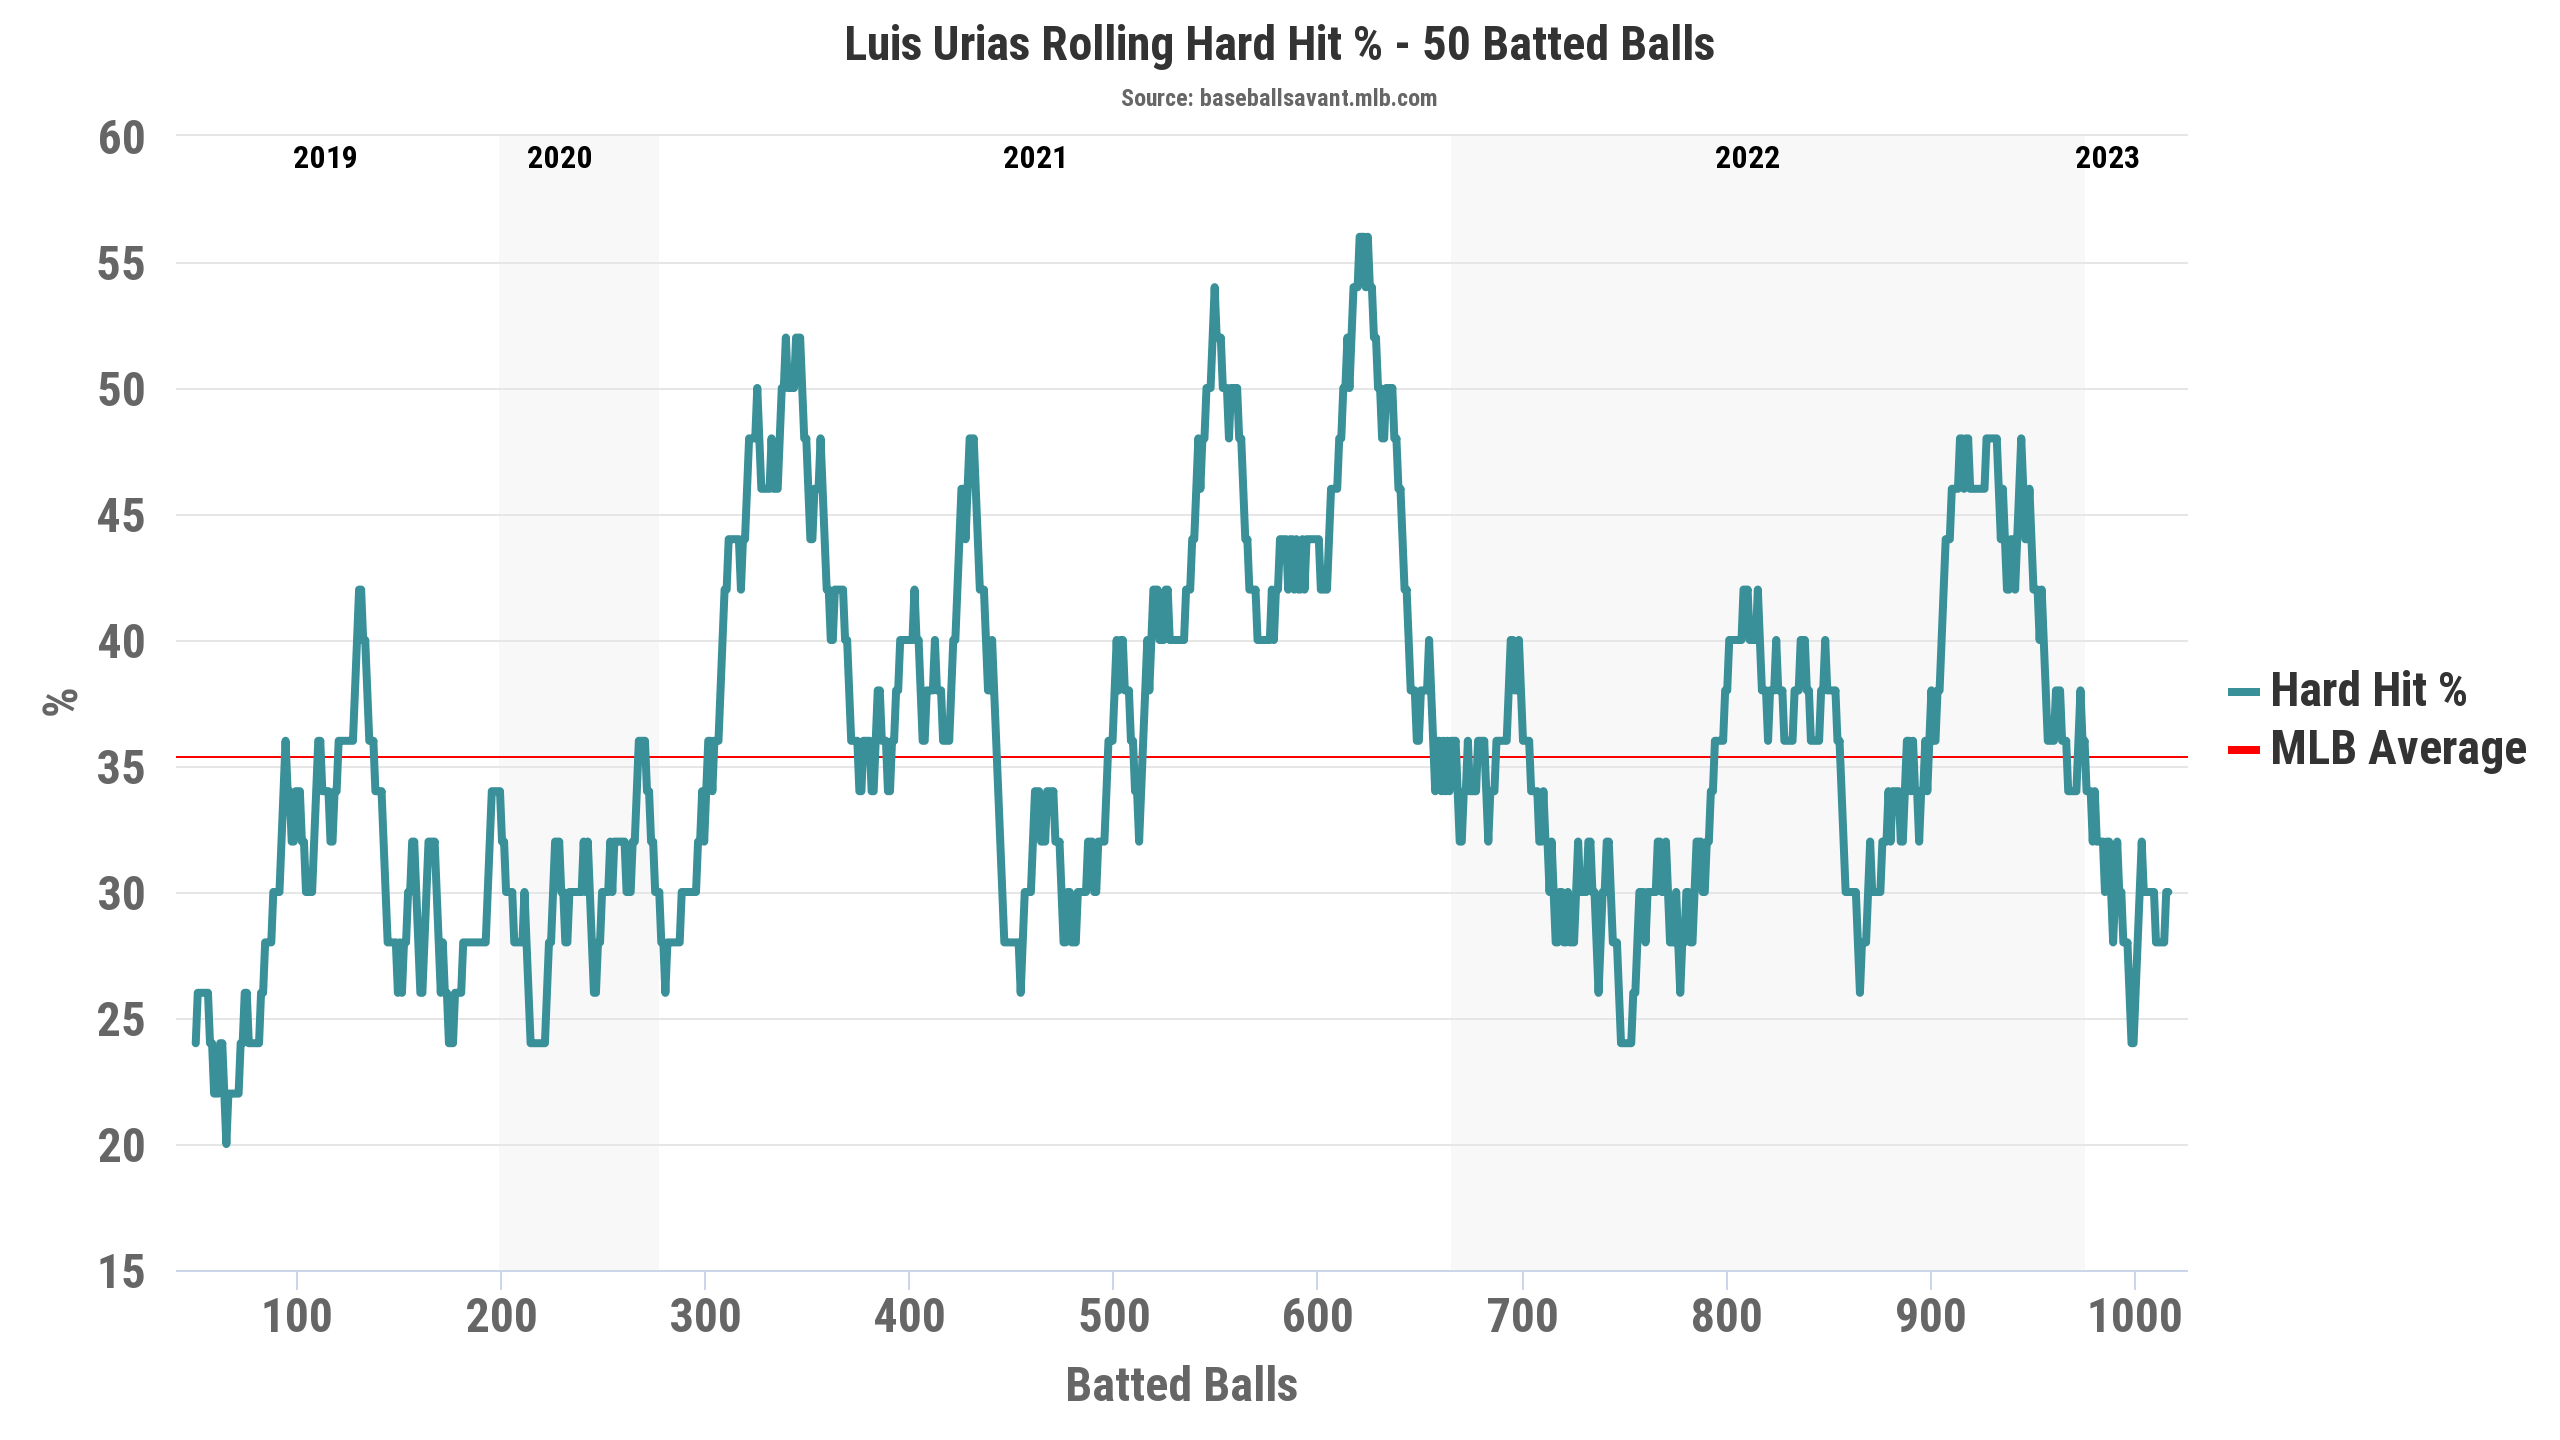
- A sky-high BABIP. That has also fallen off. Since May 31, he has a .250 BABIP, which is a far cry from the .366 he sported before that date. That’s not a huge surprise – guys who don’t hit the ball hard (and Miller does not hit the ball hard) don’t typically sport elite BABIPs for long periods of time.
- Excess playing time thanks to injuries to Willy Adames and Luis Urías. That has also fallen off. The Brewers have gotten healthy and Miller is back to being a bench bat.
None of this, by the way, is new for Miller. His hot streak in 2023 is just his second-best stretch dating back to last year and the explanation is pretty easy to see when you compare his rolling wOBA to his rolling BABIP.
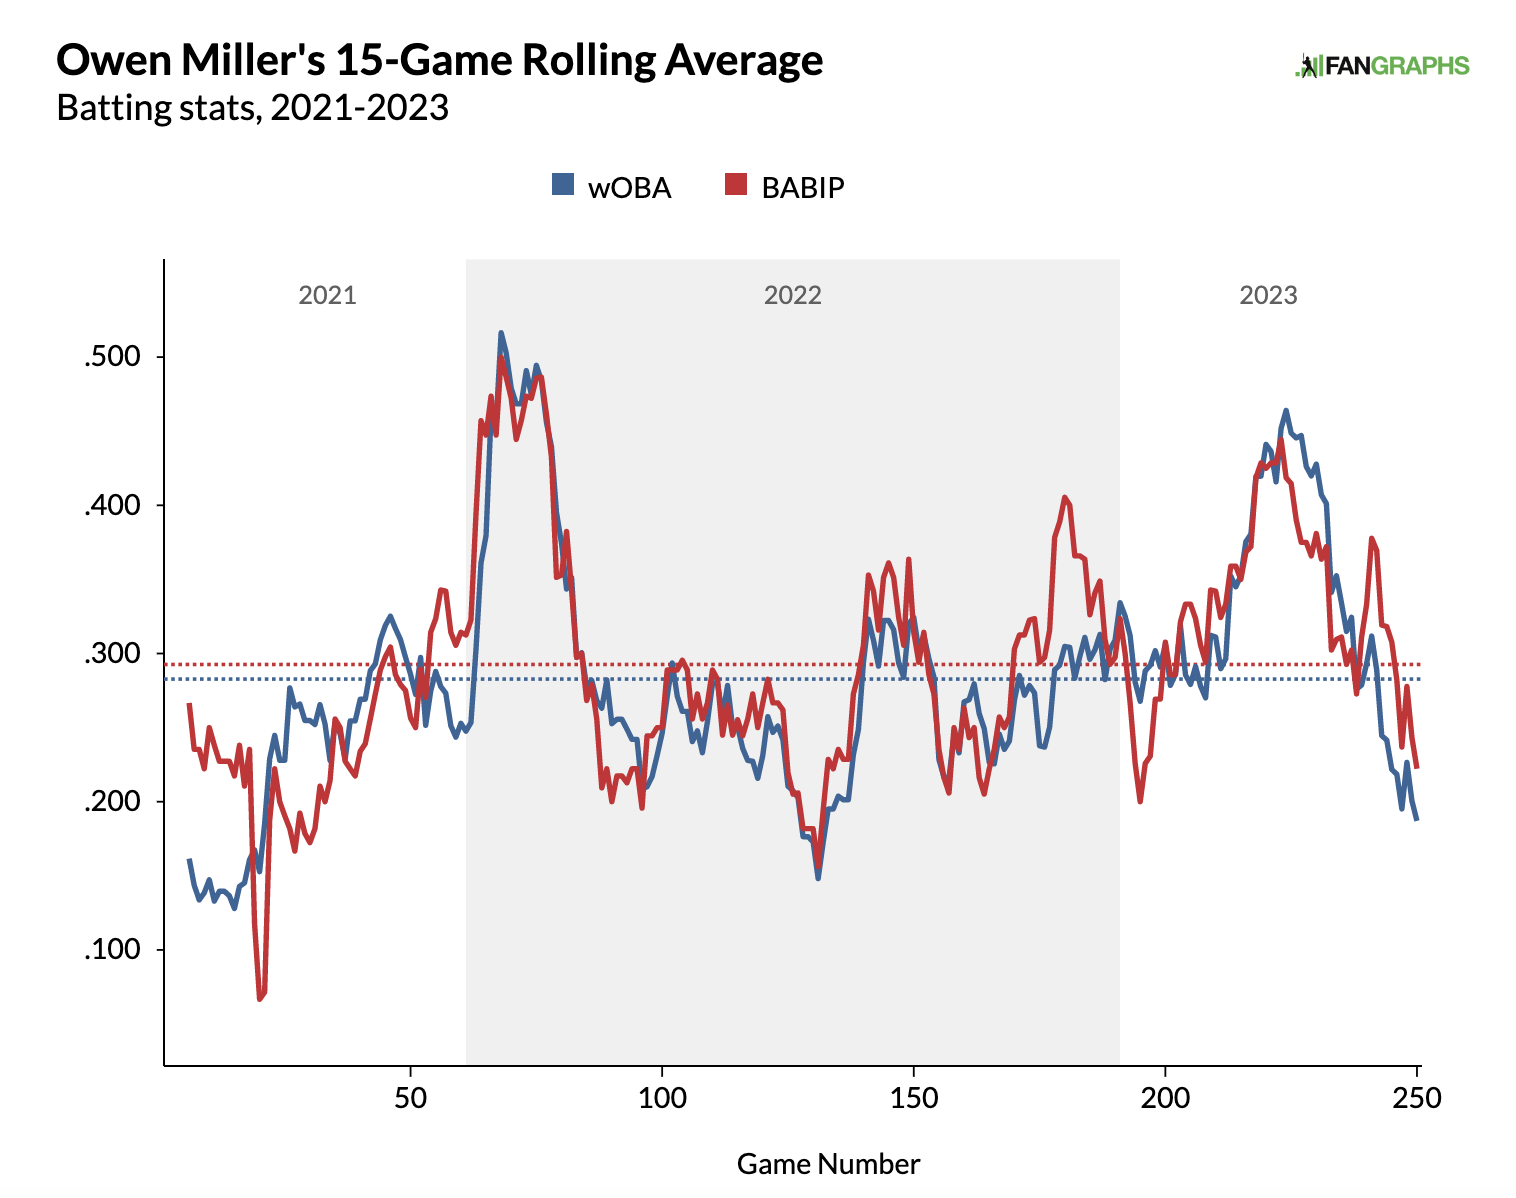
This is pretty straightforward – you can help your wOBA with home runs, walks, or hits on balls in play. If you don’t walk much or hit for much power like, for example, Owen Miller, your wOBA is going to be very highly correlated to your BABIP. And you should note, that graph does not have two scales. His wOBA and his BABIP tend to be, more or less, the same. He has a career .293 BABIP and projects to have a BABIP between .295 and .307, depending on which line of his player page you look at. There is not a lot to get excited about here.
Cold Performers
To measure cold performers this week, I’m looking for players with low P/G or P/IP in the last 14 days.
Josh Donaldson, 0.55 P/G:
In his first two weeks off the IL, Donaldson smacked 5 HR and posted a 128 wRC+ that could have been much higher if not for a .053 BABIP (no, that is not a typo). The crazy thing is that .053 BABIP represents his best stretch of the season, as he has just a .051 BABIP on the year as a whole. Then he went 0-14 over his next four games. And then he stopped playing.
Friday he was a PH and went 0-1. Saturday and Sunday he didn’t play at all. This stretch culminated with Donaldson and manager Aaron Boone having a conversation Sunday and Boone saying Donaldson would be playing more. Of course, this wouldn’t be the first time a manager said one thing and did another, but let’s take Boone at his word and assume Donaldson will be back in the lineup soon. Should he be back in our fantasy lineups?
I think the answer is probably yes. He has a 22.2% barrel rate this year. His His xwOBA (.355) is exactly .100 points higher than his wOBA (.255). That is the largest such gap for any player with 60+ PA this season. Donaldson has seen an increase in his strikeouts this year, but even that is trending the right direction as he has been better since coming back from injury and even better over the last couple of weeks.
There is no way that BABIP can continue to be so low. While the HR/FB rate will drop, as well, he is hitting the ball with authority and plays his home games at a little league field Yankee Stadium, which can only help. I think he is an interesting buy low and he is available in more than 85% of leagues.
Gary Sánchez, 1.92 P/G:
Sánchez joined the Padres on May 30 and for two weeks set the world on fire. For the last two weeks, however, he has kindly focused on lowering temperatures and undoing the damage he caused. His strikeout rate has bloomed to over 30% on the year. Sánchez is not hitting the ball as hard, he isn’t barrelling it much, and his propensity to swing and miss is well-known.
It is worth noting that the last few games have been better and everything we are looking at here is small sample sizes. He was hot for two weeks! He was cold for almost two weeks! He has been hot for like 3 days again!
I don’t see all the same signs with Sánchez that I did with Donaldson (he shares the same low BABIP, but the xwOBA and other Statcast indicators aren’t as exciting and his strikeout rate is heading the wrong direction). But he has one big advantage Donaldson doesn’t: he’s a C and the bar to being successful at C is low. He is also just CRUSHING lefties. A catcher who you can confidently start a couple of times per week facing a LH starter isn’t a bad thing to have on your roster.
Matt Strahm, 1.11 P/IP:
Strahm looked like a breakout for the Phillies earlier this year. Then they moved him to the pen and he was good, but not great. And now things are going off the rails. Strahm has given up 4 HR in his last 8 IP, and it is awfully hard to be a successful Ottoneu pitcher with that kind of HR rate.
While that early success was super exciting, it’s worth noting that he wasn’t really pitching to a better FIP than he had at many other times in his career.
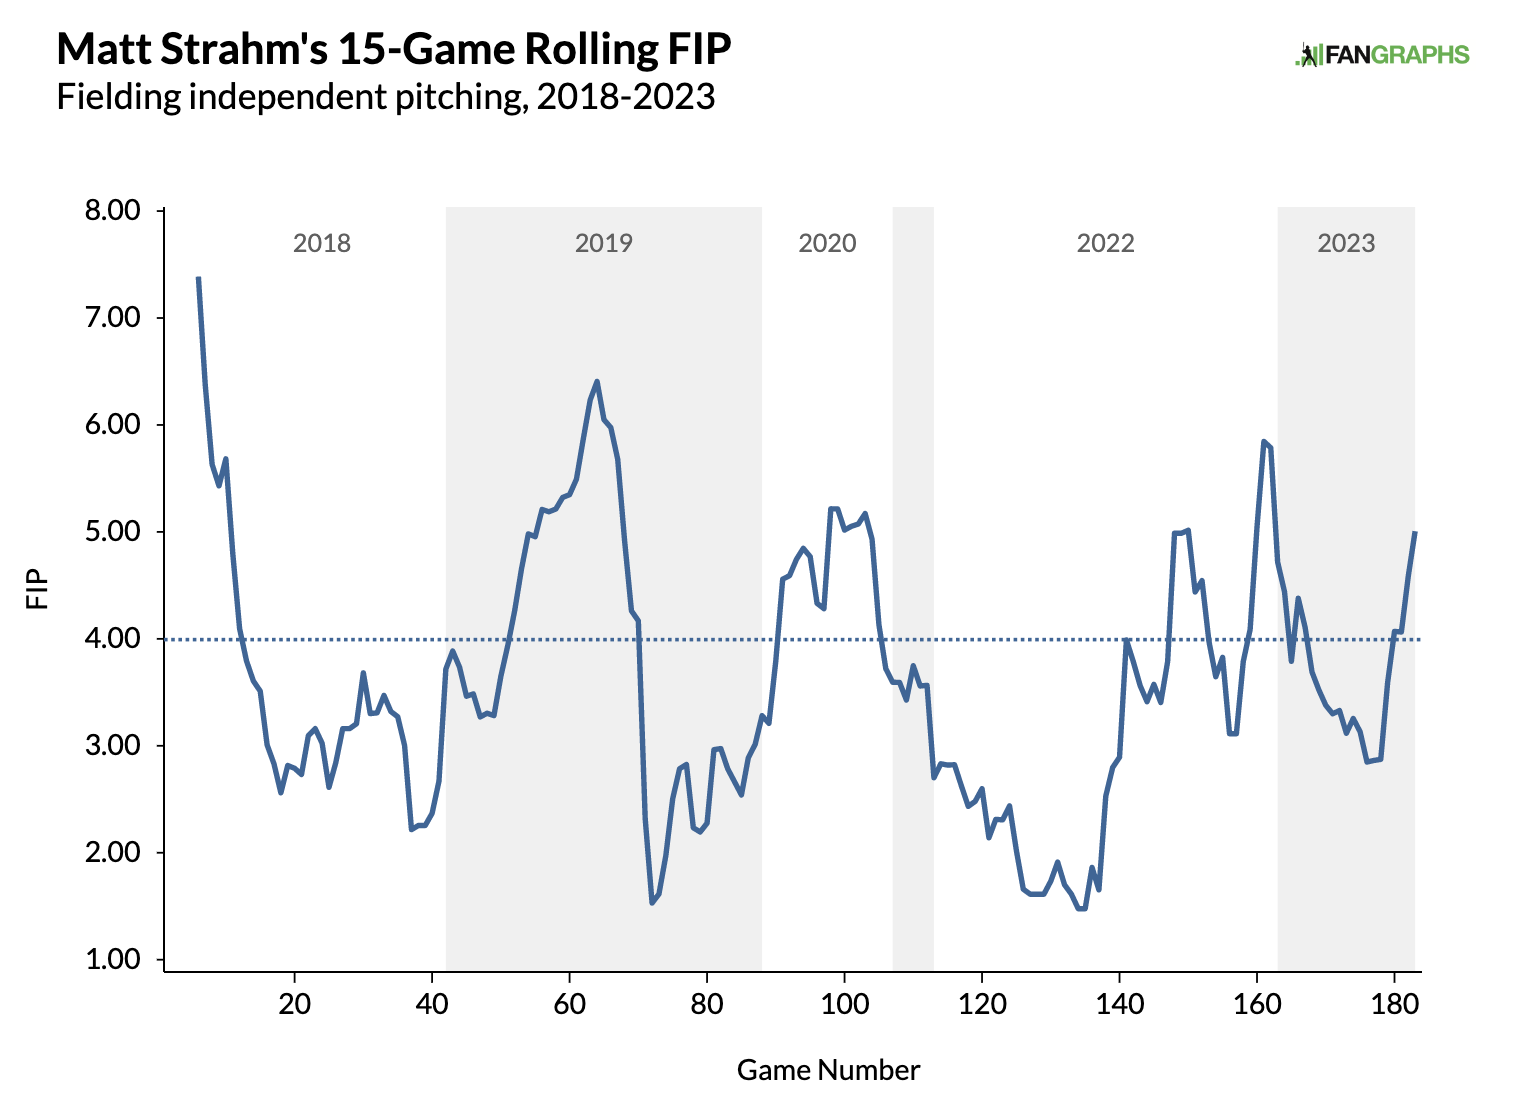
Doing it as a starter instead of a reliever, made it special, but he isn’t a starter anymore. So what do you do with him? He has been cut in more than 40% of leagues over the last month and more managers should be moving on. He isn’t helping you and there really isn’t reason to believe he will. Even if he gets back into the rotation, I would expect regression from his relief numbers (consistent with most bullpen-to-rotation moves) and not a return to his early season success.