Archive for Meta Analysis

Introducing Batter xHR/FB Rate, Version 4.0: The Correlations

Yesterday, I shared the history of my xHR/FB rate equation and the first pieces of research on my journey toward developing Version 4.0. Today, I’ll discuss a myriad of correlations for a myriad of metrics and how those calculations helped me determine which would win a spot in my final equation. Fun!

Read the rest of this entry »


Introducing Batter xHR/FB Rate, Version 4.0: The Research

If it’s really true that Chicks Dig the Long Ball, then how do they feel about the nerds trying to figure out who will hit those long balls and how many of them they will hit? As fantasy owners, the home run is the ultimate result of a hitter’s plate appearance. It counts for a homer, obviously, but also a run scored, at least one run batted in, and a 1.000 batting average. Unfortunately, a hitter can’t also steal a base while rounding the bags on his trot home, but contributions in four of five categories in just one plate appearance seems good enough. Because of the value of a home run, accurately projecting them is one of the keys to a fantasy championship. Luckily, I’ve spent six years trying to do just that.

Read the rest of this entry »


2020 Pod vs Steamer — HR Downside, A Review

Yesterday, I reviewed my home run upside list, where I compared my Pod Projections to Steamer using AB/HR rate. Today, let’s now review my home run downside list.

Read the rest of this entry »


2020 Forecast — Starting Pitcher K% Decliners, A Review

Last week, I reviewed my starting pitcher K% surgers list, so today, I’ll review my starting pitcher K% decliners list, which was assembled using my pitcher xK% equation. Strikeout rates tend to bounce around throughout the season, so it’s pretty silly to be evaluating the accuracy of this list considering the pitchers only made 11 or 12 starts. But it’s all we have, so let’s get to it.

Read the rest of this entry »


2020 Forecast — Starting Pitcher K% Surgers, A Review

Let’s move over to the pitching side where I’ll start my 2020 forecast reviews with strikeout rate, or K%. As a reminder, there is never, ever, ever a reason to evaluate K/9 instead of K%. A denominator based on outs is at risk of being heavily influenced by BABIP, walks issues, field errors, HR/FB rate, etc, because higher numbers in those metrics extend innings and result in additional batters faced, giving the pitcher more opportunities to strike out a batter, even though the denominator has remained the same. That can’t happen when your denominator is total batters faced, like in K%, as more batters faced in an inning will reduce K%, as it should, as opposed to having no effect on K/9.

Read the rest of this entry »


2020 Forecast — Hitter BABIP Decliners, A Review

Today, I finish up reviewing my 2020 Forecast BABIP lists with the BABIP decliners. Once again, I used my xBABIP equation to identify the hitters who most outperformed their xBABIP marks in 2019. Now let’s see how they performed over the short 2020 season.

Read the rest of this entry »


2020 Forecast — HR/FB Rate Decliners, A Review

Yesterday I continued my review of 2020 preseason articles by recapping my HR/FB rate surgers list. Today, I’ll review the flip side, the hitters that appeared on my HR/FB rate decliners list. The list was compiled using my xHR/FB rate, and then I identified the fantasy relevant hitters with the most significant overperformance. Let’s see how they ended up doing over the shortened season.

Read the rest of this entry »


2020 Forecast — HR/FB Rate Surgers, A Review

With hot stove transactions summarized and still no updates on when the season will begin, I’m going to continue to review my 2020 preseason articles. Obviously, it’s pretty silly to review my calls based on a 60 game season, but it’s still fun to look back on and hey, maybe we can learn something. Today’s review is my HR/FB rate surgers. The list was compiled using my xHR/FB rate, and then I identified the fantasy relevant hitters with the most significant underperformance. Let’s see how they ended up doing over the shortened season.

Read the rest of this entry »


Blasts: A Subset of Barrels (Not the Same as Statcast Blasts)

Edit (5/13/24): Hi! Alex here, writing to you from the future. MLBAM just published swing data (it’ll be exciting, I promise you), and one of the marquee metrics for swings on Statcast is called a “Blast.” It has nothing to do with the Blasts herein. As far as I’m concerned, Statcast is the ledger of record, so I will brainstorm new terminology for this so it doesn’t create confusion… although changing the name of my metric might create confusion for the four people or whatever who use it. Anyway, just a PSA for y’all. These are not the same blasts!

I’ve heard (read) a lot of hullabaloo about “not all barrels are equal.” Hullabaloo or not, it’s true; although barrels capture exit velocity (EV) and launch angle (LA) combinations that produce optimal wOBAcon (weighted on-base average on contact) results, the Statcast metric is defined broadly enough to include absolute blasts alongside somewhat-pedestrian hard hits within the same grouping.

The algorithm used to classify barrels is not publicly available (edit: an anonymous tipster alerted me that it, indeed, is available! I think I reverse-engineered it correctly just by sight…), but one can reverse-engineer it easily enough. Here’s a plot of all barrels since the start of the 2017 season.
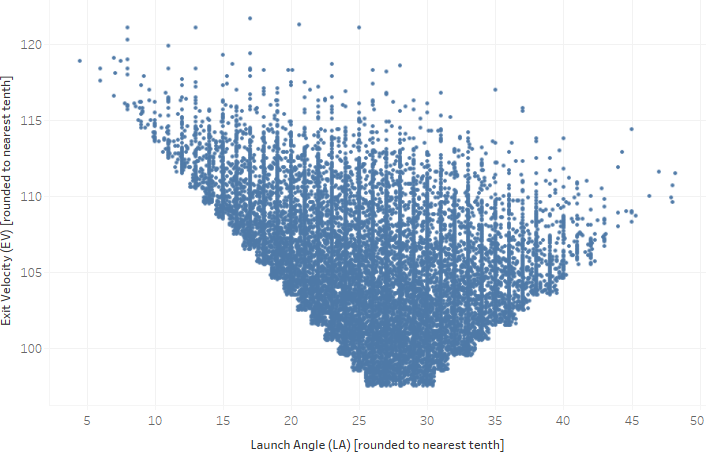
Given the scatterplot, the formula is most likely as follows:

if EV < 97.5 mph, then barrel = no
if LA > 25.5° and LA < 30.5°, then barrel = yes
if LA < 25.5° and (25.5 – LA) < (EV – 97.5), then barrel = yes
if LA > 30.5° and ((LA – 30.5) * 2) < ((EV – 97.5) * 3), then barrel = yes
if EV > 97.5 mph but none of these apply, then barrel = no

“Not all barrels are equal” takes on its meaning once you convert the above scatterplot to a heatmap. I set the low end of the color legend artificially high to show the contrast between barrels that are relatively productive versus those that are massively productive:

Read the rest of this entry »


Hurt Hitters are Outperforming Healthy Ones. Why?

I started diving into the dividing out the effects of injuries limited ramp time for the short season and didn’t get far. Some league-wide rates didn’t add up. Hitters who head to the IL are outperforming the healthy population.

Note: This analysis is math-heavy. I summarized my findings and questions at the end.

To start with, here are the league-wide OPS values for all nonpitchers as I compare the first month as players might have been ramping up.
Read the rest of this entry »
