Lineup Analysis (6/17/22)
American League
Angels
• Brandon Marsh (vs RHP) and Juan Lagares (vs LHP) are in an outfield platoon.
• Taylor Ward (1.034 OPS, 10 HR, 1 SB) is back and leading off. Read the rest of this entry »
Angels
• Brandon Marsh (vs RHP) and Juan Lagares (vs LHP) are in an outfield platoon.
• Taylor Ward (1.034 OPS, 10 HR, 1 SB) is back and leading off. Read the rest of this entry »

This kid is the future:
You love to see it. 🥺 pic.twitter.com/BgHIJPITO3
— MLB (@MLB) June 16, 2022
Eno Sarris’s latest article and starting pitcher ranks include details about pitcher recency and how starting pitchers tend to “go in and out of funks”. It’s a good article, you should read it. But, I was much more intrigued by a Rob Arthur article Eno referenced from 2017 that I had never read before. Arthur and Greg Matthews summarize their research that seeks to predict in-season starting pitcher highs and lows, or hot and cold streaks, based on a pitcher’s fastball velocity. As a fantasy manager whose starters recently gave up 19 earned runs in one night, my interest was peaked by this gem of an article. Read the rest of this entry »
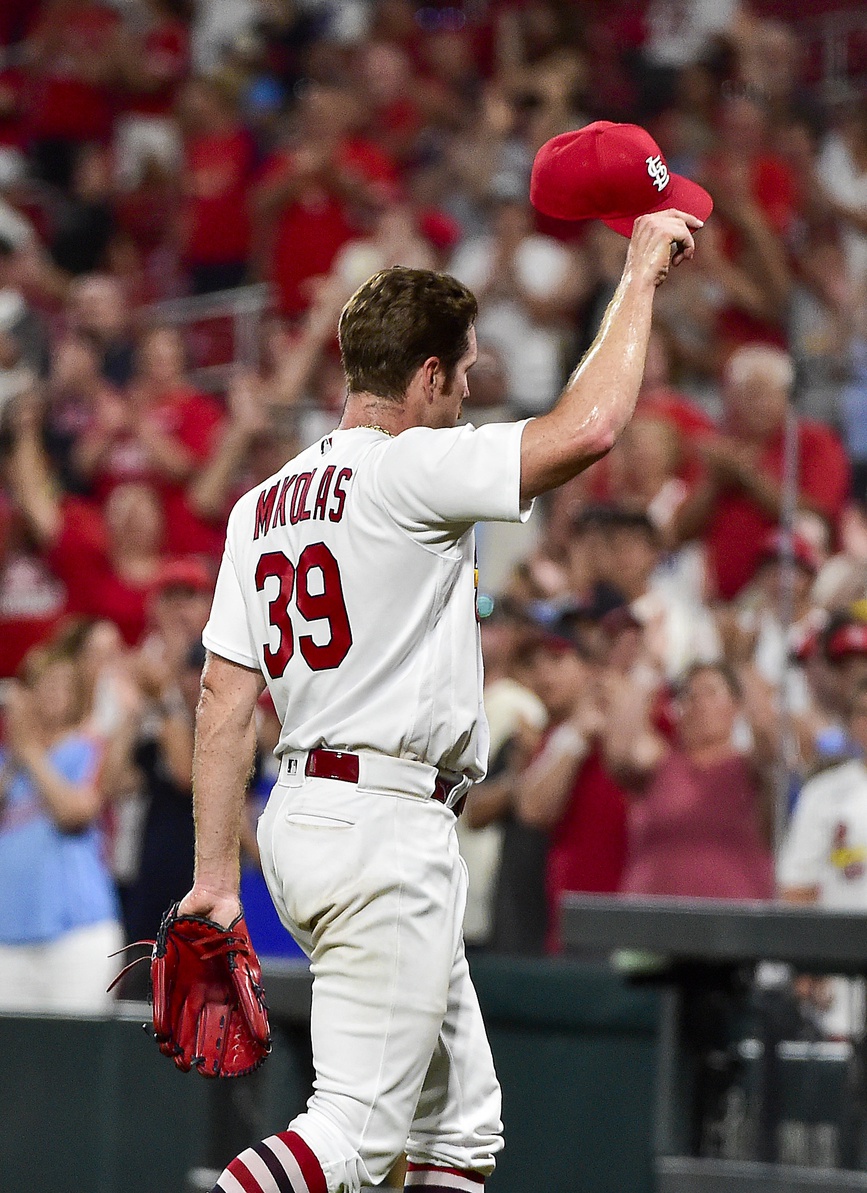
A few thoughts on the pitchers from Tuesday’s games:
| # | Name | Team | IP | H | R | ER | HR | BB | SO | TBF | ERA | WHIP | W | vFA (pi) | vSI (pi) | SwStr% |
|---|---|---|---|---|---|---|---|---|---|---|---|---|---|---|---|---|
| 1 | Tyler Mahle | CIN | 9 | 3 | 0 | 0 | 0 | 0 | 12 | 30 | 0.00 | 0.33 | 0 | 94.1 | 15% | |
| 2 | Miles Mikolas | STL | 8.2 | 1 | 1 | 0 | 0 | 1 | 6 | 29 | 0.00 | 0.23 | 1 | 93.5 | 93.3 | 9% |
| 3 | Chris Bassitt | NYM | 8 | 3 | 0 | 0 | 0 | 1 | 7 | 26 | 0.00 | 0.50 | 1 | 94.1 | 93.6 | 11% |
| 4 | Logan Webb | SFG | 7 | 5 | 0 | 0 | 0 | 3 | 9 | 26 | 0.00 | 1.14 | 1 | 92.8 | 91.8 | 14% |
| 5 | Zach Davies | ARI | 7 | 6 | 0 | 0 | 0 | 0 | 7 | 26 | 0.00 | 0.86 | 0 | 89.6 | 10% | |
| 6 | Tony Gonsolin | LAD | 6.1 | 1 | 0 | 0 | 0 | 2 | 6 | 22 | 0.00 | 0.47 | 1 | 93.3 | 16% | |
| 7 | Gerrit Cole | NYY | 6 | 5 | 0 | 0 | 0 | 1 | 7 | 23 | 0.00 | 1.00 | 1 | 97.9 | 11% | |
| 8 | Logan Gilbert | SEA | 6 | 4 | 0 | 0 | 0 | 1 | 6 | 22 | 0.00 | 0.83 | 1 | 96 | 7% | |
| 9 | Dane Dunning | TEX | 6 | 2 | 0 | 0 | 0 | 4 | 4 | 24 | 0.00 | 1.00 | 0 | 88.3 | 5% | |
| 10 | Corey Kluber | TBR | 6 | 4 | 2 | 0 | 0 | 1 | 3 | 25 | 0.00 | 0.83 | 0 | 87.9 | 89.2 | 7% |
| 11 | Dylan Cease | CHW | 5 | 7 | 1 | 0 | 0 | 1 | 8 | 23 | 0.00 | 1.60 | 1 | 96.4 | 13% | |
| 12 | Matthew Liberatore | STL | 5 | 3 | 0 | 0 | 0 | 2 | 5 | 19 | 0.00 | 1.00 | 1 | 92.7 | 92.4 | 10% |
| 13 | Nick Pivetta | BOS | 8 | 3 | 1 | 1 | 1 | 2 | 3 | 28 | 1.13 | 0.63 | 1 | 94.2 | 9% | |
| 14 | Kyle Hendricks | CHC | 5 | 4 | 1 | 1 | 0 | 0 | 6 | 20 | 1.80 | 0.80 | 0 | 87.1 | 86.8 | 15% |
| 15 | Noah Syndergaard | LAA | 4.2 | 2 | 1 | 1 | 0 | 3 | 5 | 19 | 1.93 | 1.07 | 0 | 95.4 | 94.5 | 9% |
| 16 | JT Brubaker | PIT | 5.1 | 7 | 3 | 2 | 1 | 2 | 5 | 27 | 3.38 | 1.69 | 0 | 93 | 11% | |
| 17 | Shane Bieber | CLE | 6.2 | 9 | 3 | 3 | 1 | 1 | 7 | 29 | 4.05 | 1.50 | 0 | 90.6 | 11% | |
| 18 | José Urquidy | HOU | 6 | 5 | 3 | 3 | 1 | 0 | 4 | 23 | 4.50 | 0.83 | 0 | 93.2 | 16% | |
| 19 | Antonio Senzatela | COL | 6 | 8 | 3 | 3 | 0 | 1 | 4 | 26 | 4.50 | 1.50 | 0 | 94.5 | 4% | |
| 20 | Drew Hutchison | DET | 4 | 5 | 2 | 2 | 0 | 2 | 1 | 19 | 4.50 | 1.75 | 0 | 92.9 | 93.3 | 10% |
| 21 | Kris Bubic | KCR | 5.1 | 5 | 3 | 3 | 0 | 2 | 6 | 22 | 5.06 | 1.31 | 0 | 92.7 | 7% | |
| 22 | Zach Eflin | PHI | 6 | 5 | 4 | 4 | 2 | 0 | 4 | 23 | 6.00 | 0.83 | 0 | 91.2 | 91.6 | 11% |
| 23 | Max Fried | ATL | 5.2 | 6 | 4 | 4 | 0 | 1 | 6 | 24 | 6.35 | 1.24 | 1 | 94.6 | 93.6 | 11% |
| 24 | Jordan Lyles | BAL | 5.1 | 5 | 4 | 4 | 1 | 2 | 7 | 24 | 6.75 | 1.31 | 1 | 92 | 91 | 14% |
| 25 | Joe Ryan | MIN | 4.2 | 5 | 4 | 4 | 2 | 1 | 3 | 20 | 7.71 | 1.29 | 0 | 91.2 | 10% | |
| 26 | Adrian Houser | MIL | 4.2 | 8 | 4 | 4 | 0 | 1 | 3 | 22 | 7.71 | 1.93 | 0 | 94.6 | 94 | 6% |
| 27 | Yusei Kikuchi | TOR | 4 | 5 | 4 | 4 | 2 | 4 | 4 | 20 | 9.00 | 2.25 | 0 | 94.2 | 15% | |
| 28 | Trevor Rogers | MIA | 3.2 | 5 | 4 | 4 | 1 | 6 | 2 | 21 | 9.82 | 3.00 | 0 | 95 | 7% | |
| 29 | Sean Manaea | SDP | 4 | 8 | 5 | 5 | 2 | 1 | 5 | 21 | 11.25 | 2.25 | 0 | 90.7 | 13% | |
| 30 | Bryse Wilson | PIT | 5 | 10 | 7 | 7 | 3 | 1 | 3 | 26 | 12.60 | 2.20 | 0 | 93.5 | 93 | 9% |
Teamwork makes the dreamwork!
A superb relay from the @Dbacks!
(MLB x @CapitalOne) pic.twitter.com/yzurLS9ju6
— MLB (@MLB) June 15, 2022
The 2022 version of Bullpen Report includes five different sections, as well as the closer chart, which can be found at the bottom of the page.
The “RosterResource” link will take you to the corresponding team’s RosterResource depth chart, which will give you a better picture of the full bullpen and results of the previous six days (pitch count, save, hold, win, loss, blown save.)
Click HERE to view the full Closer Depth Chart.
6/14/22
The latest episode of “The Sleeper and the Bust” is live. Support the show by subscribing to our Patreon!!
Follow us on Twitter
PATREON
PAUL’S SP RANKS
Aces
Podcast: Play in new window | Download
Subscribe: RSS
The runs have been raining down as of late, at least relative to the spongeball square offenses that we’ve had to suffer through during the first part of the season. Whether this is due to the increasing temperatures decreasing the overall effects that league-wide humidors have wrought, or to MLB more nefariously (definitely not) switching out the baseballs, doesn’t matter as much.
What does matter is that these dongs of summer are finally giving fantasy managers a respite in their offensive categories. With that in mind, let’s take some different looks at the so-called power hitters that have hurt their drafters the most through the first third of the season, starting with the ones most likely to turn things around. Read the rest of this entry »
While the NFBC Main Event garners most of the attention, there are a handful of leagues with even a larger entry fee ($2.5K to $15K). They get originally named “High Stakes Leagues” and this year there are nine of them. With so much money on the line, these fantasy managers are going to try to gain any advantage. Most of the time, these managers will be a week or two ahead of everyone else on their adds. Here are the players and some information on the ones added in five or more of these leagues.
This is long overdue, but thank you for the patience.
I’ll aim for 3-4 wk intervals going forward and it will usually fill in for a Monday version of Boxscore Bits as it is today (and into Tuesday… this one took awhile!). They should be viewed in a 3-4 wk context, too. Trying to think for the entire rest of the season is unnecessary because we know things will change and we are allowed to change our roster so a narrower focus will help you sort things out as you run through the many globs of pitchers where the talent isn’t that far off so you look toward more secondary factors to make the decisions (recent performance, schedule, supporting offense/defense, venue, etc…) on a week-to-week basis.
I do have larger groupings when it comes to in-season rankings with 6 tiers of ranked arms and then injury and prospect guys. Aces, Must Start, Usually Start, Team Streamer, Standard Streamer, and Deeeep Leagues. There isn’t a big split between Usually Start and Team Streamer (guys who you purposefully curate their starts, but don’t cut them when not starting them because of their upside) as the US group has guys you consider sitting at COL or against a high-powered offense you’re afraid of (NYY, NYM, BOS, HOU, LAD off the top of my head) where as the TS group is must-sit in those situations among others such as a home/road split (like Mahle, for example).
While my focus is primarily on 15-team mixers, these should work pretty well across the 12s and even 10s with slight adjustments based on your league. I’m quite confident starting the top 2 tiers (45 starters) across all formats and then there are some adjustments to be made in the streaming tiers for 10s and 12s which you can apply based on how your league facilitates streaming (daily/weekly pickups, pickup limits, scoring system).
I’m writing up all of the Aces, but not everyone will get a note in the tiers after this one
| Rk | STARTING PITCHER | TM | Spring Rk | Diff. |
|---|---|---|---|---|
| 1 | Gerrit Cole | NYY | 1 | 0 |
| 2 | Shane McClanahan | TBR | 24 | 22 |
| 3 | Corbin Burnes | MIL | 4 | 1 |
| 4 | Zack Wheeler | PHI | 13 | 9 |
| 5 | Sandy Alcantara | MIA | 6 | 1 |
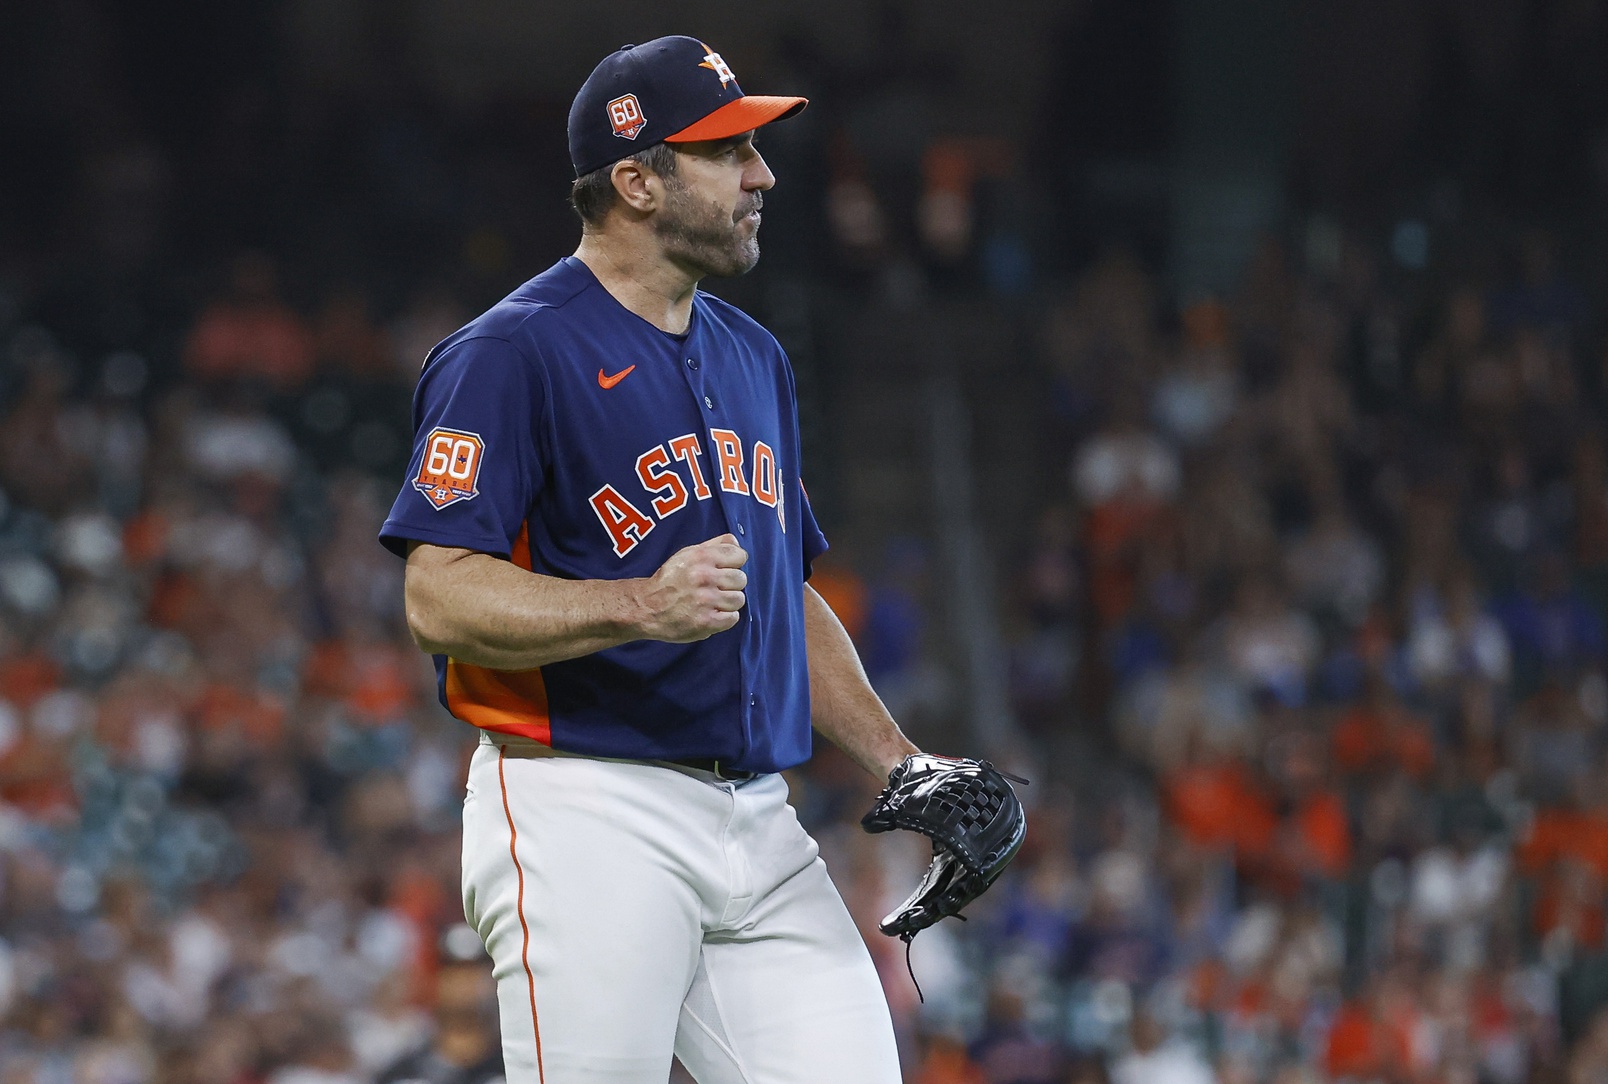
| 6 | Justin Verlander | HOU | 18 | 12 |
| 7 | Joe Musgrove | SDP | 8 | 1 |
| 8 | Kevin Gausman | TOR | 27 | 19 |
| 9 | Max Fried | ATL | 10 | 1 |
| 10 | Pablo López | MIA | 53 | 43 |