Trades are the lifeblood of fantasy baseball home leagues. The conversations around them help keep us connected, engaged, and make our league more fun. Striking deals isn’t always easy. There are often hurt feelings around lopsided proposals, league-mates who value players differently, and that one guy who wants to veto everything. We can improve our fantasy squads with the waiver wire, but our collective hit rates are low. Quite often, those pickups backfire in the form of a hitter’s cold streak or a pitcher’s blowup, which inevitably leads to dropping the player. The one facet we have control of in home leagues is trading.
Managers are often emotionally tied to certain players – specifically, ones they’ve drafted or ones they targeted in drafts and missed. Also, we’re not all great at zooming out for a long-term view and not being stuck in the moment. Good analysis can be washed away by recency bias and small sample sizes. No one can force us to make a deal, so it’s the one element of the game we have some control over and can use proper value assessment and negotiation techniques to our advantage.
This column will recommend hitters and pitchers to attempt to sell-high or buy-low, and touch on trade strategies. No two leagues or two managers are the same. You know your league-mates best: what kind of deal they’ll scoff at, which player type they’re willing to deal or acquire, and how good their player and market valuation skills are. I’ll do my best to dig deep and present realistic opportunities. If there’s someone in your league who will swap their Josh Naylor (0-19 through five games) for a red-hot Joey Wiemer, it’s probably time to find a new manager for their spot, or a more competitive league. Early in the season is usually a great time to take advantage of a good deal, as we can potentially lean into targeting players who are off to slow starts. We can also use fandom to our advantage, specifically when we know a league-mate is a diehard fan of a specific Major League team and may be blinded by subjectivity.
In this week’s FAAB and Waiver Wire Report, I mentioned that José Soriano’s fastballs were a matched pair with a short description of the concept. I wrote the idea up in this year’s edition of The Process, but here is another description of it (so I can link it instead of writing it up every time I mention it). Besides the matched fastballs, I discuss having a unique drop rate compared to the other pitches, which leads to a plus pitch. Read the rest of this entry »
The chart includes their performance for 2025 until we get some actual data for this year (I changed over in late-April last year), their opponent’s wOBA versus the pitcher’s handedness from last year (not a perfect solution as teams change in the offseason, but better than using just a few days of data from this year), my general start/sit recommendation for 10-team, 12-team, and 15-team (or more) leagues, and then a note about some, most, or all depending on the day. Obviously, there are league sizes beyond those three so it’s essentially a shallow, medium, deep. If a pitcher only has an “x” in 15-team, it doesn’t mean there’s no potential use in 10s and 12s, but it’s a much riskier stream for those spots.
These are general recommendations, and your league situation will carry more weight whether you are protecting ratios or chasing counting numbers. This is for standard 5×5 roto leagues. The thresholds for H2H starts are generally lower, especially in points leagues so I thought there would be more value focusing on roto.
I usually won’t have much to write about aces who are locked into our rotations, you don’t really need a shiny stat to be convinced on starting guys like that. If you want to discuss someone further, please feel free to leave a comment and I’ll get you an answer when I can. I try to do a few sweeps of the comments before game time in case there are time-sensitive questions.
Every Monday, this column will break down the most popular waiver wire and free agent acquisitions of the weekend.
Fantasy baseball managers know that our game is the ultimate test of grit, grind, tenacity, and patience. Unlike fantasy football, where league titles can be won with minimal in-season activity, fantasy baseball leagues require incessant attention and activity. Particularly when it comes to free agent adds and drops. Real-life baseball managers are constantly adjusting batting orders, players are frequently optioned to and promoted from the Minor Leagues, and injuries occur almost daily. There’s no resting on our laurels. We must always stay vigilant with league news and notes and remain active on the waiver wire if we want to win our leagues.
Every week, I’ll dig into the top adds on the ever-popular Fantrax and in the NFBC Online Championship (OC), a national mid-stakes contest with 240 total leagues of 12 and a six-figure grand prize. Reviewing player adds between the two should provide us with a well-rounded perspective and barometer of the fantasy baseball marketplace.
Week 2 Overview
The 2026 season is only five days old, but we’d be lying if we said we weren’t already on tilt with certain players we love and have drafted. Wyatt Langford and Bo Bichette have started the season off slumping (1-14 each). Paul Skenes, Jesús Luzardo, Nathan Eovaldi, and Logan Webb have already set our ratios back, and I’m sure some would like to forget about what happened to Carlos Estévez on Saturday night (I’ll remind you: six earned runs). For every stud who has scorned us, there is a guy in the free agent pool who earned a save, twirled a gem, or hit two bombs over the weekend. Sometimes, a few of those players end up on our squads for the long haul and provide phenomenal value. Most of the time, though, these are players we’ll be throwing back into the FA pool with no roto life vest after they’ve fooled us and decimated our WHIPs and batting averages. Speaking of, where’s Kyren Paris playing these days?
Fantasy managers in the OC and on Fantrax were mostly in sync with the top targets and acquisitions of this past weekend. Let’s review the groups.
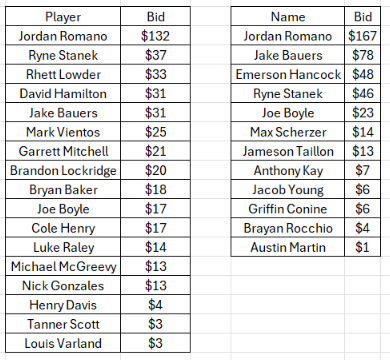
NFBC Online Championship – Top Average Winning Bids
Roster % is the current percentage of leagues rostering the player; +/- is the percentage of leagues the player was added in the previous week
Closers
There are very few better feelings in fantasy baseball than scooping up a closer off waivers or free agency early in the season. Around this time last year, there were three big pickups – Emilio Pagán, Will Vest, and Luke Jackson. Pagán worked out splendidly, Vest earned 20+ saves. Jackson didn’t pan out, though he was racking up saves in the first month. Jordan Romano, Lucas Erceg and Cole Sands were the big three pickups of Week 2.
The closers job for the Angels was up in the air through most of the offseason. They signed veterans Romano, Kirby Yates, and Drew Pomeranz (a lefty). Robert Stephenson got hurt again, and Ben Joyce wasn’t quite ready, so it seemed like Yates was in the lead. Yates landed on the IL (knee inflammation) two days before the season. Romano took the bull by the horns coming off a strong spring (6 IP – 1 ER – 1 BB – 6 K), earned a clean on save on Thursday and pitched a scoreless ninth in a non-save situation on Friday. Market sentiment has been polarizing on Romano. He was added in 28% of Fantrax leagues and 80% of OCs with an average winning bid of $173, but there are many managers out there who are dubious on his ability to stay healthy. They also can’t forget about last year’s ratio reckoning (8.23 ERA, 1.45 WHIP in 42.2 IP). Will he hold the job all season? Nobody knows. That’s why we play the game. Yates is expected back soon, but isn’t likely to outright steal the job from him, unless it’s the perfect storm of Yates dominating while Romano is faltering. I’d bet on Romano holding the job down for at least the next two months.
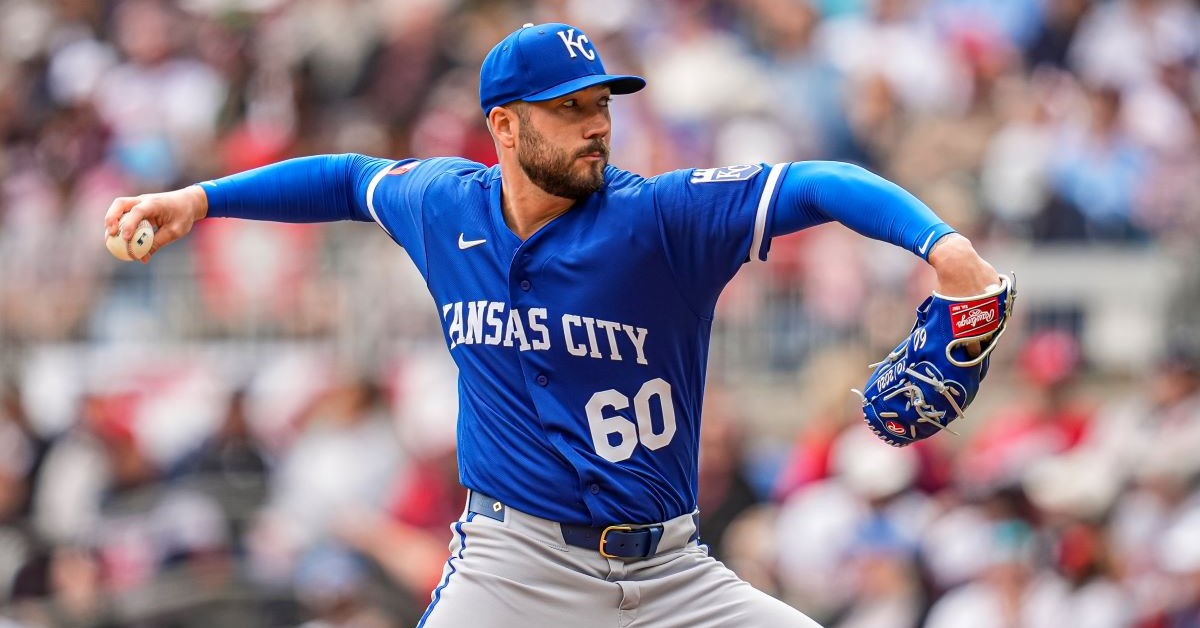
The heavy Lucas Erceg waiver/free agent activity is a case of utilizing our fantasy instincts and common sense. Estévez overperformed his underlying metrics last season and was struggling with extreme velocity dips in the spring. Had Erceg not earned a save this weekend, I’m sure he would still be a popular acquisition, considering Estévez’s struggles. Erceg was a dominant high-leverage reliever for the Athletics in 2024 (22.1% K-BB, 13.8% SwStr). He was serviceable last season with the Royals, though his strikeout rate took a massive tumble from the previous season (28.5% to 19.3%), though he wasn’t at full health. Erceg is the top righty in this bullpen and has a good chance to run away with this job. Estévez has been a solid ninth-inning guy over the last few seasons, but is clearly not at full strength and he is now being evaluated for a possible IL stint. Erceg is the priority add in daily leagues with saves.
I can almost assure you that the Case of Who is the Twins Closer is far from being solved. Cole Sands earned the save opportunity on Saturday and closed it out. He walked one, struck out two and didn’t allow a run in their 3-1 win over the Orioles. On Thursday, lefty Taylor Rogers pitched the final inning (eighth) in a non-save opportunity. Rogers has much more closing experience, but his skills have been slowly dissipating over the last couple of seasons. Sands doesn’t have dynamic stuff nor is he a prototypical closer (sub-10% swinging strike rate in 2025), but he has plus control and a low career walk rate (6.9%). Sands could run away with the job, but I believe that new manager Derek Shelton will deploy Sands or Rogers situationally, depending on whether opposing lefties or righties are coming up in the ninth. Justin Topa could earn opportunities as well, but is behind Sands and Rogers in the pecking order for now.
Starting Pitchers
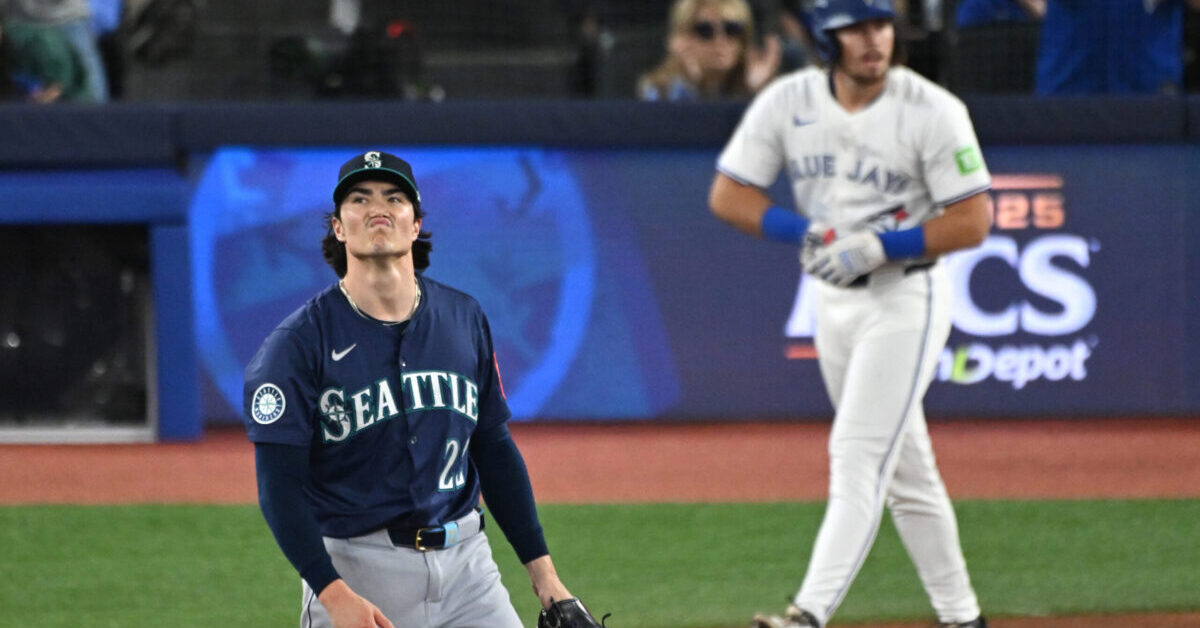
Emerson Hancock snuck up on the fantasy world with an impeccable outing on Sunday night – nine punchouts and no hits allowed over six innings. Social media was raving over his new sweeper and pitch mix changes as fantasy managers ran to their waivers to acquire and to increase their free agent bid amounts. Hancock had been inconsistent across 28 starts over the last two seasons, including several ERA-damaging outings of 5+ earned runs or more. Hancock certainly looked like a different guy on Sunday night. Will he be a top 20 SP? Probably not. Could this be his breakout season? Very possible. Bryce Miller is no lock to take Hancock’s rotation spot, let alone remain healthy for the season. If Hancock is pitching well when Miller returns, it’s likely that Miller is moved to the bullpen in a multi-inning capacity. One start is far too small of a sample to base strong stands around, but I’m happy to give a talented arm in Seattle the benefit of the doubt.
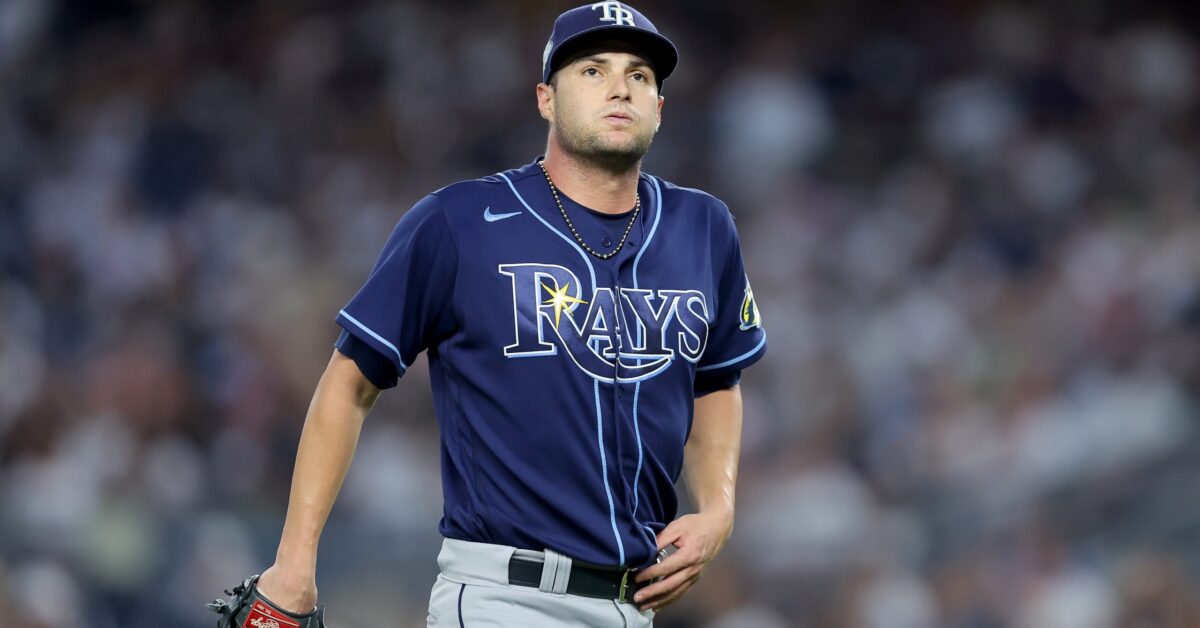
Kyle Harrison is rostered in most 15-team leagues. His roster rate in OCs was raised from 77% to 99% with a two-start week on tap against the Rays (home) and Royals (road). Harrison had a 20:4 K:BB with nine earned runs allowed in 14 spring innings. He developed a blister before the season started, but is ready to go for his Brewers’ debut. If this week goes poorly, expect to see him back in the free agent pool next weekend. I will be paying close attention to the details instead of just combing the box scores. Harrison and new teammate Brandon Sproat (disaster start on Sunday) are talented pitchers in a good organization and we shouldn’t judge them too harshly on small samples. On the flip side, they’ll have to earn their keep because Logan Henderson (in Triple-A) and Quinn Priester (expected to return in late-April) will be lurking.
Padres righty Randy Vásquez was a popular pickup on Fantrax after his strong outing against the Tigers on Saturday: 6 IP – 2 H – 0 ER – 3 BB – 8 K. Vásquez posted a 3.84 ERA (5.51 xFIP, 5.43 SIERA) in 133.2 innings last season, most of them as a starter. He hasn’t been helpful in strikeouts (14% K rate since 2024), but his velocity uptick on Saturday’s start was significant (FB up from 93.4 to 95 mph). Fantasy managers with deep rotations should consider alternatives for this week since he faces the Red Sox in Fenway. We can start him with confidence for his Week 3 start, at home against the Rockies.
Pirates RHP Carmen Mlodzinski is a guy to monitor in public and home leagues across the world of Fantrax, RT Sports, ESPN, CBS, and Yahoo. He opened last season in the rotation, but it was a rough run — a 5.67 ERA and 1.61 WHIP over nine starts. He was converted to a relief role, and excelled in it — 2.12 ERA, 1.10 WHIP, 25.5% K, 6.3% BB in 59.1 IP. He punched out eight Mets in 4.1 innings on Sunday and lines up to face the Orioles at home this weekend.
Hitters
Guardians rookie Chase DeLauter is the hottest hitter in the Majors in the first half-week with four home runs in 17 plate appearances. His roster percentage is up to 94 on Fantrax and 78% on Yahoo. He is locked into the two-hole between Steven Kwan and José Ramírez for the foreseeable future.
Joey Wiemer has appeared in only 48 games since his 2023 rookie season with the Brewers when he hit 13 homers with 11 steals and a .204 average in 410 plate appearances. He earned a job in the Nationals outfield as a short side platoon bat. Wiemer has yet to record an out – six hits and two walks in eight plate appearances. Wiemer likely won’t start against righties often, though he earned one on Monday. Nevertheless, he feels like a flavor of the week we shouldn’t be prioritizing unless it’s a deep 18-teamer or NL-Only league.
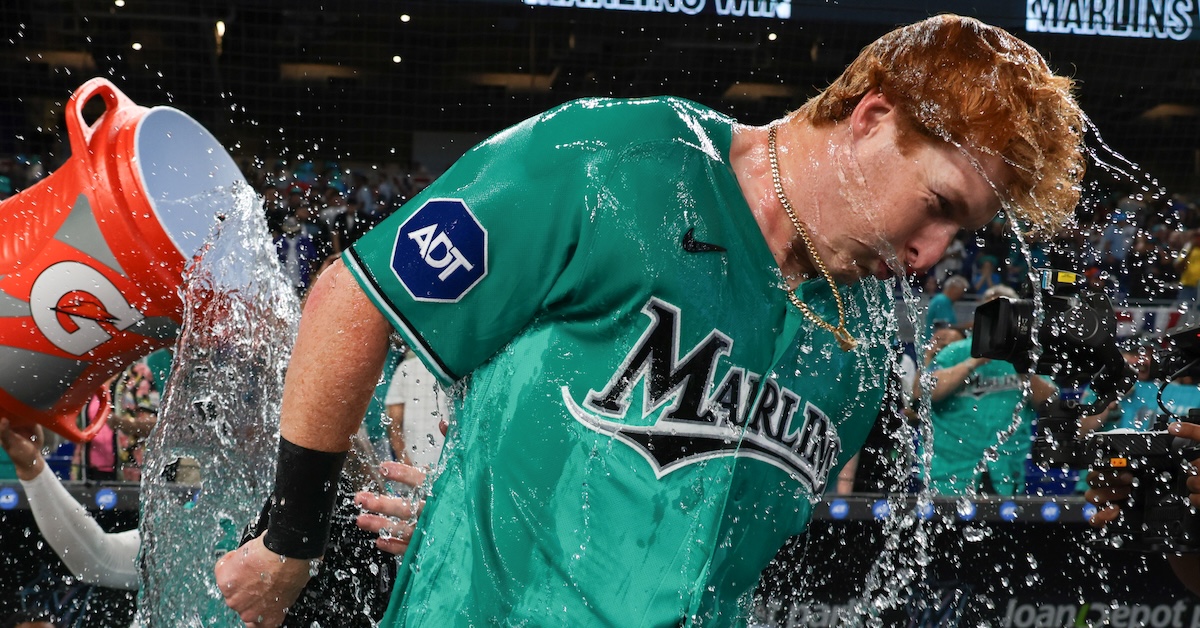
Some hot pickups with potential staying power in 12-team leagues and higher are Nasim Nuñez (2B/WAS), Jordan Walker (OF/STL), Dominic Canzone (OF/SEA), and Owen Caissie (OF/MIA). Nuñez popped as a 25+ stolen base guy in projection models this season. Walker worked hard this offseason at Driveline to retool his approach at the plate, had a mediocre spring training, but is off to a strong start through his first three games – .400/.500/.900 with six runs scored and a 100.4 mph average exit velocity (albeit, a tiny sample). Canzone and Caissie are strong side platoon bats for their respective teams. Canzone smashed two dingers in Seattle’s first game. Caissie is 5-10 with a homer and a 25% barrel rate through his first three games. Daily leaguers can optimize matchups this week, but folks in weekly or half-weekly leagues should consider benching them. The Marlins are slated to face 2-of-6 southpaws and the Mariners 3-of-6, which projects their max games played this week at four (Caissie) and three (Canzone). Our shallower leagues should have a better outfielder to start this week.
Drop of the Week
Sadly, it’s Andrew Vaughn of the Brewers. He suffered a hamate fracture in his left hand is expected to miss 4-6 weeks. Vaughn is worth stashing on your IL, or on the bench of 15-team leagues with a bench of eight or more. Otherwise, feel free to cut him and keep abreast of his return to pick him up in about a month or so.
Quick note before we dive into tiny samples: I recently launched ProjectingX IQ, which is now focused on in-season edge by identifying real skill changes and separating signal from noise as the season unfolds. If you want to see which players are actually improving (or quietly regressing) before the results catch up, you can learn more at ProjectingX.com
Now back to your regularly scheduled programming. Though no actionable advice may come from taking a plunge into the icy tiny sample size waters, it’s still fun to swim around and explore what’s happening. This is an annual ritual of mine since it’s only this early that a player can have a wOBA and xwOBA over 1.000, which is totes super fun.
And just like that, we’re back! Welcome to the Daily SP Chart.
The chart includes their performance for 2025 until we get some actual data for this year (I changed over in late-April last year), their opponent’s wOBA versus the pitcher’s handedness from last year (not a perfect solution as teams change in the offseason, but better than using just a few days of data from this year), my general start/sit recommendation for 10-team, 12-team, and 15-team (or more) leagues, and then a note about some, most, or all depending on the day. Obviously, there are league sizes beyond those three so it’s essentially a shallow, medium, deep. If a pitcher only has an “x” in 15-team, it doesn’t mean there’s no potential use in 10s and 12s, but it’s a much riskier stream for those spots.
These are general recommendations, and your league situation will carry more weight whether you are protecting ratios or chasing counting numbers. This is for standard 5×5 roto leagues. The thresholds for H2H starts are generally lower, especially in points leagues so I thought there would be more value focusing on roto.
I usually won’t have much to write about aces who are locked into our rotations, you don’t really need a shiny stat to be convinced on starting Kirby or Sale. If you want to discuss someone further, please feel free to leave a comment and I’ll get you an answer when I can. I try to do a few sweeps of the comments before game time in case there are time-sensitive questions.
In the article, I cover the players using CBS’s and Yahoo’s ADD/DROP rates. Both sites have the option for daily and weekly waiver wire adds. CBS uses a weekly change while Yahoo looks at the last 24 hours. Yahoo is a great snapshot of right now, while CBS ensures hot targets from early in the week aren’t missed. I start players being added at CBS who started the week on less than 40% of rosters.
The players are ordered for redraft leagues by my rest-of-season preference, grouped by hitters, starters, and relievers.