
The 2020 ATC Projections
The first cut of the 2020 ATC Projections have arrived! Fantasy baseball draft prep season is now officially ready to be thrusted into high gear!
There are three ways to view and utilize the ATC projections on this site.
- Full Projections
- Individual Player Pages
- Auction Calculator
Full Projections
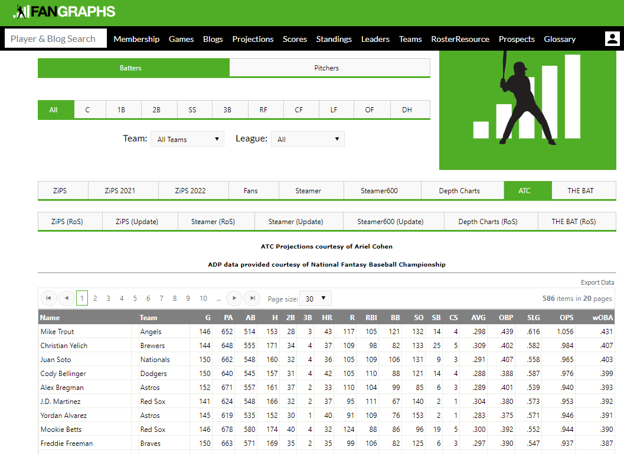
The full ATC projections can be found by heading to the “Projections” drop-down tab on the menu bar by clicking on “ATC.”
Full 2020 ATC Hitter Projections
Full 2020 ATC Pitcher Projections
Individual Player Pages
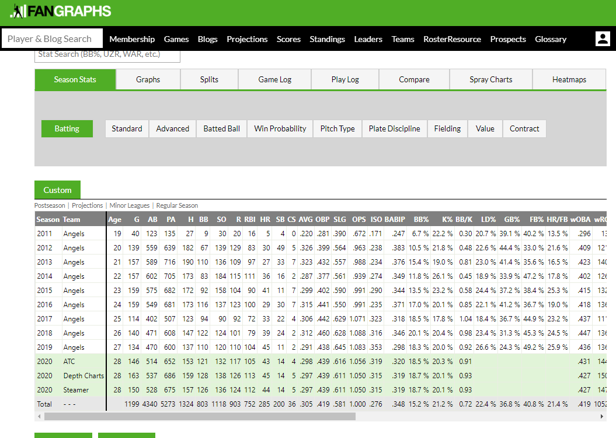
The ATC projections are also available on each individual player page on the site. You can see how it stacks up with other FanGraphs systems such as Steamer. Check out the snapshot of MLB superstar, Mike Trout.
Auction Calculator
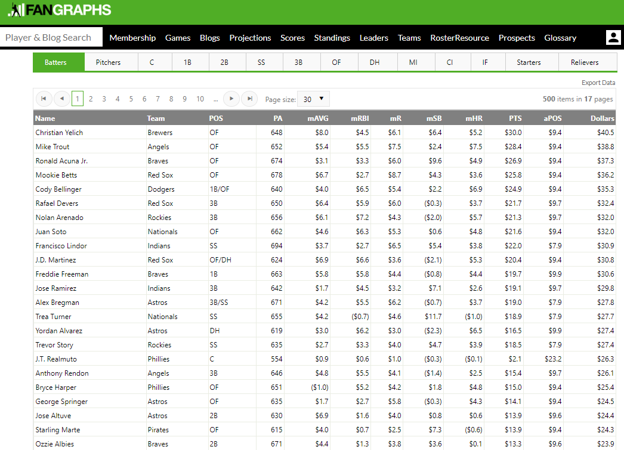
Finally, ATC is also available to use within the FanGraphs’ Auction Calculator. On the “Projection” dropdown, simply choose ATC. Enter in the details of your specific league’s roster settings, and the calculator will generate both rankings as well as auction dollars for all players.
Methodology
It has been a few years since the ATC projections introductory article, so here is a quick refresher…
The Average Total Cost projection system (ATC) gets its name from the fact that it “averages” many other projection systems together. ATC also happens to be my initials.
Though many others who attempt to aggregate projections typically apply equal weight to all data sources, ATC is much “smarter.” Weights within ATC are based on the careful study of historical performance of its underlying projection systems. That’s what makes ATC “smart.”
As I previously have stated – the methodology behind ATC is similar to what Nate Silver does with his presidential election forecasting at www.fivethirtyeight.com. Nate collects lots of polling data. He assigns credibility weights to each firm in order to know how to combine them.
Silver does this on a state by state level. Quinnipiac polling may equate to 25% of the weight for Rhode Island polls, and YouGov may only get a 5% share in RI. In Nevada, those weights might be totally different – perhaps YouGov has 15%, with Quinnipiac only receiving 3% of the total aggregation.
Similarly, ATC calculates different weights for each statistic. System A might receive 10% of the weight for RBI, but only 4% for SB. System B may receive 5% for RBI and 18% for SB, etc. The ATC system incorporates many freely available projections, plus prior MLB statistics over the past 3 seasons.
To be clear, when I talk about statistics – I model stats as a rate per playing time. Separately, I model each player’s playing time in the same smart aggregation manner, and then scale all of the rate stats accordingly.
By studying the strengths of multiple sources of data, in the end, one can create a model which is far more predictive than any one model by itself. Nate Silver does little or no polling of his own … yet his predictive model is the best in the industry. ATC operates in a similar manner, but for baseball. Although mostly automated, there are some manual edits made along the way – mostly for playing time projections. ATC is updated regularly all the way until opening day.
One important note. What is currently up on the site is the first cut of the ATC projections. Not all of the underlying systems that feed ATC are available at the moment, but they will be in the next couple of weeks. The first cut is still very highly credible, and good to use – it will just get slightly better as we approach spring training.
Accuracy
Last year, FantasyPros ranked ATC as the 2nd most accurate fantasy baseball projections. Only their own system came in as more accurate than ATC. In my own game theory projections comparison, of those surveyed – ATC ranked as the top projection system over the past two seasons. Both of those studies are worth a read!
–
What early findings have you discovered from ATC? Let us know in the comments below!
I want to wish all of you the best of luck in the upcoming 2020 fantasy baseball season!
Ariel is the 2019 FSWA Baseball Writer of the Year. Ariel is also the winner of the 2020 FSWA Baseball Article of the Year award. He is the creator of the ATC (Average Total Cost) Projection System. Ariel was ranked by FantasyPros as the #1 fantasy baseball expert in 2019. His ATC Projections were ranked as the #1 most accurate projection system over the past three years (2019-2021). Ariel also writes for CBS Sports, SportsLine, RotoBaller, and is the host of the Beat the Shift Podcast (@Beat_Shift_Pod). Ariel is a member of the inaugural Tout Wars Draft & Hold league, a member of the inaugural Mixed LABR Auction league and plays high stakes contests in the NFBC. Ariel is the 2020 Tout Wars Head to Head League Champion. Ariel Cohen is a fellow of the Casualty Actuarial Society (CAS) and the Society of Actuaries (SOA). He is a Vice President of Risk Management for a large international insurance and reinsurance company. Follow Ariel on Twitter at @ATCNY.
thank you Ariel! these are invaluable and now i will see about taking a few days off to spend with them. i also want to put a plug in for your excellent podcasts and i see you are speaking at the BHQ first Pitch Florida, which i am looking forward to as well. good luck this year!
Thank you very much! Really appreciate it!
If you haven’t heard the Great Fantasy Baseball Invitational Podcast yet, you should!
Looking forward!
Thanks for the explanation about the system, and these sound like an excellent resource.
Also, is there any way to compare the different projections that are available on Fangraphs, other than looking at individual player pages? I’d love to see, for example, which player has the greatest disparity between projections in, e.g., HRs or SBs. Perhaps a job for someone with greater spreadsheet skills than I have?
We don’t have that tool on FG. You would have to download both of them, and then do a matching in excel.
Unfortunately, to compare different data sets requires that you use the index/match function and the syntax can be hard to get down, but it’s an invaluable resource to learn. There really ought to be a way you can drop in two data sets and automatically match the name columns in Excel.
https://1drv.ms/x/s!Ar-Wg6xSYokQjn7R9wwrTNrpw_7w
Saw this earlier and had some free time today, so here you go. Hope this might be what you’re looking for.
The first two sheets are ATC and Steamer projections exported from FG. The third is where I got the differences between the two. Positive numbers indicate ATC projects higher than Steamer. I only included the stats relevant to fantasy baseball in this sheet. There’s two PA columns: one is the average between the two, the other is their difference. I did this so I can sort based on PA. Also included a fourth sheet that shows how these stats are different per PA. You’ll see the stat that varies the greatest is how they project PA, so the fourth sheet can tell you where ATC and Steamer differ in a player’s “true skill” in each stat.
I only have hitters in this spreadsheet, but included all the formulas for anyone who wants to do it themselves.
Great job with this!
This is excellent; thanks very much!
No problem! This was the first I’ve read anything on ATC’s methodology, and I feel like ATC is perfect for comparing other projections. I also think it would be better to run them through the auction calculator vs. just looking at the raw numbers. Probably going to get to that soon
Awesome! Enjoy the exploration!
Will Smith is not in the database
Yes, that is a known omission. Has to do with the player matching, it thinks it is Will Smith the pitcher.
I am told it will fix overnight. Same thing happened in the initial load last year.
Thank you for that note!
Thanks, Ariel! You are one of the best in the business. ATC has become indispensable to me.
Thank you very much Richard !!!
I really like what you do with ATC and can only imagine all the work that goes into it. I really like how you do playing time in the system. Thank you for putting it together.
Thank you very much! I appreciate it!
I wondered yesterday how many people were checking the site every day for ATC. I know I was. Thanks so much and good luck with your teams!
Thank you very much for checking them out! You can also follow me on twitter at @ATCNY where I gave everyone updates.
Also check out our podcast at @TGFBI, which goes through ATC.
Solid material and projections. I’ve read a lot of articles comparing the different projection systems. Obviously people can spin/interpret data in different ways. Would like to hear your thoughts on Mr. Cheatsheet’s projections since you both seem to use somewhat similar methodology when coming up with your numbers. Some sites claim his projections are at the top over the last couple years. Then the Fantasypros article claims they are the most accurate. Either way, ATC is always highly ranked. Would just like to hear your thoughts on this topic, specifically Mr. Cheatsheet.
How do you average the projections when so few are released at this time of year? Do you have back-channel info?
Thanks for the projections Ariel, they are always top notch. You mention that there are some additional projections you need to add to ATC that aren’t out yet. Do you have any time frame for when they will be released and added to ATC?
Thank you. These aren’t in my control at all, but assume 2-5 weeks very broadly.
Thank you so much for the ATC projections. It is a great tool. My fantasy league uses holds as part of one of the categories (ie. 2x Saves + Holds). I see ATC projections for holds on each individual player pages but Holds aren’t shown as a category on the Projections tab that shows all pitchers. Is there a way to see the projections for holds without going into each individual player’s page? Any help is appreciated.
Not currently on FanGraphs. Would have to talk to the big boys to request more to flow through.
Follow me on twitter at @ATCNY to get some updates on obtaining more of the stat categories in the meantime.
Hi Ariel, I first learned of ATC listening to a podcast you did with Patrick Davitt of Baseball HQ last season and was immediately intrigued. One question I have about ATC is regarding the $ values generated when using RotoGraph’s Auction Draft tool: I think I understand the category headings (assume ‘mRBI’ is median RBI $ value, etc.), but what exactly is ‘aPOS’ and ‘Dollars’? Assume aPOS is a positional value based on relative scarcity of a given position? But aPOS plus PTS (sum of all categories) does not equal ‘Dollars.’ It’s close enough to assume rounding is the culprit, but not sure. Any help deciphering any of this would be appreciated!
First, thanks for listening to Patrick’s show and for following ATC! I dont know exactly what the FG auction calculator does, but POS refers for the positional replacement level bump, and Dollars is the final auction value. Dollars is the sum of the rest (there is rounding error there). Hope this helps!