
Ranking Small Sample Pitchers

A couple of weeks ago, I examined four starting pitchers using a small sample of predictive data. It was a half-hearted comparison. I’m correcting that today with a simple FanGraphs download to spreadsheet comparison.
I decided on the stats to use based on work I did for The Process. Here is a look at what early-season stats are most predictive of rest-of-season stats (R-squared values).
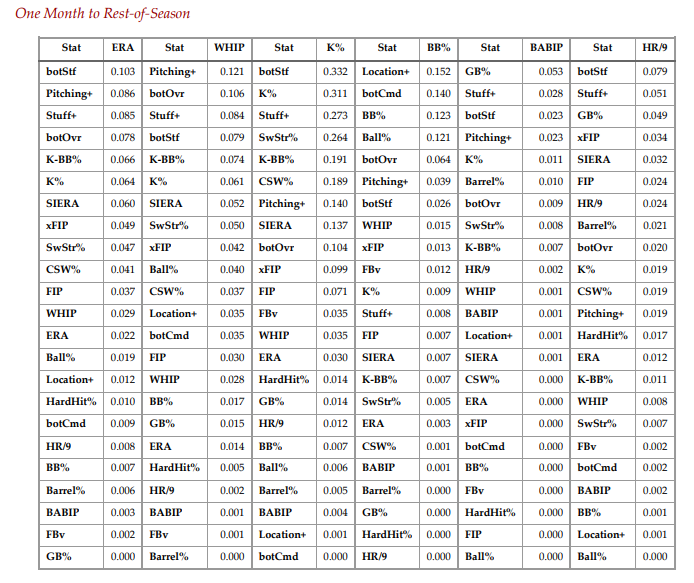
I used the two overall STUFH values (BotOverall, Pitching+) and the top two ERA estimators (SIERA, xFIP). Additionally, I wanted to weigh the stats that immediately stabilize (Ball%, SwStr%, Fastball velocity).
One major change, I put all the values on an ERA scale for easier comparison. Three values came in an ERA format, but the others need to be calculated. Here are the formulas I used (also in the provided spreadsheet).
- Pitching+ ERA: (Pitching+) * (-0.067) + 10.815
- SwStr%-Ball% ERA: (-19.4472)* SwStr% + 9.985324 * (Balls/Pitches) + 2.672178
- Fastball Velo (FBv) ERA: FBv * (-0.1416) + 17.339
Here is a link to the values along with the pitchers featured in this week’s waiver wire column. I limited the time frame to just the past two weeks. I use a method that makes the best decision with a small sample.
Not all the values are in the download, so I created a copyable spreadsheet (File, Create a Copy) to paste the pitchers’ stats (cell L4), and then the various ERA values are calculated along with an overall value. The average ERA can be ordered by using the promote option in cell J4.

In this instance, Brandon Walter stands out with everything looking great, except his 92 mph (4.32 ERA) fastball. He could bomb, but the goal is to make the best decision with little information.
One possible change is to adjust the weightings. I equally weighed the values. Someone can always give more weight to certain values (Pitching+) or just remove others (FBv). For me, the table allows for easy comparison of pitchers. If I were to evaluate each pitcher, I’d look at the above stats. This makes the analysis easier.
Two additions could be included: the first is to add a projection based on the preseason prospect rank (overall and team), the other one is to include the pitcher’s ERA projection (via xlookup).
Let me know if you have any questions on setting up the spreadsheet to help evaluate pitchers with a small MLB data sample.
Jeff, one of the authors of the fantasy baseball guide,The Process, writes for RotoGraphs, The Hardball Times, Rotowire, Baseball America, and BaseballHQ. He has been nominated for two SABR Analytics Research Award for Contemporary Analysis and won it in 2013 in tandem with Bill Petti. He has won four FSWA Awards including on for his Mining the News series. He's won Tout Wars three times, LABR twice, and got his first NFBC Main Event win in 2021. Follow him on Twitter @jeffwzimmerman.
Thanks for this! A few quick items:
I only did the last two weeks. The 5/20 start wasn’t included
Ah, thanks!
He limited it to the last two weeks, that first Walter start was back in May.
Walter caught my eye earlier this week and it’s always good to see someone smarter than me confirm my priors. I’ve also had my eye on Colton Gordon, Houston might have found a couple solid gems to replace their injured starters.
Can you put this behind a pay wall that my competitors can’t read for free? It’s too valuable to just give those clowns… Also, thanks and I’m gonna miss you next year.
I’m still a couple of years off from taking the sabbatical. My boy still has two years of high school left.
Great stuff as always, Jeff! Is the stuff+ based off the latest model? I know in the Process, it used last year’s model because Eno didn’t update it until well after publication.
No update, and most likely I’ll dump Stuff+ going forward because it keeps changing. The Bot metrics are just as useful, and the formula has never changed. Easier to comp to historical values.
Thanks for this. I was just wondering if I had the right small sample pitcher in Walter, now I won’t worry about that until he gets another couple starts. I was looking at Mick Abel who just got cut in my shallow mixer.
Walter is an enigmatic guy. He has thrown that 92 mph fourseamer only 7.5% of his pitches. It is seemingly always a surprise (so far), because he gets a 55%(!) whiff and .210 xSLG on it. His most-used pitch is an 88 mph cutter, which also yields the highest xSLG at .473. He throws his two best pitches, sweeper and changeup, about 46% of the time. The changeup is particularly devastating.
In short, a classic – and so far excellent – soft-tossing lefty who throws his fourseamer just enough to keep hitters from waiting for his changeup.
The Statcast numbers on the break of his sweeper, sinker, and changeup are eye-popping. He’s got a healthy chase rate and that kind of movement might explain why.
This is great stuff, thanks. Would you consider adjusting for opponent quality or park factors in the future? Would think that has the potential to have a large impact on such a small sample. Though some of these pitch-specific factors (FBv) and to a lesser degree BotERA and Pitching+ERA are insulated from park and opponent effects.
No, want it simple. Any mention of park factors gives me a headache.
This is great. Hopefully this helps shorten my morning routine of looking at numbers and endlessly debating if these guys are actually good.