Probabilistic Standings Simulations – Mixed Auction LABR
Introduction
Well, we are down to the final week of fantasy baseball. After a short 60 game season in 2020, we are blessed to be approaching game 162 here in 2021!
We here at RotoGraphs, are hoping that you are right in the thick of the competition for your league’s fantasy championship title. For me – I am right in the middle of an intense battle with one of the legends of rotisserie baseball, Ron Shandler, as well as our own Jeff Zimmerman.
The league that I am referring to is the Mixed Auction LABR league. I was one this division of LABR’s inaugural members back in 2020.

Above is a photograph of some of the participants of the live 2020 auction draft from Tampa, Florida. Due to COVID, this year’s draft was held online. LABR is one of the longest running (if not THE longest currently running) expert leagues of rotisserie baseball. It is an honor simply to be invited to compete.
The Mixed auction LABR league is a very standard 12-team 5×5 rotisserie league. We use the standard scoring categories (R, RBI, HR, SB, BA, W, K, SV, ERA, WHIP), and standard rosters (14 B, 9 P). Scoring periods are weekly, trading is allowed, and the initial draft is of the auction variety. Last year, I went into great detail recapping my draft – a two-part article that can be found here and here.
As many of you might already know, as a risk management actuary – my day job consists of running simulation models to recommend purchasing decisions to the upper management of my company. I simulate possible fires, hurricanes, medical malpractice claims, and other liabilities that we may be on the hook for.
Borrowing several actuarial methods, I adapted some of these models in order to develop a proprietary in-season fantasy baseball tool. It is a probabilistic final standings simulator. Using the current league accumulated standings, a source of projected ROS statistics, a volatility and a correlation model – I run 4000 iterations of what might happen for the remainder of the season.
Analyzing these 4k sims allows me to generate associated probabilities for winning the league, finishing in 2nd place, etc. The model also directs me to the categories that need the most attention, so that I can maximize in-season waiver wire pickups. It can also assist with finding possible trades.
In today’s article, rather than diving into the math behind the probabilistic simulation tool’s methodology – I will introduce the reader to many of the resulting output charts and graphs. Plus, in using the Mixed Auction LABR league as the example, it will provide us with an update on my chances for winning this prestigious expert league in 2021.
Current Standings
Below are the league standings as of the morning of September 27, 2021:

At the start of game play this week, I am currently trailing Ron Shandler for the league lead by 2.5 points. Jeff Zimmerman trails by 5.5 points.
Simulated Standings
For today’s probabilistic simulation, I use the following rest of season projections:
- Derek Carty’s THE BAT X for hitters
- Derek Carty’s THE BAT for most pitching statistics
- Jared Cross’s Steamer for projected saves
For each of the 4000 iterations of model, the accumulated statistics to date are combined with a randomly generated possible final week of the 2021 season. For some simulations, a team may generate a large number of homers. Sometimes few round-trippers emerge. On average, the accumulated stats for week 27 will match the input projections.
I have summarized the resulting final outcomes in the table below. The first two columns add projected statistics without accounting for process variance of the simulation. The rest of the table includes it.

Here is where variance makes all of the difference. If every team exactly generated its projected/expected results, Ron Shandler would be in line to win the league by a single point.
However, when considering that some teams have good weeks while others had bad ones – despite my current 2nd place standing – the model indicates that I have a 59% chance to win the league. I am actually the favorite! Unfortunately, Jeff stands to only have about a 2% chance (1 in 59 to be more exact) of winning LABR.
Below is the full listing of the LABR fantasy teams with their probabilities of final place standing:
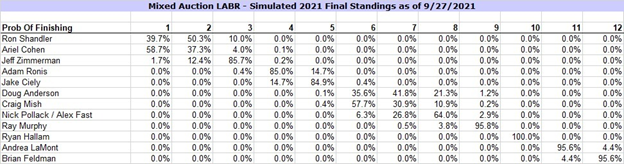
You can see above that the top 3 teams are essentially locked into the top 3 slots. Ryan Hallam will assuredly finish in 10th place. A number of teams in the middle can either rise or drop some 3 spots in the standings.
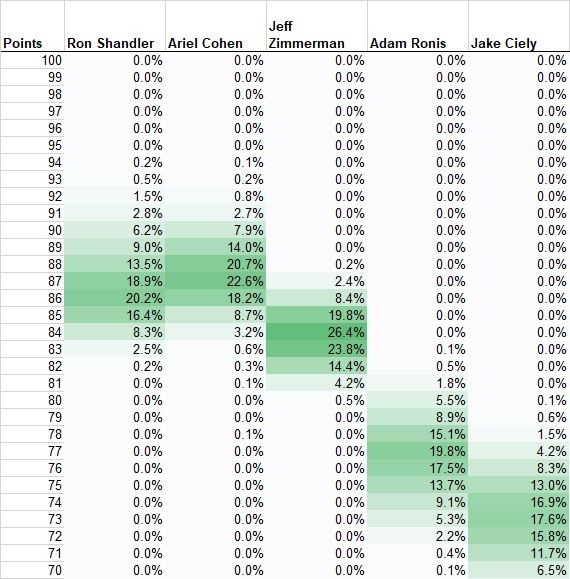
Next is the resulting point density chart for the top five teams in the league. It gives the probabilities that each team will finish with a specific number of fantasy points. Ron Shandler has about a 40% chance of ending up between 86-87 points, while I have about the same chance to achieve a score of 87-88. In one terrible simulation for me, I fall all the way to 78 points, but on the upside – I can possibly reach 94.
Finally, let’s take a closer look at the categories at risk for each of the top 3 teams:

For Ron, there is a large gradient in stolen bases. Ron could potentially lose as many as 3 points in the category. However, in ERA – Ron can potentially gain 4 points in the final week. He is point-locked into a number of categories – including RBI, W and SV.
Jeff’s best chance of gaining point lies in saves and ERA. That may explain the fact that he had been activating 6 relievers in each of the past few weeks.
My largest concerns are the runs and batting average categories. I can quite easily lose two points in runs. There is a wide range of outcomes for BA. As HRs & RBIs are already settled (near 0% chance to move), this influenced my decision to start Isaiah Kiner-Falefa for the final two weeks over the more valuable Kyle Seager. With the opportunity to gain two points in wins, I decided to activate nine starting pitchers, leaving all of my excellent closers (Edwin Diaz and Emmanuel Clase) on the bench for the ultimate week.
As a side note – notice that the ratio categories are some of the most volatile ones above. While most fantasy players believe that counting stat categories are easier to gain ground upon [late in the season], it isn’t true. I would argue that ratio categories most often are the ones with larger point gradients.
Conclusion
Most if not all of your final lineup decisions in rotisserie leagues will be made with regard to the categories. You at home are undoubtedly doing a very similar analysis for each of your roto squads, without applying exact probabilities to it.
Today’s probabilistic simulation was meant to reinforce this concept. Look carefully at your rosters and risk-assess the potential categorical tradeoffs in your lineup decisions. This will be the most effective way to secure your fantasy titles – both this year, and in years to come.
In addition, I desire feedback from you. Which charts/graphs would you find most helpful on a regular basis? What other types of applications in fantasy would this analysis be of assistance to you? Your comments and suggestions are deeply helpful.
Best of luck in the final week of 2021!
Ariel is the 2019 FSWA Baseball Writer of the Year. Ariel is also the winner of the 2020 FSWA Baseball Article of the Year award. He is the creator of the ATC (Average Total Cost) Projection System. Ariel was ranked by FantasyPros as the #1 fantasy baseball expert in 2019. His ATC Projections were ranked as the #1 most accurate projection system over the past three years (2019-2021). Ariel also writes for CBS Sports, SportsLine, RotoBaller, and is the host of the Beat the Shift Podcast (@Beat_Shift_Pod). Ariel is a member of the inaugural Tout Wars Draft & Hold league, a member of the inaugural Mixed LABR Auction league and plays high stakes contests in the NFBC. Ariel is the 2020 Tout Wars Head to Head League Champion. Ariel Cohen is a fellow of the Casualty Actuarial Society (CAS) and the Society of Actuaries (SOA). He is a Vice President of Risk Management for a large international insurance and reinsurance company. Follow Ariel on Twitter at @ATCNY.
Is this applied only on a week-to-week basis? Or do you have a different model that would incorporate multi-week projections? Multi-week projections would assuredly be more difficult in order to count for savvy waiver acquisitions, etc.
This can be applied at any point in the season. It is meant to be a season-long projection, though.
Ariel – this is really interesting work. I wonder if an off-season article or Podcast could be devoted to the types of software required to do these types of simulations. Is this something that an advanced excel user can learn to do or does it require 3rd party specialized software that you have access to as an actuary?
You could do it in RStudio, and that’s open source, but it’s a pain in the ass if you aren’t used to it. SPSS is a lot like Excel and could definitely do it (and maybe Excel could too), but it is insanely expensive. If you have access to college resources (via a library or what have you) that has classes in business statistics, social science grad work, etc., it is likely that you can get some sort of free access.
Oh wait, wish I could delete. Ignore that, I was thinking of other things
Thanks!
At some point I’ll get more into the actual math behind it. But no, it can be run with excel.
Are you able to elaborate on the “volatility and a correlation model”? To me, that seems to be the most significant part.
That was well beyond the scope of the article.
But in a nutshell, the “volatility” model takes care of the distribution of simulations about the mean. Its more complicated – but for KIS sake – for sim x, you randomly simulate how many SDs above/below the mean you are, then apply the distribution.
As for the correlation model – If your team has a high number of HRs, you are going to have a high # or RBIs. There is a correlation. The question is how to rig the sims so that there is randomness, but yet categories are correctly correlated.
Hope this at least gives you an idea of what’s involved ….
I’m happy to see you writing about this. I’ve been running my own version of this for about 5 years but haven’t found anyone else doing it. It’s a really valuable tool, especially for trade evaluation and season-long planning in keeper leagues (where if you know you have a solid chance to win you can push in, but if you’re out of it better to sell off).
The volatility and correlation model is really where the bread is buttered in this kind of thing, so I’m curious if we came to the same answer on how to build it.
Yes, to me this is the real way to evaluate lineup decisions and trade possibilities. Probabilistically.
I have my methods. Actuarial based. 🙂
This is going to be really impactful work to share. Thank you. I think the probabilistic forecast of team performance is really a frontier in fantasy baseball.
A couple of ways I’ve found this useful, which you’re probably already doing:
1. Finding dollar values of transactions. By summing the probabilities times the payout at each place, you can get a dollar value for each transaction. If you’re only goal is to win this isn’t useful (just look at % in first), but for simplicity I like looking at a single dollar value rather than the array of probabilities at each place. Plus I find the $ value less noisy, so it needs fewer realizations to reach decision making significance.
2. Independently verify your player ranking spreadsheet. By adding and removing players from your team in the model, you can see their $ value impact and check if it aligns with your SGP values.
3. In season updates of your SGP values. You can perturb your expected accumulated stats by your SGP value of that category and see if your preseason expectations are still true. More usefully, you can back calculate from your model your “in-season” SGPs that are specific to your team at that time in that league. This takes the guess-work out of how much to value each category as you over or underperform during the season and you can apply it in your rankings spreadsheet to value all players without having to run each player through the model.
My background is signal processing and physics, so it’ll be interesting how well that overlaps with the actuarial approach.
Yes, I’ve done some of this stuff. Probabilitsitc changes are really the way to go, and there’s a new branch a valuation waiting to be quantified here.
I’m going to introduce things as I go !