Jake Mailhot’s 2026 Tiered Rankings for Ottoneu Points: Catcher
With the two largest position groups out of the way, the Ottoneu rankings push takes a breather with the smallest position group to finish this week. You can find all the information about the format and methodology for these rankings in Chad’s introduction.
Changelog
- 2/13/2026: Updated projections w/ ZiPS and OOPSY. Added player notes for all players in tier $1-$2 and above. Updated tier placement for eight players (green = moved up, red = moved down).
- 3/18/2026: Updated tier placement for four players based on 2026 draft results.
Jake Mailhot’s Ottoneu Tiered Rankings for Points Leagues: C | 1B | MI | 3B | OF | SP | RP
Chad Young’s Ottoneu Tiered Rankings for Points Leagues: C | 1B | MI | 3B |OF | SP | RP
Chad Young’s Ottoneu Tiered Rankings for 4×4: C | 1B | MI | 3B | OF | SP | RP
Here are few more notes about my process:
- Projected points. I’ve been building my own homebrewed projections for the past decade plus, ever since I started playing Ottoneu, and they form the basis for the rankings below. They’re nothing overly complicated; essentially just a MARCEL-esque projection using three years of historical data filtered through a rough aging curve and adjusted for the current run environment. I also include a collection of up to five public projection systems (ZiPS, Steamer, OOPSY, THE BAT, and PECOTA) to provide some additional context. That gives each player a wealth of data sources to form their projection. Currently, the projections below only include Steamer and THE BAT projections. I will update the rankings in February once ZiPS, OOPSY, and PECOTA are released.
- P/G vs P/PA. Points per game played is the gold standard by which you should be evaluating players in Ottoneu. I won’t argue with that. That measure does have some drawbacks, particularly for players who pinch hit, pinch run, or are used as defensive substitutions often. Those limited appearances can skew a player’s P/G lower than what they’re producing when they’re getting three or four plate appearances when they start a game. To provide a little more context for these kinds of players, I’m projecting players using points per plate appearance. That measure should give us a better idea of how a player produces no matter how he’s used by his team.
Just to reiterate a point that Chad makes in his introduction: yes, these rankings are presented ordinally, but the tier a player appears in is much more important than if they’re ranked 16th or 28th. Within tiers, players are generally ranked by their projected Pts/PA but that doesn’t necessarily mean I think one player is significantly more valuable than another in the same tier. I’ve got notes on the top 20-ish players below and I’ll add more notes when I update the rankings next month. Let’s get into it.
| Tier | Rank | Player | Position | Projected Pts | Pts/PA | Notes |
|---|---|---|---|---|---|---|
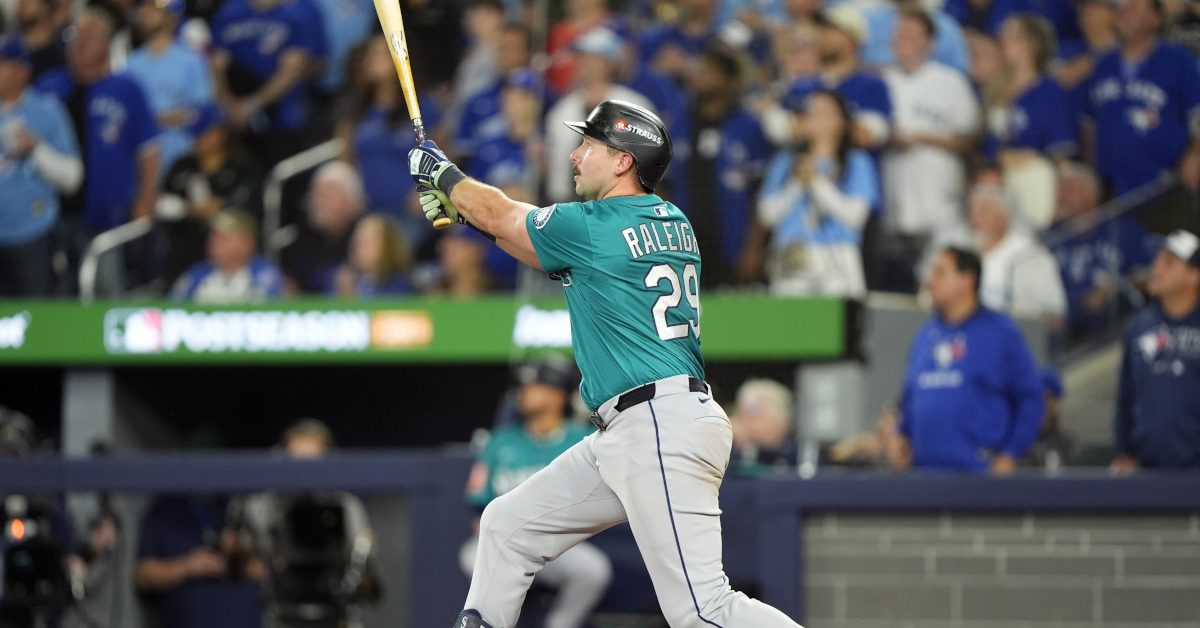
| $28-$35 | 1 | Cal Raleigh | C | 919.6 | 1.43 | Probably won’t hit 60 home runs again but is clearly the best catcher in baseball. Huge power supported by real plate discipline gains in 2025. |
| $15-$20 | 2 | Will Smith | C | 636.4 | 1.32 | 2025 was his best offensive season since ’20 but it might have been BABIP driven. He did have career-high walk rate and contact quality looked a lot like it did back in ’20. |
| $15-$20 | 3 | Ben Rice | C/1B | 644.7 | 1.31 | Huge breakout in 2025. Should get regular at-bats as 1B in New York, but will probably loose C eligibility in 2027. |
| $15-$20 | 4 | Hunter Goodman | C | 678.6 | 1.31 | This tier is full of breakout catchers! I like his foundation a little less than the other players in this tier — poor plate approach gives him a low floor. |
| $15-$20 | 5 | Shea Langeliers | C | 678.0 | 1.31 | Another huge breakout in 2025. Cut strikeout rate by 7.5 points and absolutely mashed in 2H (176 wRC+). |
| $15-$20 | 6 | Iván Herrera | C | 612.7 | 1.31 | Another huge breakout in 2025. Should get regular at-bats as DH in St. Louis and could retain C eligibility for 2027. |
| $15-$20 | 7 | William Contreras | C | 802.3 | 1.27 | Played through a fractured finger in 2025 and his power output dropped. Should bounce back if healthy. |
| $10-$14 | 8 | Drake Baldwin | C | 602.6 | 1.27 | Very impressive debut in 2025 that earned him ROY honors. Good plate approach and solid contact quality give him a high floor. |
| $6-$9 | 9 | Gabriel Moreno | C | 446.1 | 1.19 | Has dealt with a number of injuries over the last few years, but has been productive when healthy. |
| $6-$9 | 10 | Samuel Basallo | C/1B | 462.0 | 1.18 | Struggled a bit in his brief call up in 2025 but is still just 21. Position is a question mark but should force his way into the lineup. |
| $6-$9 | 11 | Alejandro Kirk | C | 543.4 | 1.18 | High contact approach might be a little BABIP dependent, but improved contact quality significantly in 2025. |
| $6-$9 | 12 | Francisco Alvarez | C | 451.3 | 1.18 | Dramatically improved contact quality after returning from midseason demotion but hand injuries derailed his progress. |
| $6-$9 | 13 | Salvador Perez | C/1B | 695.4 | 1.14 | The home runs are nice, but that’s about it. He gets regular at-bats whether its at C, 1B, or DH. |
| $6-$9 | 14 | Adley Rutschman | C | 613.7 | 1.13 | He’s been below replacement level for a season and a half now but the promise of a huge bounce back is still present. |
| $6-$9 | 15 | Yainer Diaz | C | 611.7 | 1.13 | Two straight years of declining production. Aggressive approach means he’s BABIP dependent and power has slid backwards. |
| $6-$9 | 16 | Carter Jensen | C | 472.0 | 1.10 | Really impressive late season debut in 2025. Playing time in question, but should take over full-time catching duties soon. |
| $6-$9 | 17 | Agustín Ramírez | C | 593.6 | 1.09 | Another young catcher whose debut season in 2025 was a little rocky. Projections think he’ll take a step forward. |
| $3-$5 | 18 | Ryan Jeffers | C | 525.3 | 1.14 | Power disappeared in 2025 but plate discipline improved. |
| $3-$5 | 19 | Tyler Stephenson | C | 475.1 | 1.11 | Big improvement in contact quality but strikeout rate jumped over 30%. |
| $1-$2 | 20 | Kyle Teel | C | 456.6 | 1.09 | Solid debut season in 2025. Will likely fall back to earth a bit when his BABIP regresses, but solid skills to build on. |
| $1-$2 | 21 | Austin Wells | C | 465.2 | 1.08 | Should be a good source of power but plate discipline took a big step backwards in 2025. |
| $1-$2 | 22 | J.T. Realmuto | C | 522.0 | 1.08 | He’s back in Philadelphia but 2025 was his worst season since his rookie year in 2015. How much longer can he catch 100+ games? |
| $1-$2 | 23 | Dillon Dingler | C | 443.8 | 1.08 | Pretty significant breakout in his first full season in the big leagues. Good contact quality but might be a little too dependent on BABIP. |
| $1-$2 | 24 | Dalton Rushing | C | 271.2 | 1.08 | Playing time blocked behind Will Smith, but could force his way into at-bats in the outfield mix or as backup catcher. |
| $1-$2 | 25 | Moisés Ballesteros | C | 451.7 | 1.07 | Top prospect should get plenty of time as DH in 2026. Promising late season debut, but contact quality is a little lacking. |
| $1-$2 | 26 | Victor Caratini | C/1B | 362.0 | 1.06 | Should see plenty of playing time as DH and backup catcher. Decent underlying skills and improved strikeout rate by 2.5 points in 2025. |
| $0-$1 | 27 | Josue Briceño | C | N/A | N/A | |
| $0-$1 | 28 | Sean Murphy | C | 373.5 | 1.09 | |
| $0-$1 | 29 | Gary Sánchez | C | 274.8 | 1.08 | |
| $0-$1 | 30 | Carson Kelly | C | 387.1 | 1.07 | |
| $0-$1 | 31 | Danny Jansen | C | 336.4 | 1.03 | |
| $0-$1 | 32 | Joey Bart | C | 323.4 | 1.03 | |
| $0-$1 | 33 | Luis Campusano | C | 351.6 | 1.02 | |
| $0-$1 | 34 | Carlos Narváez | C | 417.8 | 1.01 | |
| $0-$1 | 35 | Kyle Higashioka | C | 273.6 | 0.99 | |
| $0-$1 | 36 | Edgar Quero | C | 415.2 | 0.98 | |
| $0-$1 | 37 | Logan O’Hoppe | C | 434.4 | 0.98 | |
| $0-$1 | 38 | Harry Ford | C | 363.1 | 0.97 | |
| $0-$1 | 39 | Bo Naylor | C | 398.6 | 0.97 | |
| $0 | 40 | Ethan Salas | C | N/A | N/A | |
| $0 | 41 | Connor Wong | C | 324.4 | 0.99 | |
| $0 | 42 | Liam Hicks | C/1B | 329.3 | 0.99 | |
| $0 | 43 | Miguel Amaya | C | 254.1 | 0.96 | |
| $0 | 44 | Endy Rodriguez | C/1B | 247.8 | 0.95 | |
| $0 | 45 | Travis d’Arnaud | C | 238.1 | 0.93 | |
| $0 | 46 | James McCann | C | 186.3 | 0.93 | |
| $0 | 47 | Mitch Garver | C | 282.4 | 0.92 | |
| $0 | 48 | Hunter Feduccia | C | 250.8 | 0.90 | |
| $0 | 49 | Freddy Fermin | C | 335.3 | 0.89 | |
| $0 | 50 | Jake Rogers | C | 217.4 | 0.88 | |
| $0 | 51 | Keibert Ruiz | C | 328.5 | 0.86 | |
| $0 | 52 | Elias Díaz | C | 263.2 | 0.86 | |
| $0 | 53 | Pedro Pagés | C | 290.0 | 0.86 | |
| $0 | 54 | Rafael Marchán | C | 118.7 | 0.85 | |
| $0 | 55 | Reese McGuire | C | 153.5 | 0.85 | |
| $0 | 56 | Jose Trevino | C | 214.6 | 0.82 | |
| $0 | 57 | Patrick Bailey | C | 362.5 | 0.82 | |
| $0 | 58 | Henry Davis | C | 225.5 | 0.81 | |
| $0 | 59 | Jonah Heim | C | 326.7 | 0.81 | |
| $0 | 60 | Jacob Stallings | C | 161.9 | 0.80 | |
| $0 | 61 | Nick Fortes | C | 222.2 | 0.78 | |
| $0 | 62 | Korey Lee | C | 231.0 | 0.75 | |
| $0 | 63 | Ben Rortvedt | C | 158.8 | 0.70 | |
| $0 | 64 | Christian Vázquez | C | 171.6 | 0.69 |
Jake Mailhot is a contributor to FanGraphs. A long-suffering Mariners fan, he also writes about them for Lookout Landing. Follow him on BlueSky @jakemailhot.
Thank you for the support on the format (especially the comments), hugely important for my upcoming redraft!