Explaining Todd Frazier’s Home Run Outburst

Over the last couple of weeks, I have talked a lot about a hitter’s batted ball distance and the additional components included in my xHR/FB rate formula. The cool thing about learning about these metrics is now it’s a bit easier to understand what drove a particular hitter’s power surge or what led to a decline in home run output. As I am in the middle of my hitter projections, I have stumbled upon players with some interesting trends.
One such player is Todd Frazier, who breached the 20 homer plateau for the first time, exceeding his previous career high by 10 long balls and just missing 30. His HR/FB rate declined a bit from 2012 to 2013, but then surged in 2014 to 17.0%. That mark was good for 16th highest in baseball among qualified batters.
Now with average absolute angle and standard deviation of distance data in hand, we have a more complete explanation than simply “he hit the ball further”. Let’s start with his distance trend since 2012, in graphical form of course:
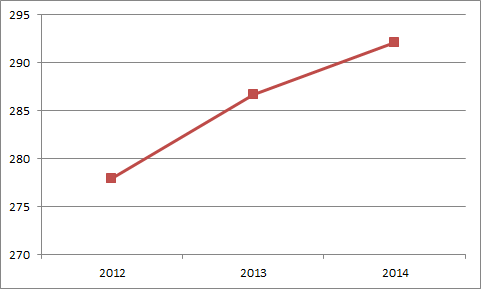
Frazier’s average fly ball and home run distance has increased in a beautiful straight line. And of course, greater distance equals a higher HR/FB rate, all else being equal. So this is a good start to hitting for more home run power.
Now let’s check out his average absolute angle trend:

Would you look at that, another upward sloping line. Frazier began his first two seasons posting angle marks below the league average, but has gradually pushed it up closer to average. It still remains below, though, so hitting it down the lines even more would help him maintain his most recent HR/FB rate.
Lastly, we move to the standard deviation of distance (SDD) trend:

Unlike the other two metrics, Frazier’s SDD trend isn’t a perfect ascending line. In 2013, it dipped slightly, before jumping in 2014. The average SDD ranges between 55 and 60, so Frazier has always had the ability to hit long shots in between his routine flies. But he took that skill to a new level this year.
So folks, this is the precise recipe that yields a delicious HR/FB rate spike. Hit the ball further, more toward the lines and mix in longer bombs with your routine flies and a home run eruption is in your future.
I always like to see a distance jump behind a HR/FB rate increase since distance shows the highest year-to-year correlation. Of course, Frazier posted gains in all three metrics, but it does provide optimism that he’ll remain closer to his 2014 level in 2015 than in previous years. It’s why I am projecting a 15% HR/FB rate, which is just above his career average.
Mike Podhorzer is the 2015 Fantasy Sports Writers Association Baseball Writer of the Year and three-time Tout Wars champion. He is the author of the eBook Projecting X 2.0: How to Forecast Baseball Player Performance, which teaches you how to project players yourself. Follow Mike on X@MikePodhorzer and contact him via email.
I like it. 15 seems reasonable considering all the info you laid out. Really cool to see the 3 year trend of all the data. I knew his HR/FB distance had grown over 3 years, but didn’t know that the abs angle and SDD also went way up last year. I went with 16% HR/FB myself, but I tend to buy into real changes maybe to a fault. We will see.