During the All-Star break, I polled you fine readers about starting pitchers and your expectations in the second half. Specifically, the poll pitted the 10 greatest SIERA overperformers against the 10 most significant underperformers. I asked you which group would post a lower second half ERA and which range each group’s ERA would fall into. Let’s now review what happened.
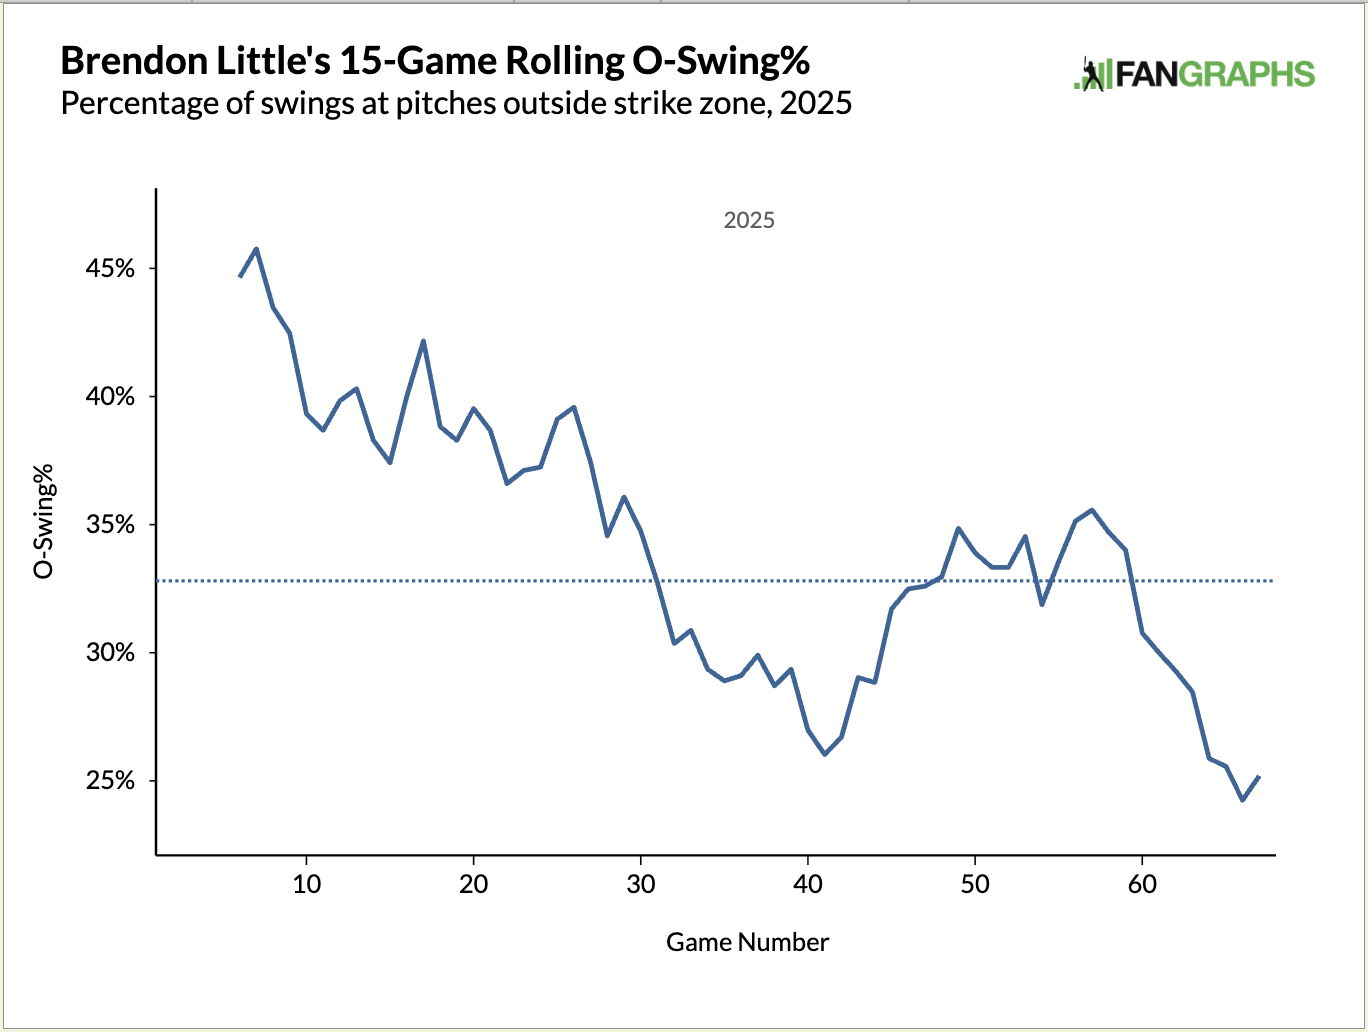
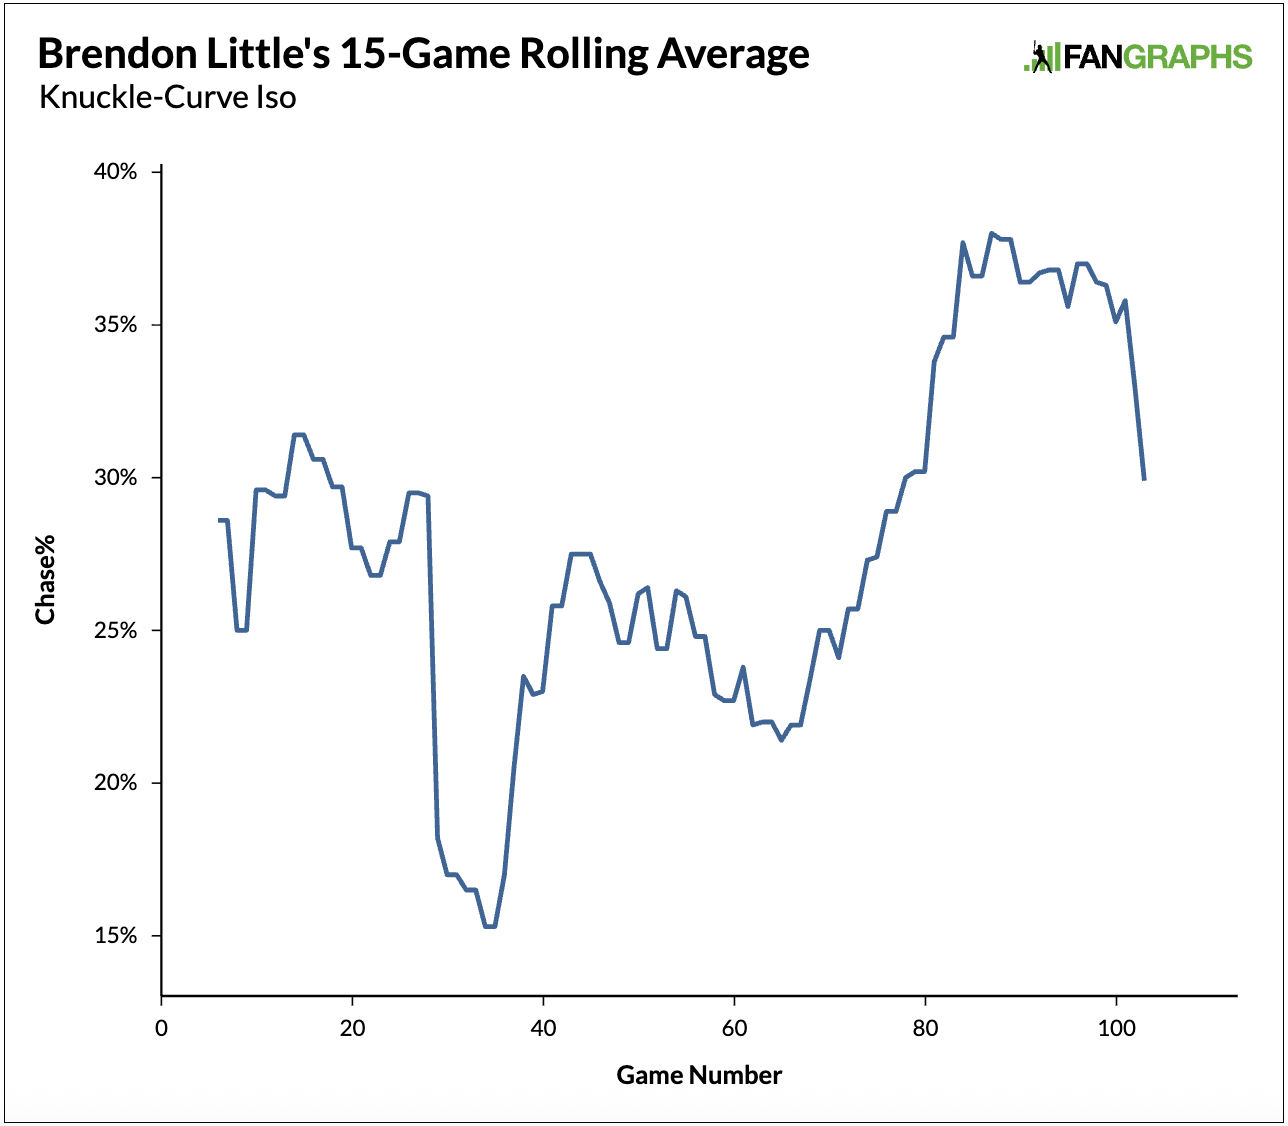
In early June, Alex Chamberlain graced us with a FanGraphs article about Brendon Little and a new concept called, “Implied Miss Distance”. Chamberlain, along with Baseball Prospectus writer/researcher Stephen Sutton-Brown, have done some great work utilizing Statcast bat tracking data, giving readers a new perspective on something like a swing and miss. But, back in early July, nearly a month after Chamberlain wrote about Little’s amazing knuckle-curve and it’s ability to make hitters whiff so hard that the outfield flag flutters, hitters stopped chasing the pitch. They were tired of looking silly and would no longer budge, allowing us to imply nothing:
If it wasn’t for Chamberlain’s article, I wouldn’t have known about Little or his knuckle-curve. But that’s why FanGraphs is the best, and when I recently watched the Blue Jays and their relievers’ deteriorating August WHIP, I heard the broadcasters mention Little’s falling O-Swing, or chase, rate.
If you only focused on Little’s knuckle-curve and the damage hitters have done to it in each month of the season, as you see in the table below, you wouldn’t think twice about the pitch’s performance:
Little’s Knuckle Curve by Month 2025
Month
KC
Total Pitches
KC%
wOBA
Mar/Apr
96
218
44.0%
.194
May
111
229
48.5%
.176
Jun
119
243
49.0%
.212
Jul
103
193
53.4%
.192
Aug
76
193
39.4%
.146
Sep/Oct
51
119
42.9%
.257
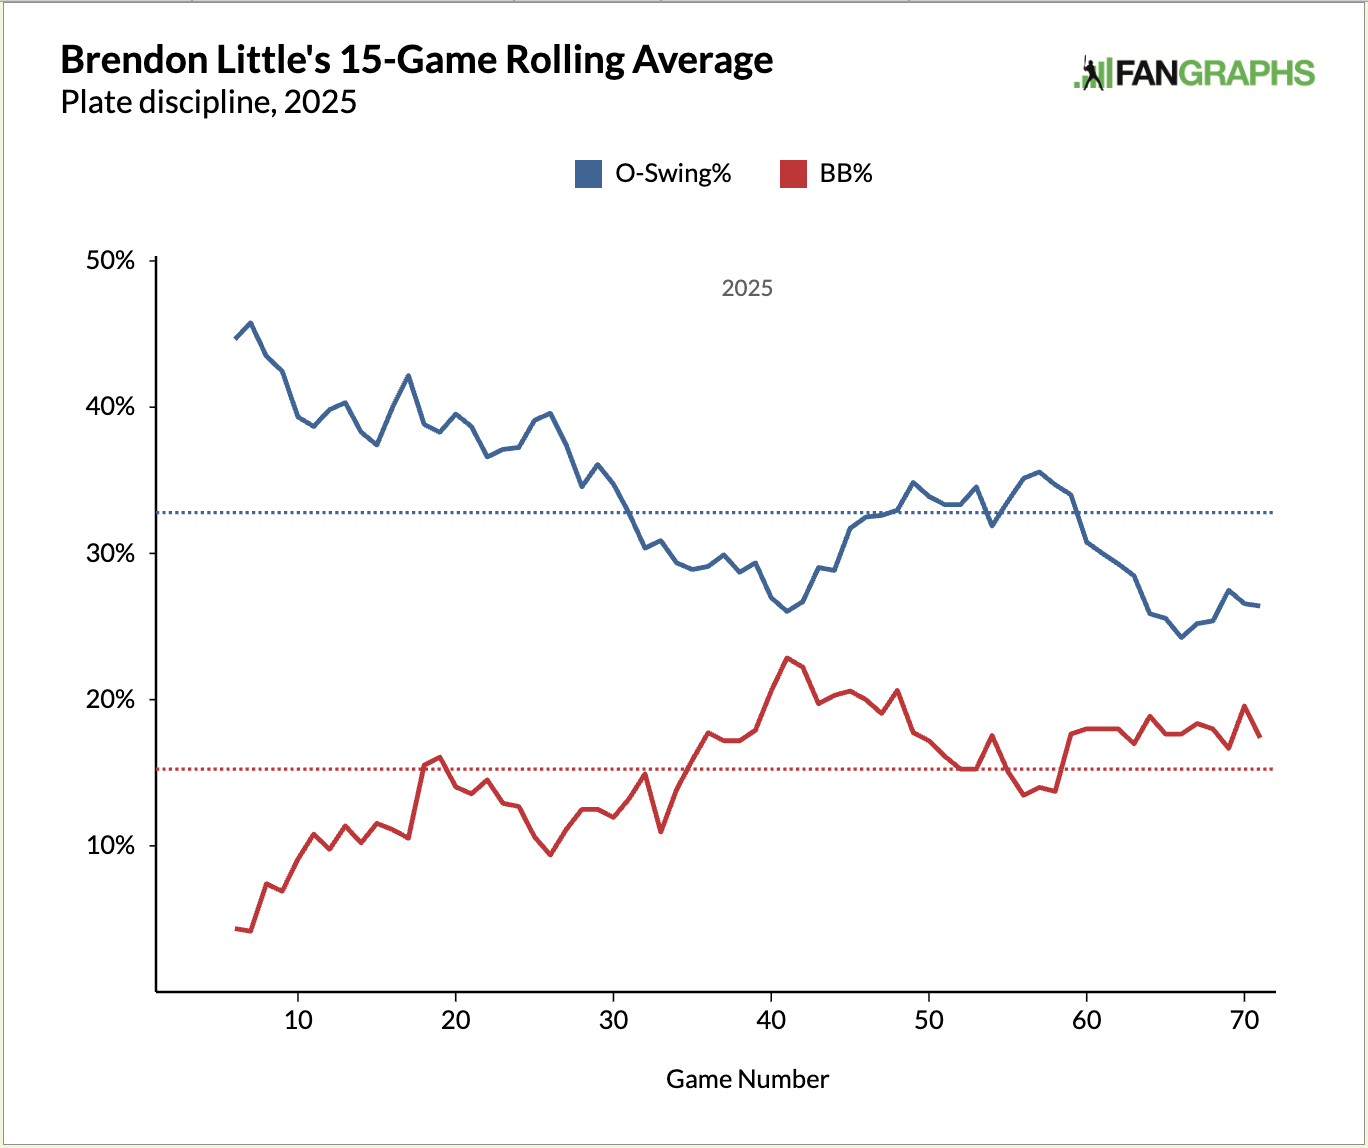
Among pitchers who have thrown at least 100 knuckle curves in any of the last five seasons, Little’s 2025 wOBA of .188 is a fringe top 20 (25th) out of nearly 200 pitchers. Last season, Little got even closer to the top 20 mark (23rd) with a .186 wOBA on the pitch. But the broadcast never said anything about Little getting hit; they were focused on the lack of chase and, therefore, an increased BB%:
The chart above includes all of Little’s pitches. By isolating the O-Swing% to only his knuckle-curve, we can see that this overall drop in hitters’ chasing after Little’s offerings wasn’t solely because of them spitting at that specific pitch:
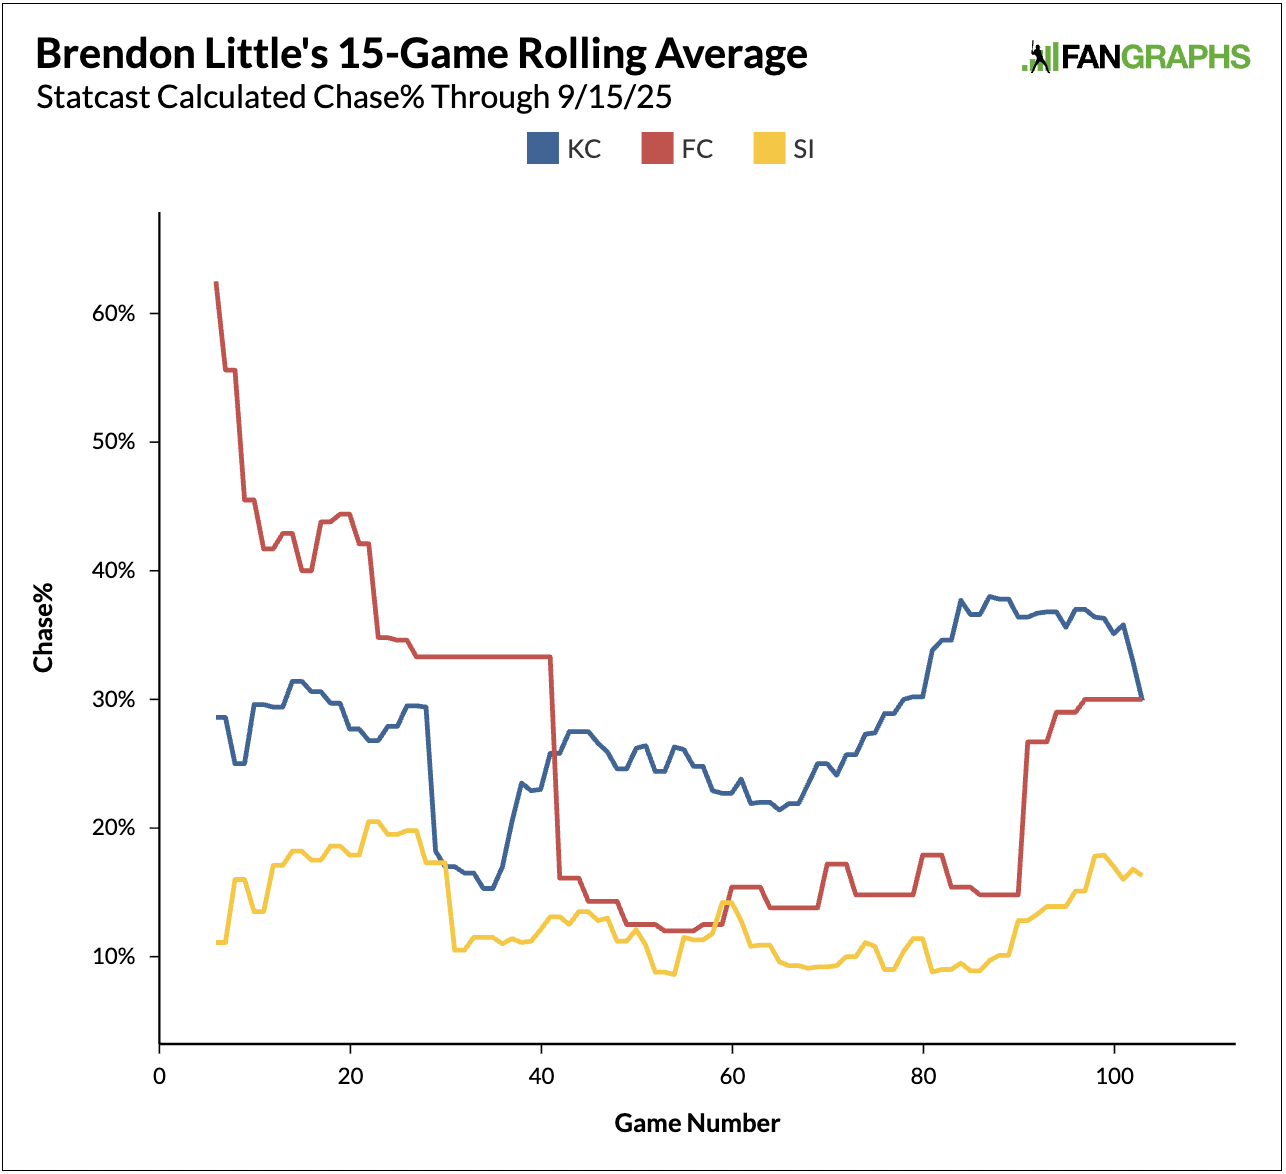
Thanks to the incredible addition of the Pitch-Type Split Leaderboard by the FanGraphs web team, we can now view the averages of individual pitches with ease. In 2025, among all pitchers who have thrown at least 10 knuckle curves, the league average O-Swing% currently sits at 35.5%. Little’s mark on the season is 36.5%. Rolling averages are different from season averages, and when Little’s chase rate rolling average dipped, so did the chase rolling average of his two other pitches:
Chart 4 – Rolling KC, FC, SI Chase% Comps
The straight red line indicates times when Little stopped throwing his cutter. It’s interesting to see how the line stopped running horizontally around the same time his knuckle-curve was at its worst. Unfortunately, it didn’t fill the chased pitch gap, and that 40-50 game mark fell around early to mid-July when Little’s WHIP went upwards:
Brendon Little’s Monthly Splits (All Pitches)
Month
KC%
WHIP
K-BB%
Mar/Apr
44.3
1.31
26.8
May
48.5
0.98
17.3
Jun
49.0
1.42
15.7
Jul
53.4
1.60
21.3
Aug
39.4
1.65
0.0
Sep/Oct
42.9
1.65
10.0
Hitters weren’t getting boosted wOBA’s from Little’s lack of chase, but the 1.65 WHIP (5.97 eqiuv. ERA) meant they were hitting his other pitches and walking more. I’ve been rambling on about Little for more than a few paragraphs now, and you’re probably waiting for the point. The point? The point is, pitchers need to adjust when a pitch that used to be chased no longer gets chased. They know that. We know that. Yet, it’s difficult to keep track of on the fan side of things. Pitchers will go about adjusting in all sorts of ways.
In Little’s case, it was really just a blip. If you go back up to the graph showing individual pitch chase rates, you may notice that Little’s usage of the cutter, even if it wasn’t chased, allowed the chase rate on his knuckle-curve to jump back up. Hitters did a great job of laying off Little’s knuckle-curve from around games 30 to 70, but excellence is when a pitcher can adjust in the moment to hitters. That’s robotic. So, let’s!…get!…robotic! For the remainder of this article, I’ll present a detection system that can run daily to capture when a pitcher’s most used fastball and most used secondary are in good or bad rhythm using individual pitch plate discipline metrics. Here’s an example from Little’s 40 to 80 game span:
The table is just a summary of what you see in Chart 4 above, but it’s designed to be placed in an automated system. If chase is up on one pitch and called strike is up on another, that’s good. If both pitches are falling to generate either chase or called strikes, well, that’s bad. Categorizing the balance between his sinker’s called strike rate and his knuckle-curve’s chase rate is as simple as creating rule-based logic:
Using the pitcher’s median values allows the categorization to detect improvements by each individual. I’m using “smart” medians to call the league median if a player has a zero value. That happens when they haven’t generated any chase or called strikes. If we use Brendon Little’s game logs to isolate his performance during those game periods from the table above, we see some pattern in a very small sample:
Brendon Little’s Overall Performance in Small Samples
Game Number
WHIP
K-BB%
41-50
0.91
32.3%
51-60
2.10
0.0%
61-73
1.33
15.4%
Little was at his best when he was in decent balance. This is the type of tracking that could be useful when streaming pitchers or looking for hot relievers. To test this out on a grander scale, I built a dataset that includes data from the last two months. This keeps the sample limited to more recent performance. Furthermore, I limited the data to only pitchers with more than 60 total pitches thrown in that time. Then, I took each pitcher’s most utilized fastball by pitch percentage and used it to calculate their called strike rate. I did the same with each pitcher’s most utilized offspeed, or non-fastball, pitch and used it to calculate their chase rate. I then calculated each pitch’s 15-game rolling rate, called strike for fastballs and chase for non-fastballs, and labelled their performance balance. Finally, I counted the number of days in which a player has been either good (balanced) or bad (unbalanced) and found the current status of players in both groups:
The results focus on a pitcher’s most recent stretch. For example, Emilio Pagán has had one of his best K-BB% (22.4%) marks of his career this season, and in his last five games, it’s been even better (26.3%). He’s had recent success thanks to his four-seam and splitter working in unison.
Is there more to do? Always. I’ve only compared fastball called strike rates with offspeed chase rates, but all of these plate discipline metrics could be compared for balance. For example, it may be better to have a balanced swinging strike rate and chase rate. But, fundamental to this analysis is the assumption that it’s hard to get anywhere without a fastball and offspeed pitch that work well together. Does it mean anything? Is the balance even predictive of future success? Maybe, maybe not. What it certainly can do, as I believe I’ve exemplified here, is explain a pitcher’s success or lack thereof. If you are interested in doing this analysis on your own without spending hours calling and pinging pybaseball’s API, you can view pitch-specific plate discipline metrics on our new and totally awesome Pitch-Type Splits Leaderboards. Stay balanced, stay cool.
The search for pitching help is never ending. Between injuries and ineffectiveness, fantasy players are always on the lookout for pitchers who are performing well who can provide some reinforcements. The final week of the season is upon us. Hitting your innings pitched cap in Ottoneu leagues is one of the most important ways you can maximize your roster to its fullest extent. And because it’s a soft cap, you can stack as many starters as you can on the day you’ll hit the cap, and you’ll receive all the points from those pitchers.
If you’re planning ahead, you might want to think about adding one or two of the following under-rostered pitchers for their start during the final weekend of the season if you can line everything up correctly. Here are 12 starters who are rostered in less than 60% of all Ottoneu leagues who have a good matchup this weekend.
Atlanta might have one of the easiest matchups this weekend as they host the punchless Pirates. Joey Wentz has been serviceable while eating up innings on Atlanta’s injury depleted pitching staff. He isn’t pitching deep into games but over his last two starts, he’s run a 4.0 strikeout-to-walk ratio with 12 Ks in nine innings.
Now that Payton Tolle has been shifted to the bullpen for the remainder of the season, Kyle Harrison has taken his place in the starting rotation. He looked excellent in his first start with Boston on Saturday, pitching six innings of one-run ball against the Rays while striking out five. His scheduled start this weekend comes against a struggling and desperate Tigers ballclub.
The Cardinals have posted a .289 wOBA over the last 14 days, 22nd in baseball. They’re pretty punchless with both Willson Contreras and Masyn Winn sidelined for the rest of the season. Colin Rea and Jameson Taillon have had their ups and downs this year but the matchup looks good enough to think about streaming them for their final starts of the season.
Like the rest of the Guardians pitching staff, Slade Cecconi has been excellent over the last few weeks. He’s allowed just two runs in 20.2 innings across his previous three starts with a 3.0 strikeout-to-walk ratio. Cleveland will be fighting for a chance to sneak into the playoffs this weekend and the Rangers offense hasn’t been very good in September.
The Giants-Rockies series in San Francisco this weekend looks like it’s ripe for plenty of pitching points. Neither team has been very good offensively and the ballpark is a haven for pitchers. For Colorado, Kyle Freeland is probably the one starter worth looking at unless you want to risk starting Germán Márquez. For San Francisco, the options are two rookies in Kai-Wei Teng and Trevor McDonald. Neither has an impressive track record, but the matchup might be too juicy to pass up.
AJ Blubaugh has bounced between the rotation and the bullpen for the Astros down the stretch but he’ll likely get an opportunity to start against the Angels this weekend. He hasn’t allowed a run since a four inning bulk relief appearance back on August 23, a stretch of 17 scoreless innings. During this scoreless streak, he’s posted a very impressive 7.5 strikeout-to-walk ratio and has allowed just five hits.
Chad Patrick was a critical piece of the Brewers starting rotation earlier this year while they dealt with numerous injuries on their pitching staff. Once the team got healthy, Patrick was relegated to the minor leagues, but the injury bug has struck again and he’s now back with the team providing solid innings out of the rotation and the bullpen. Since being recalled in mid-August, he’s provided a 3.72 FIP in 21 innings while posting a very good 3.4 strikeout-to-walk ratio.
Walker Buehler’s season has been a disaster but he’s at least looked serviceable with the Phillies since joining the club in September. You’ve really got to trust that Philadelphia identified and fixed whatever issues were plaguing him in Boston. At least the matchup against the Twins doesn’t look too bad.
Mike Burrows has been a frequent recommendation in this column this year. After some struggles in July and early August, he’s been absolutely fantastic down the stretch. Across his last six outings — two four starts and two bulk relief outings — he’s posted a 1.60 FIP and allowed five runs in 21.1 innings. His strikeout-to-walk ratio during this stretch has been an absolutely fantastic 6.0. He’s been piggybacked with another one of Pittsburgh’s young pitchers in each of his last three starts so he’s not getting very deep into games, but the high quality of his innings means he’s racking up the points in September.
Welcome to the final Ottoneu Starting Pitching Planner of the season. Based on the Roster Resource Probables Grid, I’ve organized every starter slated to start next week into four categories: start, maybe, risky, and sit. The first and last category are pretty self-explanatory. Starters who fall into the “maybe” category are guys you could start if you need to keep up with the innings pitched pace in points leagues or need to hit your games started cap in head-to-head leagues; they’re good bets to turn in a decent start, but you shouldn’t automatically insert them into your lineup. If you’ve fallen behind on the innings pitched pace or you’re really starving for starts in a head-to-head matchup, you could turn to a “risky” starter or two.
I’ve also calculated a “Matchup Score” for each series using a straight combination of opponent’s home/away wOBA, opponent wOBA over the last 14 days, and the park factor for the ballpark the teams are playing in. It’s indexed so that 100 is average and anything above that is a favorable matchup and anything below is unfavorable. That matchup rating informs some of the sit/start recommendations I’m making, though the quality of the pitcher definitely takes precedence. I should also note that I’ve updated the way I’m calculating the park factors for the two new minor league stadiums that the Athletics and Rays are playing in this year; I’m taking the one-year park factors from Statcast and regressing them towards neutral, with the one-year factors increasing in weight as more games are played in those stadiums (those series are still marked in yellow below).
Welcome back to the Ottoneu Starting Pitching Planner. Based on the Roster Resource Probables Grid, I’ve organized every starter slated to start next week into four categories: start, maybe, risky, and sit. The first and last category are pretty self-explanatory. Starters who fall into the “maybe” category are guys you could start if you need to keep up with the innings pitched pace in points leagues or need to hit your games started cap in head-to-head leagues; they’re good bets to turn in a decent start, but you shouldn’t automatically insert them into your lineup. If you’ve fallen behind on the innings pitched pace or you’re really starving for starts in a head-to-head matchup, you could turn to a “risky” starter or two.
I’ve also calculated a “Matchup Score” for each series using a straight combination of opponent’s home/away wOBA, opponent wOBA over the last 14 days, and the park factor for the ballpark the teams are playing in. It’s indexed so that 100 is average and anything above that is a favorable matchup and anything below is unfavorable. That matchup rating informs some of the sit/start recommendations I’m making, though the quality of the pitcher definitely takes precedence. I should also note that I’ve updated the way I’m calculating the park factors for the two new minor league stadiums that the Athletics and Rays are playing in this year; I’m taking the one-year park factors from Statcast and regressing them towards neutral, with the one-year factors increasing in weight as more games are played in those stadiums (those series are still marked in yellow below).
With the season nearly complete, this article takes a final look at OOPSY’s projections-based top 60 prospects in an effort to give readers a jump start on the offseason.
Happy Friday, and welcome to the first Pitcher Playing Time Changes rundown of September! As always, there’s a lot to go over, with the injury hits continuing to come and teams like the Mets making significant rotation changes.
Change in Projected % of Team’s Remaining GS, 8/29 to 9/5
Welcome back to the Ottoneu Starting Pitching Planner. Based on the Roster Resource Probables Grid, I’ve organized every starter slated to start next week into four categories: start, maybe, risky, and sit. The first and last category are pretty self-explanatory. Starters who fall into the “maybe” category are guys you could start if you need to keep up with the innings pitched pace in points leagues or need to hit your games started cap in head-to-head leagues; they’re good bets to turn in a decent start, but you shouldn’t automatically insert them into your lineup. If you’ve fallen behind on the innings pitched pace or you’re really starving for starts in a head-to-head matchup, you could turn to a “risky” starter or two.
I’ve also calculated a “Matchup Score” for each series using a straight combination of opponent’s home/away wOBA, opponent wOBA over the last 14 days, and the park factor for the ballpark the teams are playing in. It’s indexed so that 100 is average and anything above that is a favorable matchup and anything below is unfavorable. That matchup rating informs some of the sit/start recommendations I’m making, though the quality of the pitcher definitely takes precedence. I should also note that I’ve updated the way I’m calculating the park factors for the two new minor league stadiums that the Athletics and Rays are playing in this year; I’m taking the one-year park factors from Statcast and regressing them towards neutral, with the one-year factors increasing in weight as more games are played in those stadiums (those series are still marked in yellow below).
Happy Friday, and welcome to the last Pitcher Playing Time Changes of August! We’re running out of time on the regular season, which means a lot of pitchers are running out of time to return from injuries. Others, however, like Chris Sale, will come back and at least get the consolation prize of ending the year healthy and having pitched in MLB games.
Change in Projected % of Team’s Remaining GS, 8/22 to 8/29