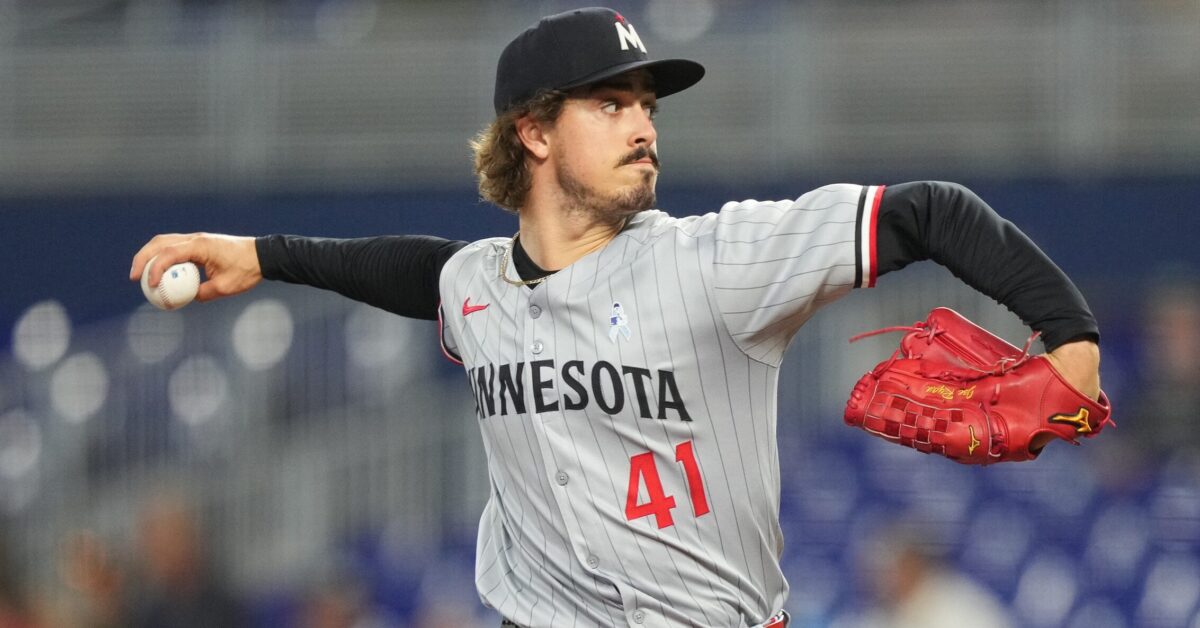
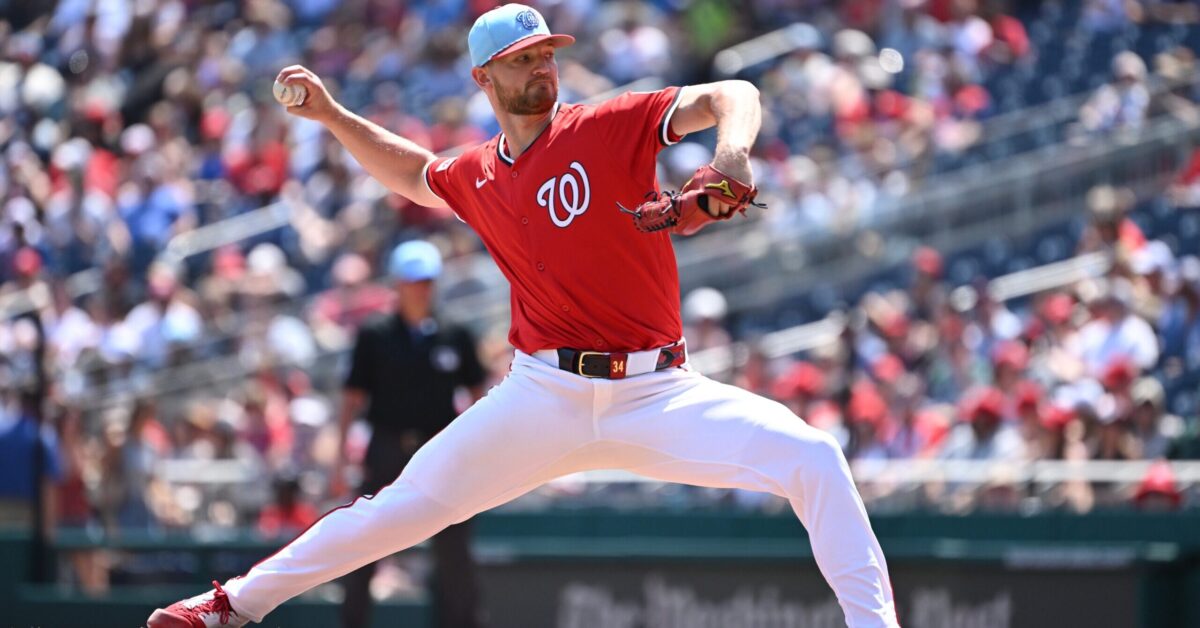
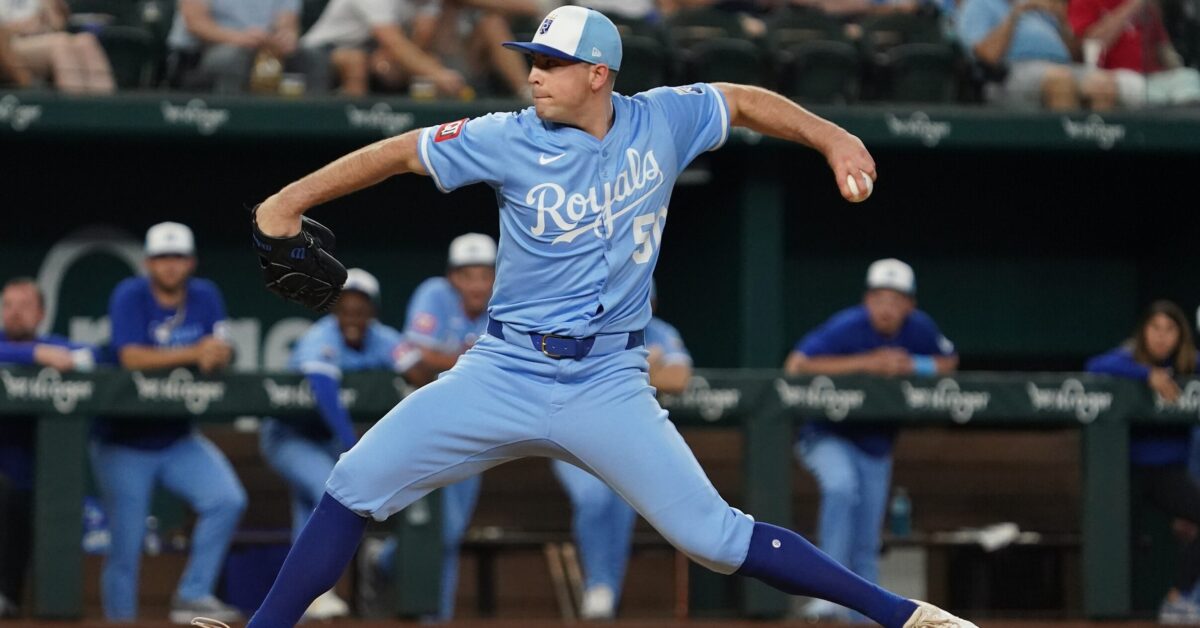
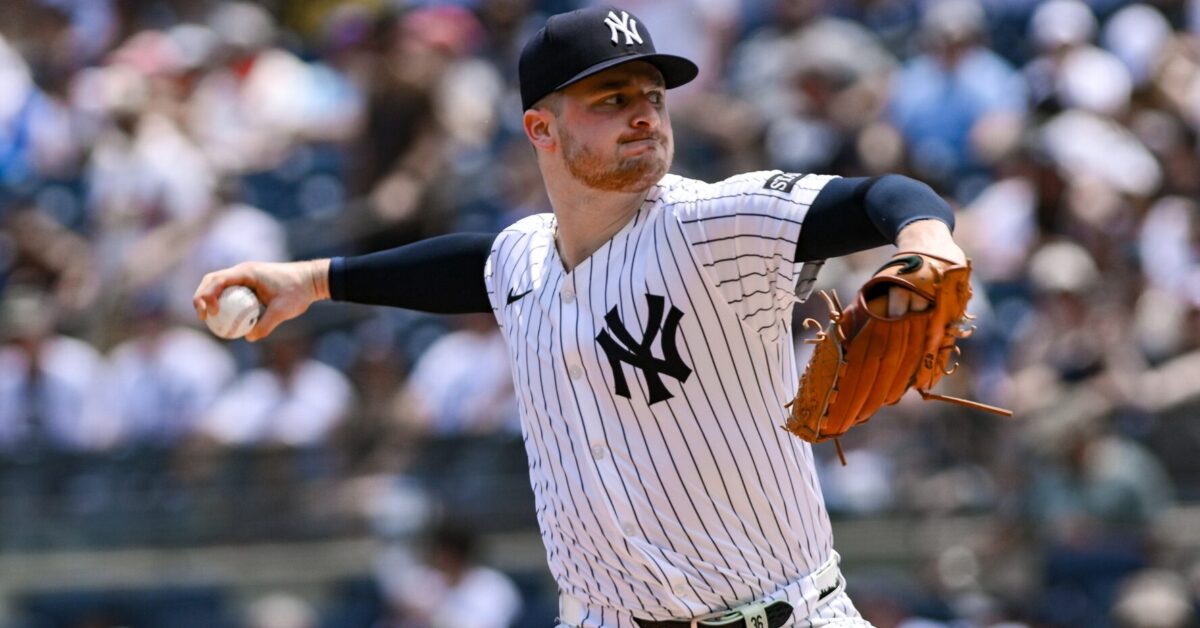
Starting Pitcher Chart – July 18th, 2025
Daily SP Chart archive
The chart includes their performance for 2025, their opponent’s wOBA rank versus the pitcher’s handedness from this year so far, my general start/sit recommendation for 10-team, 12-team, and 15-team (or more) leagues, and then a note about them. Obviously, there are league sizes beyond those three so it’s essentially a shallow, medium, deep. If a pitcher only has an “x” in 15-team, it doesn’t mean there’s no potential use in 10s and 12s, but it’s a much riskier stream for those spots.
These are general recommendations, and your league situation will carry more weight whether you are protecting ratios or chasing counting numbers. This is for standard 5×5 roto leagues. The thresholds for H2H starts are generally lower, especially in points leagues so I thought there would be more valuable focusing on roto.
Here’s a preview of my SP rankings with the Top 75. I’ll have a separate post with the Top 150 sometime Friday.
| PITCHER | TM | IP | ERA | WHIP | K-BB | PITCH+ | |
|---|---|---|---|---|---|---|---|
| 1 | Tarik Skubal | DET | 121 | 2.23 | 0.83 | 30% | 121 |
| 2 | Paul Skenes | PIT | 121 | 2.01 | 0.93 | 22% | 117 |
| 3 | Zack Wheeler | PHI | 122 | 2.36 | 0.86 | 27% | 121 |
| 4 | Garrett Crochet | BOS | 129.1 | 2.23 | 1.04 | 25% | 110 |
| 5 | Hunter Brown | HOU | 115 | 2.43 | 0.96 | 23% | 107 |
| 6 | Yoshinobu Yamamoto | LAD | 104.1 | 2.59 | 1.04 | 19% | 107 |
| 7 | Jacob deGrom | TEX | 112.1 | 2.32 | 0.91 | 21% | 121 |
| 8 | Max Fried | NYY | 122 | 2.43 | 1.01 | 18% | 114 |
| 9 | Carlos Rodón | NYY | 119.2 | 3.08 | 1.00 | 20% | 101 |
| 10 | Spencer Strider | ATL | 61.2 | 3.94 | 1.17 | 20% | 92 |
| 11 | Logan Gilbert | SEA | 61 | 3.39 | 1.05 | 29% | 111 |
| 12 | Joe Ryan | MIN | 109.1 | 2.72 | 0.91 | 23% | 105 |
| 13 | Bryan Woo | SEA | 114.2 | 2.75 | 0.93 | 20% | 111 |
| 14 | George Kirby | SEA | 54 | 4.50 | 1.15 | 20% | 108 |
| 15 | Framber Valdez | HOU | 121 | 2.75 | 1.12 | 17% | 112 |
| 16 | Logan Webb | SFG | 125.2 | 2.94 | 1.17 | 22% | 113 |
| 17 | Robbie Ray | SFG | 119 | 2.65 | 1.08 | 18% | 93 |
| 18 | Freddy Peralta | MIL | 111.2 | 2.66 | 1.06 | 18% | 105 |
| 19 | Nick Pivetta | SDP | 109.1 | 2.88 | 1.02 | 21% | 108 |
| 20 | Cristopher Sánchez | PHI | 115 | 2.50 | 1.14 | 19% | 114 |
| 21 | Tyler Glasnow | LAD | 23 | 3.52 | 1.22 | 14% | 90 |
| 22 | Nathan Eovaldi | TEX | 91 | 1.58 | 0.85 | 23% | 105 |
| 23 | MacKenzie Gore | WAS | 110.1 | 3.02 | 1.20 | 23% | 102 |
| 24 | Sonny Gray | STL | 108 | 3.50 | 1.08 | 23% | 101 |
| 25 | Jacob Misiorowski | MIL | 25.2 | 2.81 | 0.90 | 22% | 128 |
| 26 | Dylan Cease | SDP | 103.1 | 4.88 | 1.33 | 20% | 108 |
| 27 | Kris Bubic | KCR | 108.2 | 2.48 | 1.16 | 18% | 102 |
| 28 | Kodai Senga | NYM | 77.2 | 1.39 | 1.13 | 13% | 95 |
| 29 | Shota Imanaga | CHC | 68 | 2.65 | 0.93 | 12% | 105 |
| 30 | Ranger Suárez | PHI | 83.2 | 2.15 | 1.06 | 17% | 106 |
| 31 | Matthew Boyd | CHC | 111.2 | 2.34 | 1.03 | 18% | 99 |
| 32 | Nick Lodolo | CIN | 106.2 | 3.38 | 1.11 | 17% | 99 |
| 33 | Ryan Pepiot | TBR | 114.1 | 3.38 | 1.15 | 16% | 109 |
| 34 | Seth Lugo | KCR | 101 | 2.67 | 1.08 | 14% | 91 |
| 35 | Jesús Luzardo | PHI | 104.1 | 4.14 | 1.41 | 19% | 108 |
| 36 | Chase Burns | CIN | 16 | 6.19 | 1.63 | 22% | 118 |
| 37 | Merrill Kelly 켈리 | ARI | 116 | 3.34 | 1.05 | 17% | 97 |
| 38 | Casey Mize | DET | 88.2 | 3.15 | 1.22 | 15% | 103 |
| 39 | Jack Flaherty | DET | 100.2 | 4.65 | 1.24 | 20% | 99 |
| 40 | Reese Olson | DET | 58 | 2.95 | 1.24 | 14% | 97 |
| 41 | Eury Pérez | MIA | 34 | 3.18 | 0.91 | 18% | 107 |
| 42 | Brandon Woodruff | MIL | 10.1 | 2.61 | 0.68 | 47% | 111 |
| 43 | Drew Rasmussen | TBR | 91.1 | 2.86 | 1.03 | 15% | 109 |
| 44 | Trevor Rogers | BAL | 35.1 | 1.53 | 0.82 | 16% | 96 |
| 45 | Andrew Abbott | CIN | 91.1 | 2.07 | 1.08 | 16% | 96 |
| 46 | Will Warren | NYY | 95.1 | 4.63 | 1.42 | 16% | 103 |
| 47 | Noah Cameron | KCR | 70 | 2.31 | 1.00 | 13% | 100 |
| 48 | Michael Soroka | WAS | 67.1 | 5.35 | 1.16 | 19% | 93 |
| 49 | Luis Castillo | SEA | 108.1 | 3.41 | 1.24 | 13% | 102 |
| 50 | Shane Baz | TBR | 110 | 4.17 | 1.25 | 15% | 108 |
| 51 | Ryne Nelson | ARI | 78.1 | 3.68 | 1.07 | 13% | 106 |
| 52 | Lucas Giolito | BOS | 72.1 | 3.36 | 1.23 | 15% | 94 |
| 53 | Yusei Kikuchi | LAA | 113 | 3.11 | 1.37 | 14% | 103 |
| 54 | Kevin Gausman | TOR | 109.2 | 4.19 | 1.16 | 16% | 104 |
| 55 | Sean Manaea | NYM | 3.1 | 2.70 | 1.50 | 47% | 124 |
| 56 | Jacob Lopez | ATH | 55.2 | 4.20 | 1.33 | 19% | 91 |
| 57 | Cam Schlittler | NYY | 5.1 | 5.06 | 1.13 | 24% | 100 |
| 58 | Grant Holmes | ATL | 105 | 3.77 | 1.30 | 16% | 94 |
| 59 | José Berríos | TOR | 115.1 | 3.75 | 1.24 | 12% | 93 |
| 60 | Mitch Keller | PIT | 119 | 3.48 | 1.14 | 13% | 97 |
| 61 | Matthew Liberatore | STL | 100.1 | 4.13 | 1.25 | 14% | 98 |
| 62 | Chris Bassitt | TOR | 107 | 4.12 | 1.35 | 16% | 99 |
| 63 | Brandon Walter | HOU | 40.2 | 3.98 | 1.01 | 23% | 100 |
| 64 | Zack Littell | TBR | 116.1 | 3.56 | 1.08 | 14% | 94 |
| 65 | David Peterson | NYM | 109 | 3.06 | 1.24 | 12% | 95 |
| 66 | Clayton Kershaw | LAD | 50.2 | 3.38 | 1.24 | 10% | 94 |
| 67 | Edward Cabrera | MIA | 82.1 | 3.61 | 1.26 | 16% | 107 |
| 68 | Tanner Bibee | CLE | 109 | 4.29 | 1.24 | 14% | 100 |
| 69 | Yu Darvish | SDP | 8.1 | 6.48 | 1.68 | 3% | 82 |
| 70 | Clay Holmes | NYM | 103.1 | 3.31 | 1.26 | 10% | 103 |
| 71 | Gavin Williams | CLE | 97.1 | 3.70 | 1.43 | 9% | 94 |
| 72 | Joe Boyle | TBR | 14 | 1.29 | 0.71 | 19% | 89 |
| 73 | Janson Junk | MIA | 50.1 | 2.68 | 0.99 | 17% | 110 |
| 74 | Richard Fitts | BOS | 33.2 | 4.28 | 1.22 | 13% | 104 |
| 75 | Michael Wacha | KCR | 106 | 3.74 | 1.27 | 11% | 100 |

