Pitcher Playing Time Changes: June 6, 2025
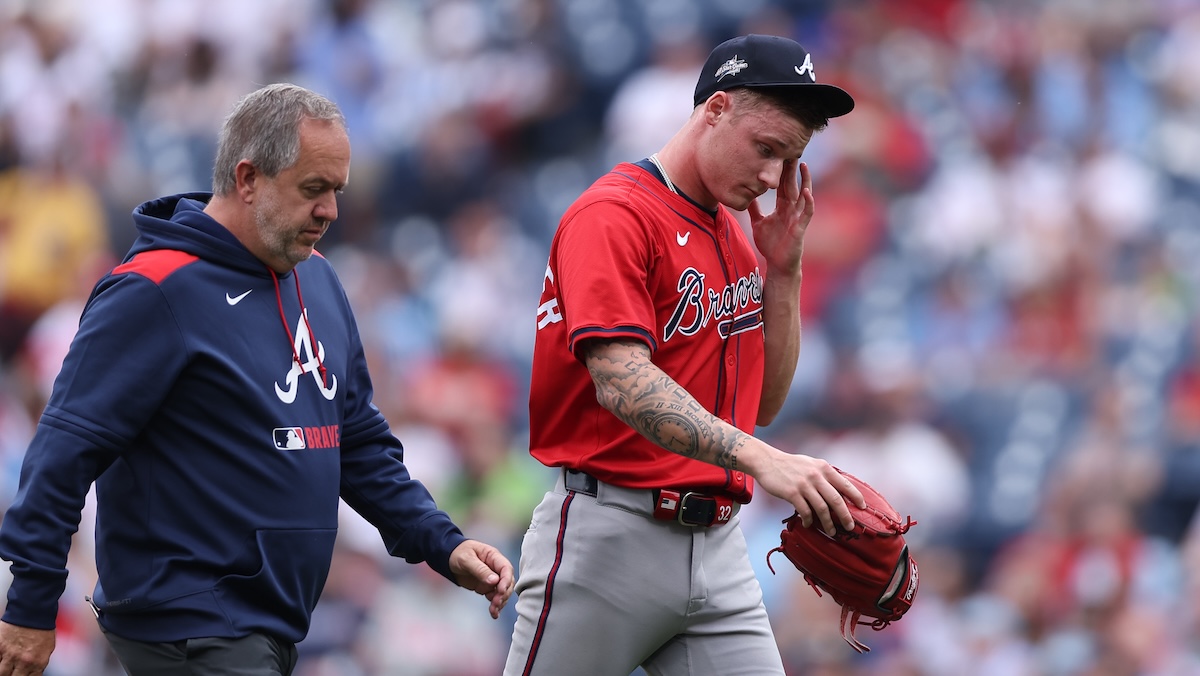
Below are the latest playing time changes for pitchers in the past week, highlighted by AJ Smith-Shawver’s season-ending injury that increases the importance of Grant Holmes and Bryce Elder in Atlanta’s rotation.
SP % of Team GS Changes Since May 30
| Name | Team | Old % of Remaining GS | New % of Remaining GS | PT Change | Reason |
|---|---|---|---|---|---|
| Bryce Elder | ATL | 9% | 16% | 7% | Smith-Shawver injury |
| Michael Lorenzen | KCR | 15% | 10% | -5% | Noah Cameron emergence |
| Corbin Burnes | ARI | 18% | 12% | -6% | Elbow inflammation, expect this number to go down more |
| Pablo López | MIN | 19% | 9% | -10% | Teres major strain |
| AJ Smith-Shawver | ATL | 15% | 0% | -15% | Tommy John surgery |
Projected RP IP Changes Since May 30
| Name | Team | % Chg in RP IP | Reason |
|---|---|---|---|
| Michael Kelly | ATH | 331% | Return from gambling suspension, on MLB roster |
| Andrew Saalfrank | ARI | 171% | Return from gambling suspension, in AAA |
| Erik Sabrowski | CLE | 86% | Nearing end of injury rehab |
| Valente Bellozo | MIA | 83% | Pitching well as a long man |
| Edgardo Henriquez | MIA | 75% | Continues to shoot up the depth chart |
| Javier Assad | CHC | 75% | It’ll ultimately be between him and Brown for a rotation spot |
| Cristian Mena | ARI | 65% | Providing length out of MLB bullpen with Ryne Nelson back in rotation |
| Bradgley Rodriguez | SDP | 64% | Got first call to MLB; optioned back down but should be back |
| Kumar Rocker | TEX | 62% | Optioned to AAA; will there be a rotation spot open for him at any point? |
| Ben Brown | CHC | 57% | Might keep working behind opener, shorter stints eventually? |
| Rob Zastryzny | MIL | 54% | Pitched his way into circle of trust |
| Génesis Cabrera | CHC | 49% | Pitching well since joining team |
| Bowden Francis | TOR | 46% | SP ineffectiveness could lead to move to bullpen sooner than later |
| Craig Kimbrel | ATL | 37% | Welcome back to ATL, Craig! |
| Steven Matz | STL | 35% | Pitching in shorter stints out of bullpen, return to rotation at any point looks unlikely |
| Michael Lorenzen | KCR | 31% | Noah Cameron emergence; he’s got bullpen experience anyway! |
| Andre Pallante | STL | -30% | Pitching well enough to stay in rotation |
| Drey Jameson | ARI | -30% | On AAA IL (elbow) |
| Luis Mey | CIN | -31% | Optioned back to AAA |
| James McArthur | KCR | -33% | Still hasn’t started rehab assignment |
| Charlie Morton | BAL | -33% | Finally stringing some good starts together, so he should stick |
| Zebby Matthews | MIN | -33% | Some better starts lately + López injury |
| Ryne Nelson | ARI | -33% | Moving back to rotation |
| Andrew Walters | CLE | -35% | Lat strain |
| Scott Blewett | ATL | -35% | DFA’d |
| Grant Holmes | ATL | -47% | Much likelier to stay in rotation with AJSS injury |
| David Festa | MIN | -50% | Bad start in West Sac but should stay in rotation with López out |
| Mitch Spence | ATH | -55% | Moved to rotation |
| Tyler Alexander | MIL | -67% | DFA’d |
| Tanner Rainey | PIT | -74% | DFA’d |
| José Ruiz | PHI | -75% | DFA’d |
| Tyson Miller | CHC | -80% | DFA’d |
| Evan Phillips | LAD | -100% | Tommy John surgery |