2021 Review — Starting Pitcher xK% Overperformers

March 3, 2022
Yesterday, I shared my latest pitcher xK% equation and identified and discussed the nine starting pitchers that most underperformed those marks.

Yesterday, I shared my latest pitcher xK% equation and identified and discussed the nine starting pitchers that most underperformed those marks.
Here is a tale of two tweets.
The first one tries to see if fantasy managers would consider rostering a great pitcher in every regard except they would have a 5.00 ERA.
Would you consider rostering an elite pitcher in all aspects (e.g. Woodruff) expect they would guarantee to have a 5.00 ERA (think Andrew Heaney HR issues but worse)?
— Jeff Zimmerman (@jeffwzimmerman) February 21, 2022
And now the same options (I see the steam vs. stream mistake, my bad!) but for a hitter who is projected to have a .220 AVG.
Would you consider rostering a hitter pitcher in all aspects (e.g. Kyle Tucker) expect they would be guaranteed to have a .220 AVG?
Assume a 5×5 Roto league.
— Jeff Zimmerman (@jeffwzimmerman) February 22, 2022
The results are a stark difference. The deal is that a .220 AVG and a 5.00 ERA will hurt a roto team the same amount. While it may not be obvious, a little math might help. To determine the effects, I took the Standings Gain Points equations from 15-team redraft leagues from The Process (a great resource, you should buy it).
AVG SGP = ((1669+H)/(6525+AB)-0.256)/0.0012
ERA SGP = (((489+ER)*9)/(1122+IP)-3.92)/(-0.0566)
These formulas determine how much a fantasy team would move up and down the standings based on the rate stat. The volume does matter since it’s worse to add 150 innings of a 5.00 ERA to a team than just 20 innings. Read the rest of this entry »
It’s been a looooooooong journey toward understanding what underlying skills drive a hitter’s BABIP ability. No matter how much understanding we have gained over the years, it has been a struggle to develop an equation that produced an R-squared much over 0.50. That’s not terrible, but when my hitter xHR/FB equation spits out an impressive 0.826 R-Squared, I continue to strive for better. I shared my last hitter xBABIP equation almost exactly five years ago, and since, I have yet to see a better one.
Let’s continue diving into the components of my hitter xHR/FB equation by reviewing the 2021 leaders in Pull FB% (PFB). This is the percentage of a hitter’s fly balls that are pulled. For home runs, the higher the PFB, the better…for the most part (there are always exceptions). Why? In the Statcast era (since 2015), average distance of fly balls by batted ball direction were as follows:
| Direction | Avg Dist in Feet (2015-2021) |
|---|---|
| Pull | 342 |
| Straightaway | 329 |
| Opposite | 292 |
Those are some serious differences solely based on the fly ball’s horizontal direction. Since hitters hit the ball further, on average, when they pull their flies, then a higher rate of pulled flies should typically result in a higher HR/FB rate. So let’s now review the 2021 PFB leaders (minimum 20 fly balls).
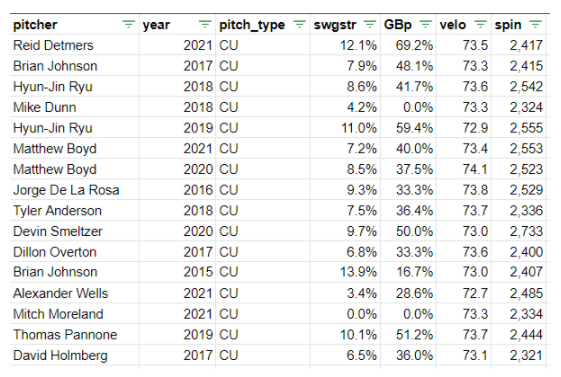
A few days ago, I wrote an article examining Reid Detmers. For Detmers, I posted the following table on comparable curveballs and the lack of results.
After just updating the appendix last year, The Process has been fully updated for next season and is available in digital (full and appendix) and print versions.
Some of the new highlights from the book are:
For the first time this year, I added an all-star break hitter poll to pair with my pitcher poll. The hitter poll pitted the 10 greatest xwOBA overperformers against the 10 most significant underperformers. I asked you which group would post a higher second half wOBA and which range each group’s wOBA would fall into.
During the all-star break, I once again polled you on which group of 10 starting pitchers would post a lower ERA during the second half, and which ERA range each group’s aggregate would fall into. Let’s now review the results.
Yesterday, I wrote about the replacement level hitters in the NFBC 12-team Online Championship (OC) and the 15-team Main Event (ME). In the comments, Joe Wilkey asked:

There are a couple of good questions here, so it’s time to start working through them. I’ll start with “Is batting average unpredictable?” Yes, with any given player’s actual range being unacceptable for a fantasy manager. Looking back at Steamer Projections (2010 Steamer to 2021), I found the standard deviation for the difference between the projected and actual batting average. Read the rest of this entry »
In most weekly leagues, the ability to add and drop players is gone for this season. Since there are no more moves, I’m going to analyze the most added and dropped players in NFBC’s Main Event and Online Championship with the main goal to create a composite replacement-level player.
For reference, the Online Championship (OC) leagues have 12 teams while the Main Event (ME) has 15. Both of the leagues require 23 starters each week with 7 bench spots (no IL spots). At all times, 360 players will be rostered in an Online league and 450 in a Main Event league. The reason I decided on the two NFBC formats were:
I know at times we may seem a little NFBC centric here at Rotographs. Now, if some other platform had the ability to select a league type and make available all the adds and drops, I’d use them. The NFBC is the only platform that offers this service. Read the rest of this entry »