Position Player Playing Time Changes: April 22, 2025
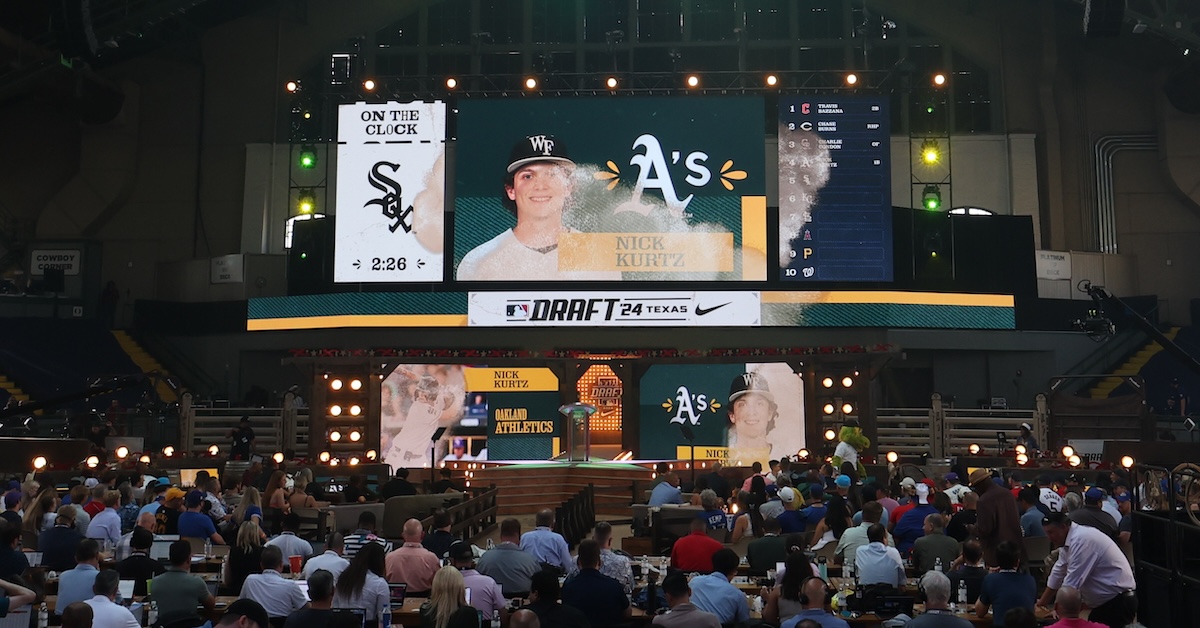
Here are the latest playing time projection changes for position players since April 15th. Get ready for Nick Kurtz’s debut on Wednesday!

Here are the latest playing time projection changes for position players since April 15th. Get ready for Nick Kurtz’s debut on Wednesday!
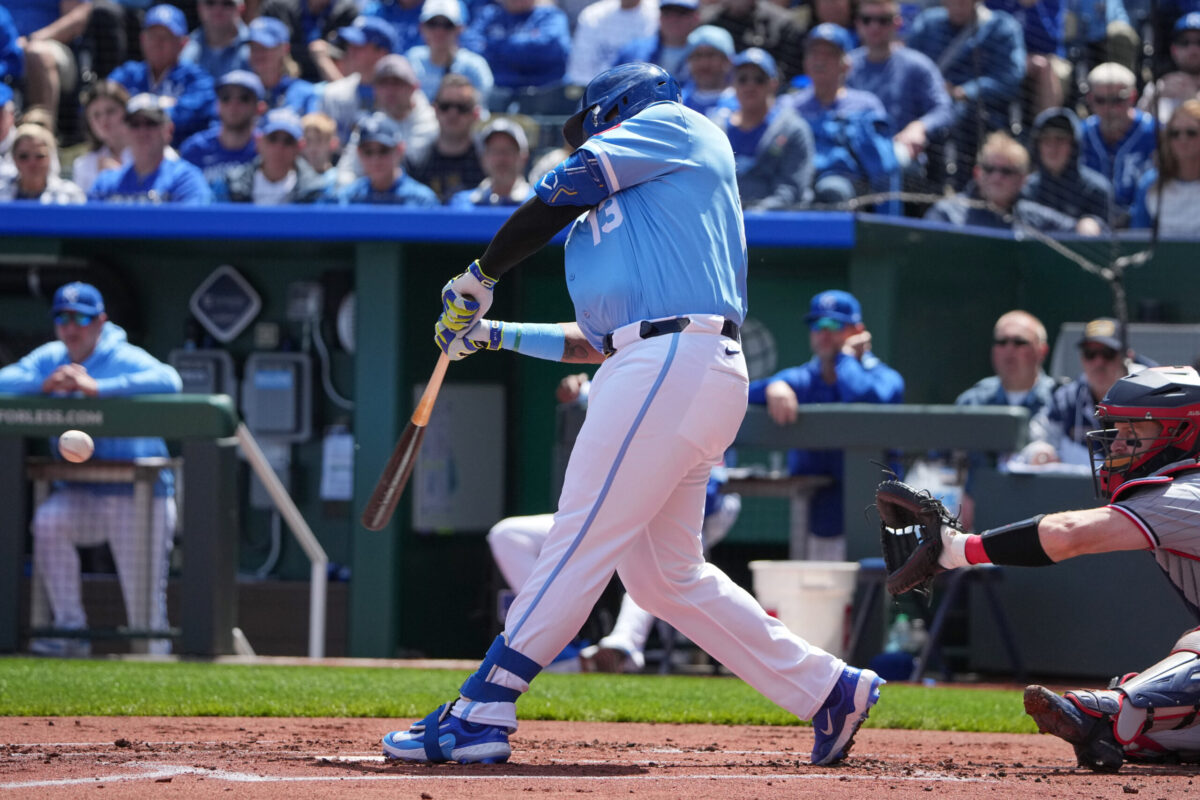
Usually this early in the season, I would share the xwOBA under/overperformers. However, a suppressed or inflated BABIP has a dramatic impact on the gap between wOBA and xwOBA and since we remain in small sample size territory for the metric, I didn’t want to include a list of obvious names. We all assume a sub-.200 BABIP is going to rebound! Likewise, a .450 BABIP isn’t sustainable. So instead, let’s review ISO versus xISO.
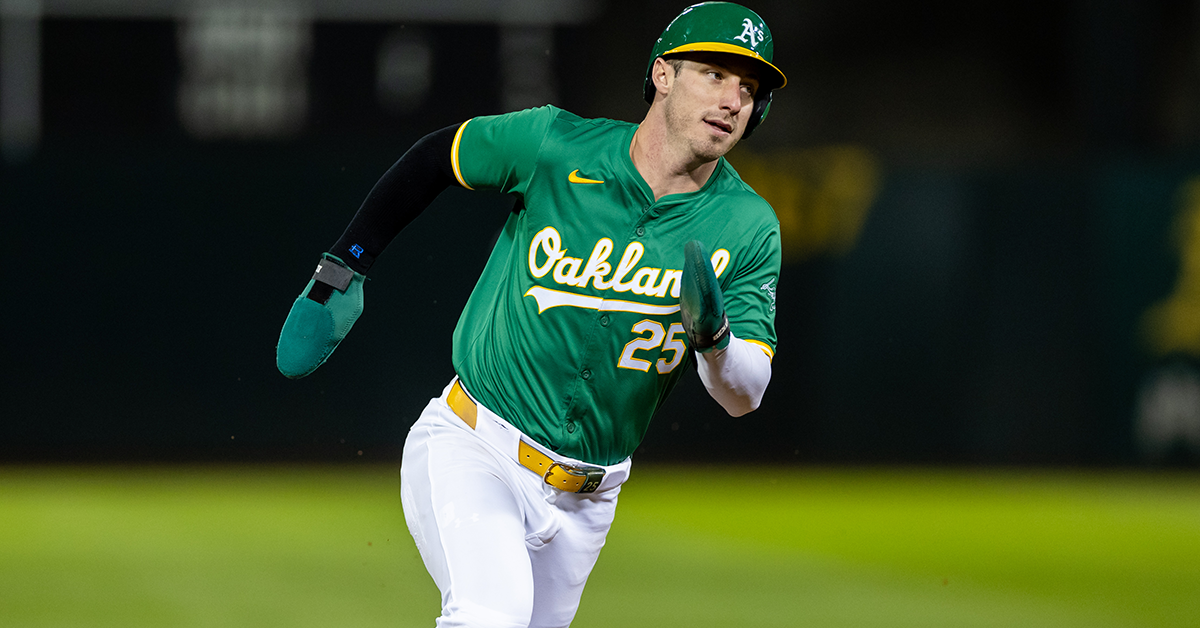
Angels
• Tim Anderson (.422 OPS) and Kevin Newman (.273 OPS) split time at shortstop. Read the rest of this entry »
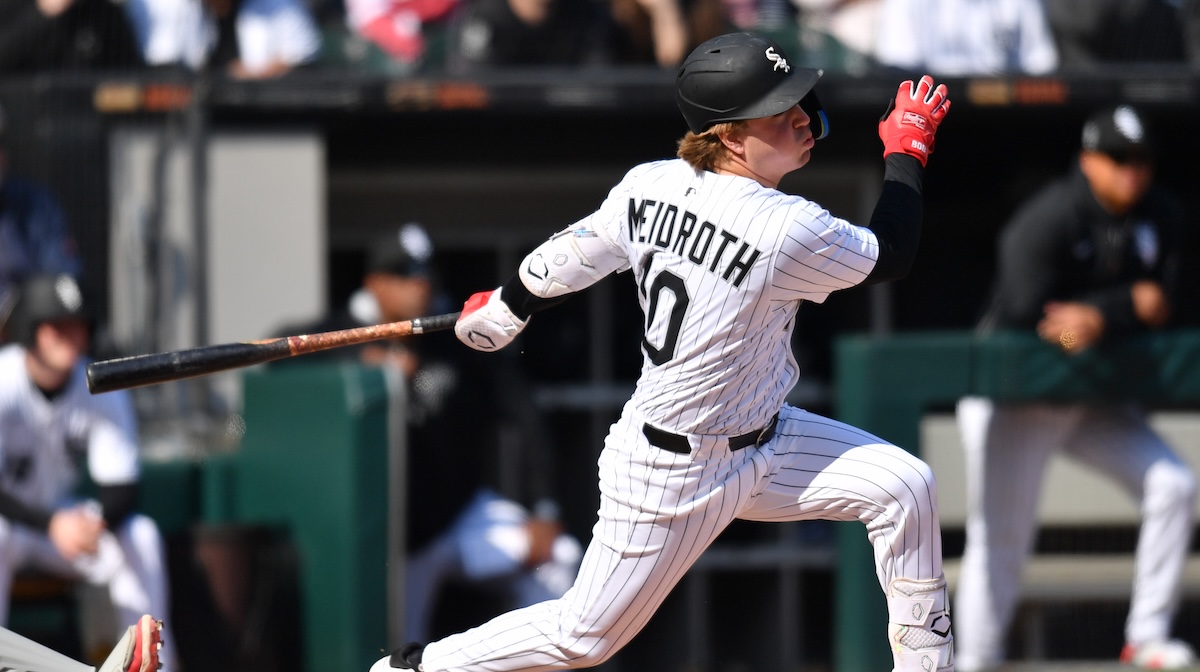
Here are the latest playing time projection changes for position players since April 8th, highlighted by a couple of interesting prospects forcing their way to — or closer to — the majors.

Angels
• Tim Anderson started in the last five games while batting ninth. Read the rest of this entry »
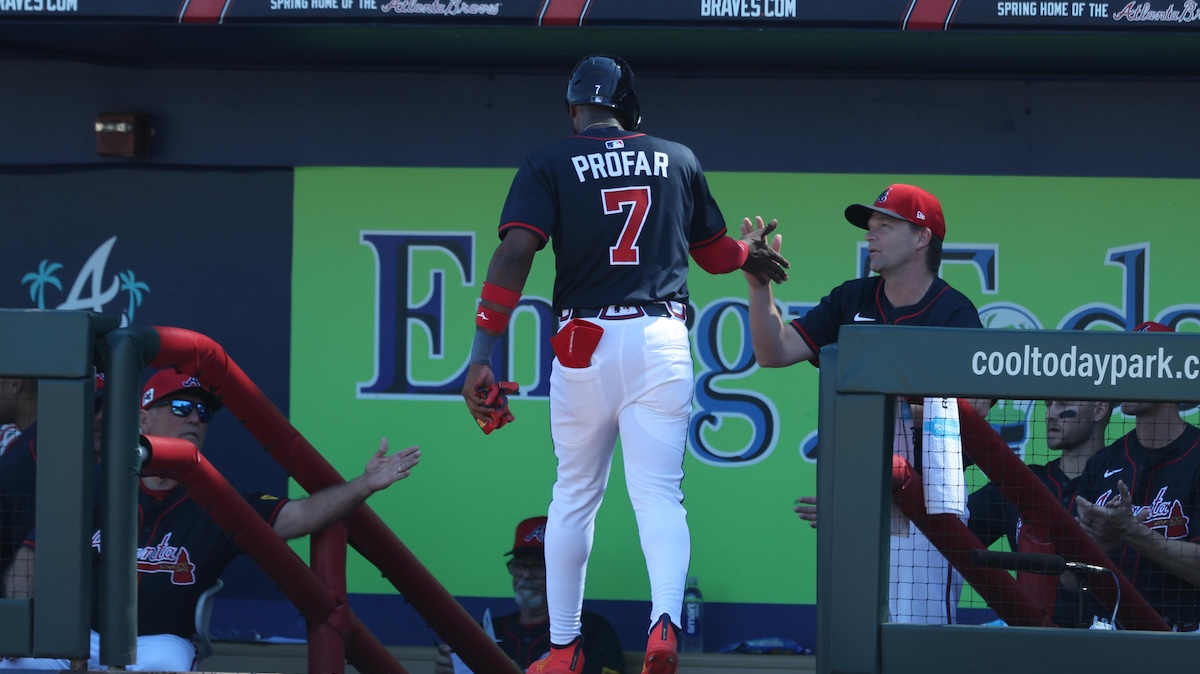
Here are the latest developments in position player playing time projections for the rest of the season. Now that the season is in full swing, we’re unfortunately seeing the injuries roll in, as well as a big PED suspension for Jurickson Profar.
While we remain in small sample territory, it’s always fun to look at the league leaders in various process-related rate metrics (though you can definitely go a layer deeper). Results are far less predictive right now, so let’s take a gander at which batters are leading in some of the statistics that we should actually care about right now, a least a little bit.
Angels
• Nolan Schanuel moved up to bat third. Read the rest of this entry »
It’s hard to evaluate statistics this early without sounding the small sample size alarm bells. Yesterday, I looked at hitter bat speed, which supposedly conveys meaningful information after only a few swings, but still isn’t perfect this early. Today, I’ll look at another metric that works over small sample sizes, but only one side. That’s maxEV or the highest exit velocity a batter has hit a ball over a specified time period. We can evaluate the maxEV gainers already, but given that the metric could increase as the season progresses, it doesn’t make sense to review the fallers.

Welcome to the regular season, and welcome to the first in-season edition of Position Player Playing Time Changes! This will be very similar to the Spring Training editions, but with a change to go over.
During Spring Training, the changes had been shown in plate appearances, since every team had a full season to play, but it’ll now be displayed in percentage of remaining plate appearances. T are 700 plate appearances available to each player at the start of the season, but there are only 350 available when the player’s team has played 81 games, for example. So you and I both won’t have to constantly re-contextualize what remaining plate appearance means relative to games played, we’ll stick with percentages now.
To start the year, I’ll be using a cutoff of a 10% plate appearance swing in either direction, but that cutoff will go down as the season goes on (since 10% of 158 games is the same as 5% of 78). Occasionally, I’ll include players a little bit under the cutoff if they’re notable enough. Without further ado, let’s get to it:


