Jake Mailhot’s 2026 Tiered Rankings for Ottoneu Points: Third Base

The Ottoneu rankings push continues this week with a look at the hot corner. You can find all the information about the format and methodology for these rankings in Chad’s introduction.
Changelog
- 2/18/2026: Updated projections w/ ZiPS and OOPSY. Added player notes for all players in tier $1-$2 and above. Updated tier placement for five players (green = moved up, red = moved down).
- 3/18/2026: Updated tier placement for three players based on 2026 draft results.
Jake Mailhot’s Ottoneu Tiered Rankings for Points Leagues: C | 1B | MI | 3B | OF | SP | RP
Chad Young’s Ottoneu Tiered Rankings for Points Leagues: C | 1B | MI | 3B |OF | SP | RP
Chad Young’s Ottoneu Tiered Rankings for 4×4: C | 1B | MI | 3B | OF | SP | RP
Here are few more notes about my process:
- Projected points. I’ve been building my own homebrewed projections for the past decade plus, ever since I started playing Ottoneu, and they form the basis for the rankings below. They’re nothing overly complicated; essentially just a MARCEL-esque projection using three years of historical data filtered through a rough aging curve and adjusted for the current run environment. I also include a collection of up to five public projection systems (ZiPS, Steamer, OOPSY, THE BAT, and PECOTA) to provide some additional context. That gives each player a wealth of data sources to form their projection. Currently, the projections below only include Steamer and THE BAT projections. I will update the rankings in February once ZiPS, OOPSY, and PECOTA are released.
- P/G vs P/PA. Points per game played is the gold standard by which you should be evaluating players in Ottoneu. I won’t argue with that. That measure does have some drawbacks, particularly for players who pinch hit, pinch run, or are used as defensive substitutions often. Those limited appearances can skew a player’s P/G lower than what they’re producing when they’re getting three or four plate appearances when they start a game. To provide a little more context for these kinds of players, I’m projecting players using points per plate appearance. That measure should give us a better idea of how a player produces no matter how he’s used by his team.
Just to reiterate a point that Chad makes in his introduction: yes, these rankings are presented ordinally, but the tier a player appears in is much more important than if they’re ranked 16th or 28th. Within tiers, players are generally ranked by their projected Pts/PA but that doesn’t necessarily mean I think one player is significantly more valuable than another in the same tier. I’ve got notes on the top 15-ish players below and I’ll add more notes when I update the rankings next month. Let’s get into it.
| Tier | Rank | Player | Position | Projected Pts | Pts/PA | Notes |
|---|---|---|---|---|---|---|
| $36-$44 | 1 | José Ramírez | 3B | 954.8 | 1.46 | 133 wRC+ in 2025 was a “down” year for him. Contact quality slipped a bit too. |
| $28-$35 | 2 | Junior Caminero | 3B | 848.1 | 1.42 | Blasted 45 home runs in his first full year in the big leagues. Move back to Tropicana Field won’t help but has enough power that it won’t matter much. |
| $21-$27 | 3 | Max Muncy (LAD) | 3B | 528.6 | 1.31 | Muncy’s wRC+ after he started wearing glasses on April 30: 166. Contact quality improved and strikeout rate dropped by 5 points. |
| $21-$27 | 4 | Austin Riley | 3B | 713.2 | 1.28 | Four straight years of declining production is a big concern. Contact quality looks fantastic but plate discipline deteriorated in 2025. |
| $21-$27 | 5 | Manny Machado | 3B | 803.1 | 1.26 | A useful accumulator with good skills across the board. Always plays — two seasons in his entire career w/ less than 150 games played. |
| $15-$20 | 6 | Munetaka Murakami | 3B | 710.7 | 1.29 | The power is definitely real but there’s huge risk in his contact rate. The projections look decent, but the adjustment period could hurt. |
| $15-$20 | 7 | Matt Chapman | 3B | 719.7 | 1.21 | Pretty reliable contributor across the board. No weaknesses, but no standout skills either. |
| $15-$20 | 8 | Alex Bregman | 3B | 726.6 | 1.20 | New home in Wrigley Field shouldn’t hurt his pull-heavy approach too much and he had his best contact quality of his career in 2025. |
| $10-$14 | 9 | Kazuma Okamoto | 1B/3B | 636.2 | 1.22 | Much more stable profile than Murakami without the high ceiling. Will probably end up getting 3B eligibility. |
| $10-$14 | 10 | Isaac Paredes | 3B | 612.8 | 1.22 | Hamstring injury derailed a very good first year in Houston. Some concerns about playing time in a crowded lineup. |
| $10-$14 | 11 | Eugenio Suárez | 3B | 750.7 | 1.20 | Couldn’t keep his offensive resurgence going after re-joining Seattle. Ceiling might come down to where he signs. |
| $10-$14 | 12 | Sal Stewart | 1B/3B | 570.8 | 1.19 | Solid debut late last year with impressive contact quality. Needs to earn a spot in a crowded lineup. |
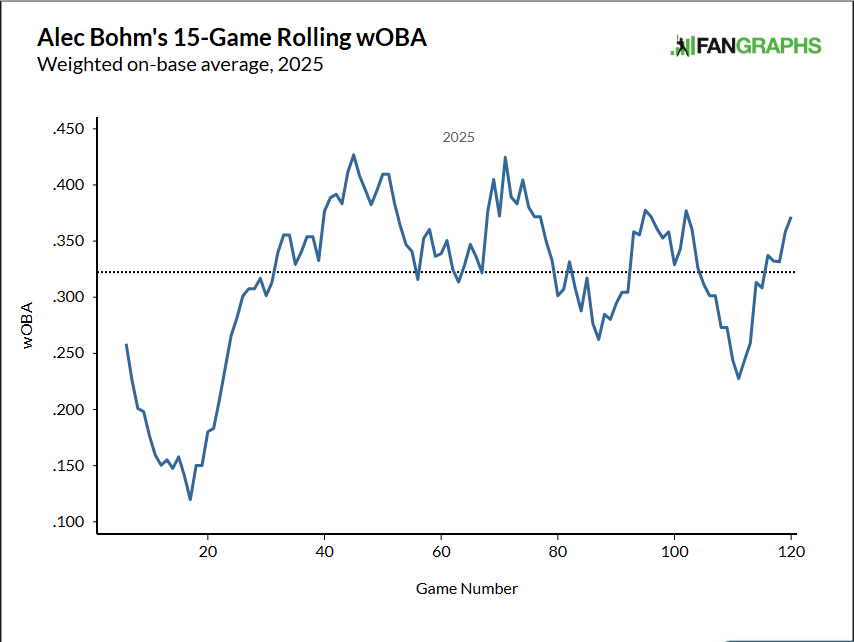
| $6-$9 | 13 | Alec Bohm | 1B/3B | 645.6 | 1.16 | Career-high contact rate in 2025, but still pounds the ball into the ground too often. |
| $6-$9 | 14 | Addison Barger | 3B/OF | 531.6 | 1.15 | 1H breakout (125 wRC+) slowed way down in 2H (87) and then starred in the postseason (188). Great contact quality, needs to hone plate approach. |
| $3-$5 | 15 | Mark Vientos | 3B | 526.3 | 1.16 | Couldn’t repeat his breakout from 2024, rebounded a bit in 2H ’25. Contact quality looks good and strikeout rate dropped 5 points. |
| $3-$5 | 16 | Yoán Moncada | 3B | 393.3 | 1.13 | Big contact quality improvements in 2025 came at the cost of a slightly lower contact rate. The big question is if he can stay healthy. |
| $3-$5 | 17 | Royce Lewis | 3B | 490.2 | 1.12 | Is he healthy? If he is, is he the guy who posted a 152 wRC+ in 2023 or an 85 wRC+ in ’25? |
| $3-$5 | 18 | Noelvi Marte | 3B/OF | 475.3 | 1.09 | Looked pretty good after returning from PED suspension in July. Plate approach leaves a lot to be desired. |
| $3-$5 | 19 | Miguel Vargas | 1B/3B | 558.6 | 1.07 | Earned a shot at full-time at-bats and delivered a solid season with a good plate approach and decent contact quality. |
| $1-$2 | 20 | Miguel Andujar | 3B/OF | 399.6 | 1.13 | What a weird career arc. Huge 2H in 2025 was likely BABIP fueled (.413 BABIP w/ Cincinnati) but that comes with his aggressive, contact-oriented approach. |
| $1-$2 | 21 | Matt Shaw | 3B | 438.1 | 1.08 | Up-and-down rookie season in 2025 and now it doesn’t look like he has a spot in the starting lineup with Bregman in town. |
| $1-$2 | 22 | Otto Kemp | 1B/3B/OF | 365.8 | 1.08 | Really solid contact quality, really poor plate approach. Also on the short side of a platoon in Philadelphia. |
| $1-$2 | 23 | Connor Norby | 3B | 439.4 | 1.03 | Injuries took a toll on him in 2025, but had a really intriguing debut back in ’24. Contact rate needs to improve to maintain any sort of success. |
| $1-$2 | 24 | Nolan Arenado | 3B | 538.6 | 1.01 | Offense cratered in 2025. Too much elevated contact without enough quality to do real damage. Maybe we’ll see a dead cat bounce now that he’s been traded to Arizona. |
| $1-$2 | 25 | Josh Jung | 3B | 485.0 | 1.01 | Injuries have derailed what had been a promising start to his career. Contact quality improved in 2025 and the contact rate jumped nearly 6 points, but still too aggressive with his approach. |
| $1-$2 | 26 | Ryan McMahon | 3B | 560.0 | 1.01 | Contact quality has been excellent but it’s really hard to survive with a strikeout rate over 30%. Probably on the strong side of a platoon in New York. |
| $0-$1 | 27 | Christian Encarnacion-Strand | 1B/3B | 272.4 | 1.03 | |
| $0-$1 | 28 | Nate Eaton | 3B/OF | 297.6 | 1.02 | |
| $0 | 29 | Justin Turner | 1B/3B | 405.4 | 1.06 | |
| $0 | 30 | Kyle Karros | 3B | 315.5 | 0.98 | |
| $0 | 31 | Jeimer Candelario | 1B/3B | 351.6 | 0.95 | |
| $0 | 32 | Will Wagner | 1B/3B | 221.0 | 0.94 | |
| $0 | 33 | Jose Miranda | 3B | 346.7 | 0.94 | |
| $0 | 34 | Abraham Toro | 1B/3B | 325.5 | 0.92 | |
| $0 | 35 | Oswaldo Cabrera | 3B | 220.4 | 0.89 | |
| $0 | 36 | Brady House | 3B | 393.8 | 0.88 | |
| $0 | 37 | Gio Urshela | 3B | 258.1 | 0.88 | |
| $0 | 38 | Deyvison De Los Santos | 1B/3B | 336.0 | 0.87 | |
| $0 | 39 | Ke’Bryan Hayes | 3B | 443.1 | 0.85 | |
| $0 | 40 | Nacho Alvarez Jr. | 3B | 258.4 | 0.84 | |
| $0 | 41 | Ben Williamson | 3B | 314.0 | 0.83 |