2019 Fantasy Baseball Profitability By Team
Introduction
I thought it would be an interesting exercise today to look at fantasy baseball in a different way – profitability at the major league team level. Certainly, the better real-life clubs consist of not only more fantasy relevant players, but also of the higher quality ones.
But what else can be said about the profitability of the fantasy player pool at the team level? Does a higher spend translate to more value for fantasy owners? Does winning ball games correlate with higher levels of fantasy profitably? What can we learn from looking at player investments from this unique ball club perspective?
Let’s dive in and see …
Definitions & Methodology
For today’s analysis, I have used the same pre-season pricing and full-season valuations as in my game theory projections comparison. There are three specific quantities that are relevant here:
- $Value – This is the 2019 full season rotisserie value that each player provided this season. I use my own auction calculator which employs a Z-score methodology to generate the $Values. Standard NFBC 15-team settings are assumed (Mixed AL/NL, $260 budget, standard NFBC positions). I assume that players are only eligible at their original 2019 positions + any positions that they were expected to gain in the first 2 weeks of the season.
- $AAV – Average Auction Value – This is the average of what NFBC owners paid to acquire players during the heart of the 2019 draft season. These values come from all NFBC auctions between March 15, 2019 and March 25, 2019.
- $Profit – The difference between the $Value and the $AAV per player.
One note regarding $Profit – I technically will use a “Capped profit” rather than the straight profit amount. For an explanation of why player profits should be capped, refer to this article. For today’s venture, all profits will be capped at -$5.
As far as assigning a major league team to each player, we will use the simplistic approach of setting opening day 2019 as the point in time to determine eligibility. If we really wanted to, I suppose that we could get into the complicated math and accounting of tracking player transactions and allocating player performance to multiple teams. For this analysis, we will stick to a static point in time for team eligibility – which is simpler and more relevant.
For the ensuing analysis, we will focus on the top 450 players in the player pool, according to the $AAVs. Players who were not selected in NFBC auctions will not be considered for this analysis.
Results – Hitters

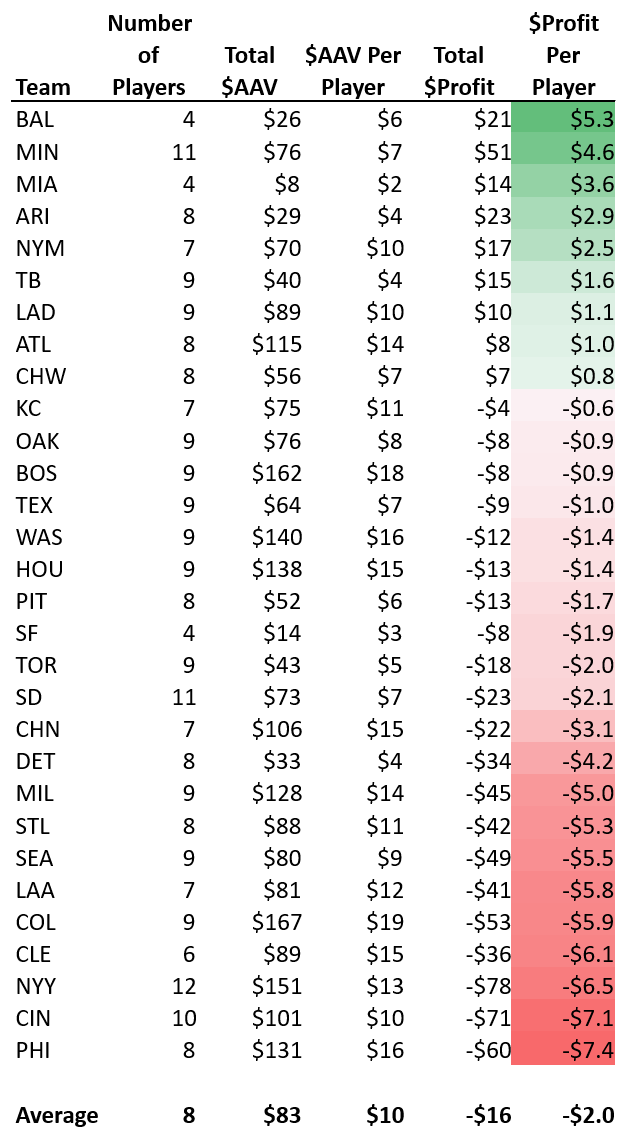
Only nine out of the thirty major league ballclubs turned a profit on their hitters in the aggregate. No team produced more offensive profit than the Minnesota Twins, while the Baltimore Orioles were the most profitable on a per player basis. Trey Mancini, Renato Nunez and Jonathan Villar assisted the Orioles here, while Mitch Garver, Jorge Polanco, Miguel Sano and Max Kepler aided the Twins. The Twins were not expected to win the division in 2019 – but an offensive explosion certainly assisted. [Yours truly did correctly predict them to win the NL Central, as seen here.]
On the bottom end it was Ryhs Hoskins, Andrew McCutchen and Jean Segura who helped the Phillies become the least efficient baseball team on the hitter side. By magnitude, it was the Yankees who accumulated the most negative value in the aggregate. Despite rostering one of the most profitable players in all of fantasy last season in D.J. LeMahieu, injuries to Giancarlo Stanton, Aaron Judge, Aaron Hicks and Miguel Andujar left the Yankees value depleted.
Interesting to note are the Detroit Tigers. Though the sum of all auctioned players values was a meager $33, they were highly unprofitable – so much so, that their negative profits exceeded the entire sum of money spent on their team’s players at the auction.
Results – Pitchers

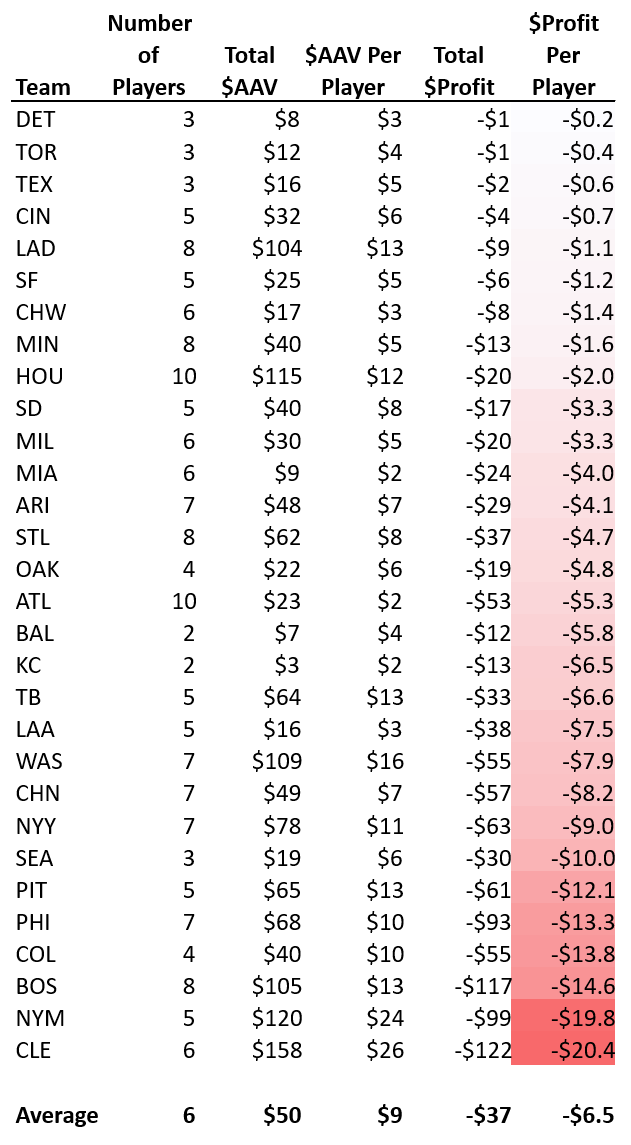
All thirty major league ballclubs were unprofitable in the aggregate for the pitchers. In general, pitchers in fantasy baseball are a riskier commodity than hitters and show lower levels of profitability on a group basis (as above).
The Tigers who only had $8 spent on their players during the draft season – broke even. On the other side, the Indians staff caused owners to lose a whopping $122 of profit, or over $20 per pitcher selected.
The Dodgers stood out as a relatively successful team for fantasy pitchers in 2019. Fantasy owners bought 8 Los Angeles hurlers (3rd highest of any team) for a total of $104 of $AAV (6th highest of any team). Successful players this year such as Hyun-Jin Ryu, Pedro Baez and Julio Urias kept the Dodgers staff close to break-even.
At the other end, fantasy teams only employed 3 Seattle pitchers for a grand total of $19 – a trio which sunk owners $30 of profit. You can say Yusei Kikuchi (sorry for the lame pun) and Hunter Strickland were the two largest culprits for the AL West club from Washington State.
Results – All Players

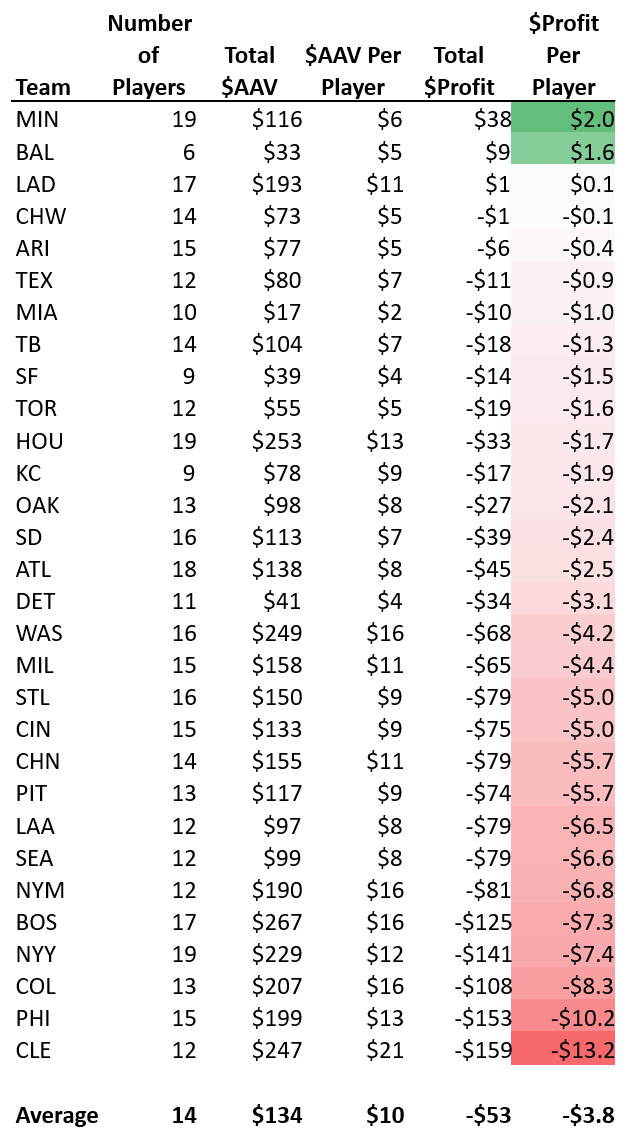
Only three teams (the Twins, Orioles and Dodgers) carried a positive profit when considering both hitters and pitchers. The Twins were remarkable this season in that 19 of their players were selected by fantasy drafters – tied for the most by any team. Their players on the whole avoided the value drainers and amassed the most fantasy profit in baseball.
The White Sox and Diamondbacks followed next in profitability – as they essentially both broke even. At the bottom, it was the Indians, Phillies and Rockies who were awful on a per-player basis – both were teams that fell short of 2019 expectations.
Before we converse more about profitability, let’s take a quick look at the quantity of fantasy players selected per team, compared to their final 2019 win totals.
| Team | Number of Players | 2019 Final Win Total | Result |
|---|---|---|---|
| HOU | 19 | 107 | Won Division |
| MIN | 19 | 101 | Won Division |
| NYY | 19 | 103 | Won Division |
| ATL | 18 | 97 | Won Division |
| BOS | 17 | 84 | |
| LAD | 17 | 106 | Won Division |
| SD | 16 | 70 | |
| STL | 16 | 91 | Won Division |
| WAS | 16 | 93 | Wildcard |
| ARI | 15 | 85 |
There was a definite positive correlation between the number of fantasy players per MLB team, and their final real life performance. The top 4 teams all won their division. 7 of the top 9 teams made the playoffs, and 9 out of the top 10 teams finished with a winning record.
This may seem obvious in retrospect, but Cleveland was favored over Minnesota for the AL Central, and Boston was about even with New York for the AL East, etc. The R-Squared for the relationship is 58%.
Profitability & Player Spend
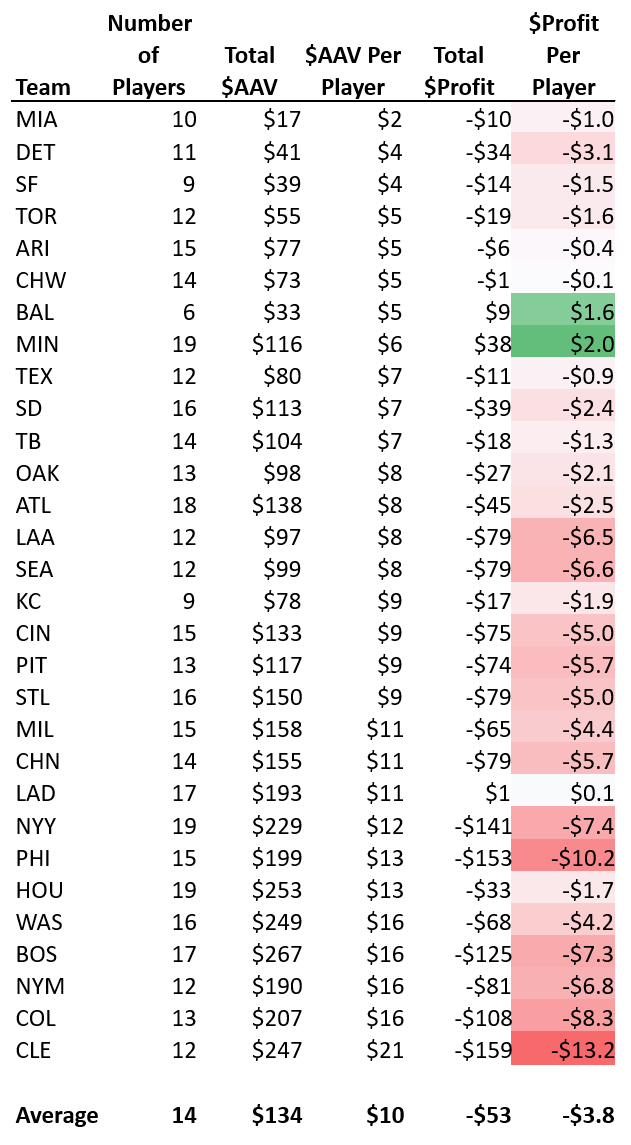
Let’s get back into our main discussion once again. Below are the profitability results by team as above (for both hitters & pitchers), now sorted in ascending order according to $AAV per player purchased.

It should be intuitive that higher priced players generate lower levels of profitability. We can see that visually by inspecting the above. As the average player spend went up, teams tended to be less profitable. In fact, the correlation between the two is just about as strong as we saw in the previous section – computing to an R-Squared of 55%.
Below is a summary of variable dependencies accumulated at the team level:
| Variable | Number of Players | Total $AAV | $AAV Per Player |
|---|---|---|---|
| Total Profit | 4% | 46% | 55% |
| Profit Per Player | 1% | 37% | 55% |
What is of note is that pitchers exhibit slightly higher degrees of correlation than hitters do. The R-Squared for pitchers [per player profit vs. per player $AAV] is 53%, while for hitters it is only 23%. That is, it may be of a slight advantage to look pitchers on teams with low $AAV players.
Closers and middle relievers who ended up with some saves such as Shane Greene, Ken Giles, Chris Martin & Anthony Bass were profitable players on low $AAV teams.
Takeaways
This exercise turned out to be mostly informational and descriptive. We do not typically look at profitability at the major league team level, so it was interesting to see it displayed in this manner.
There aren’t many takeaways here that we couldn’t learn from looking at individual player data. But sometimes dynamics do change when aggregating or combining, and sometimes conclusions can be more pronounced. If nothing else, this article serves as a confirmation of intuition. Hopefully, today’s exercise opens us up to question some concepts.
Here are a few minor takeaways from the above:
- As we have seen before, pitchers tend to lose more value during the season than hitters.
- The number of players selected in fantasy baseball by team is predictive for the end of season win totals.
- The Twins were an example of a team that was not predicted to win their division despite having the largest number of players that were drafted in NFBC auctions. If I were a betting man, I may look to uncover undervalued bets on team futures by applying logic seen here.
- Players selected from teams with a higher per player $AAV are more likely to exhibit lower levels of profitability. The correlation is meaningful.
- Adding to the above point – pitchers exhibit this relationship more than the hitters do. In terms of optimizing profitability, it is more important to include several low-end pitchers on your fantasy rosters than it is to include low-end hitters.
- One potential source of uncovering fantasy value is to look at closers and middle relief pitchers (who could back into saves) on teams with many low $AAV players. In other words, consider purchasing saves on “cheap” teams.
Ariel is the 2019 FSWA Baseball Writer of the Year. Ariel is also the winner of the 2020 FSWA Baseball Article of the Year award. He is the creator of the ATC (Average Total Cost) Projection System. Ariel was ranked by FantasyPros as the #1 fantasy baseball expert in 2019. His ATC Projections were ranked as the #1 most accurate projection system over the past three years (2019-2021). Ariel also writes for CBS Sports, SportsLine, RotoBaller, and is the host of the Beat the Shift Podcast (@Beat_Shift_Pod). Ariel is a member of the inaugural Tout Wars Draft & Hold league, a member of the inaugural Mixed LABR Auction league and plays high stakes contests in the NFBC. Ariel is the 2020 Tout Wars Head to Head League Champion. Ariel Cohen is a fellow of the Casualty Actuarial Society (CAS) and the Society of Actuaries (SOA). He is a Vice President of Risk Management for a large international insurance and reinsurance company. Follow Ariel on Twitter at @ATCNY.

i find it interesting that several of the teams that were profitable were likely teams people avoiding since they werent predicted to be contenders. MIA, BAL, MIn etc were essentially glazed over which may tell us that people overvalue the team aspect of fantasy (who will they drive in, will they get driven in? logic)
Anyone hitting in a team’s 4th slot will knock in a large amount of runs – no matter how inept the lineup is.