​
​
Sign In
  • Support FanGraphs
    FanGraphs Membership
    FanGraphs Shirts
    FanGraphs Mugs
    Gift a Membership
    Donate to FanGraphs
  • Fantasy
    Fantasy Tools
    Fantasy Player Rater
    Auction Calculator
    Ottoneu Fantasy Baseball
    Signup, FAQ, Blog Posts
  • Blogs
    Blog Roll

    FanGraphs
    • FanGraphs Weekly Mailbag: July 26, 2025
    • Effectively Wild Episode 2353: Wouldn't Trade Him for the World
    • Yankees Patch Their Third Baseman-Shaped Hole With Ryan McMahon
    • Mariners Bolster Lineup by Acquiring Josh Naylor From Diamondbacks
    Podcasts: Effectively Wild

    FanGraphs Prospects

    RotoGraphs
    • The Sleeper and the Bust Episode: 1438 – 2-Start Pitchers for Week 19
    • Lineup Analysis (7/27/25)
    Podcasts: The Sleeper and The Bust | Field of Streams | Beat the Shift

    Community Research
    • Effectively Wild's Preseason Predictions Game Update: Ben Clemens

    Archived Blogs: The Hardball Times | NotGraphs | TechGraphs | FanGraphs+
    Archived THT: THT Live | Dispatch | Fantasy | ShysterBall
    Archived Podcasts: FanGraphs Audio | Chin Music | UMP: The Untitled McDongenhagen Project | Stealing Home | Doing It For Bartolo | OttoGraphs |
  • Projections
    2025 Pre-Season Projections
    ZiPS, ZiPS DC
    Steamer
    Depth Charts
    ATC
    THE BAT, THE BAT X
    OOPSY
    2025 600 PA / 200 IP Projections
    Steamer600, Steamer600 (Update)
    2025 Updated In-Season Projections
    ZiPS (RoS), ZiPS (Update), ZiPS DC (RoS)
    Steamer (RoS), Steamer (Update)
    Depth Charts (RoS)
    ATC DC (RoS)
    THE BAT (RoS), THE BAT X (RoS)
    OOPSY DC (RoS)
    3-Year Projections
    ZiPS 2026, ZiPS 2027
    On-Pace Leaders
    Every Game Played, Games Played %
    Cy Young Award Projections

    Auction Calculator
  • Scores
    Today
    Live Scoreboard, Probable Pitchers
    Live Daily Leaderboards
    Win Probability & Box Scores
    2025, 2024, 2023, 2022, 2021, 2020, 2019
    AL Games
    COL (6) @ BAL (5)Final
    PHI (12) @ NYY (5)Final
    TOR (6) @ DET (2)Final
    LAD (5) @ BOS (2)Final
    CHC (5) @ CHW (12)Final
    ATL (3) @ TEX (8)Final
    WSN (0) @ MIN (1)Final
    ATH (15) @ HOU (3)Final
    SEA (2) @ LAA (3)Final/10
    NL Games
    MIA (5) @ MIL (1)Final
    ARI (1) @ PIT (0)Final/11
    TBR (2) @ CIN (7)Final
    SDP (0) @ STL (3)Final
    NYM (8) @ SFG (1)Final
  • Standings
    2025 Projected Standings
    2025 Playoff Odds, Playoff Odds Graphs
    2024 ZiPS Postseason Game-By-Game Odds
    AL East
    Blue Jays62420.0
    Yankees56475.5
    Red Sox55507.5
    Rays53519.0
    Orioles455816.5
    AL Central
    Tigers60450.0
    Guardians51517.5
    Twins50539.0
    Royals50539.0
    White Sox386621.5
    AL West
    Astros60440.0
    Mariners55495.0
    Rangers54506.0
    Angels505410.0
    Athletics446217.0
    NL East
    Mets60440.0
    Phillies59440.5
    Marlins495310.0
    Braves445815.0
    Nationals416218.5
    NL Central
    Brewers61420.0
    Cubs60431.0
    Reds54507.5
    Cardinals54518.0
    Pirates426219.5
    NL West
    Dodgers61430.0
    Padres55496.0
    Giants54507.0
    D-backs515310.0
    Rockies277633.5
  • Leaders
    Major League Leaders
    Batting: 2025, 2024, 2023, 2022, 2021, Career
    Pitching: 2025, 2024, 2023, 2022, 2021, Career
    Fielding: 2025, 2024, 2023, 2022, 2021, Career
    Major League Leaders - Rank
    Batting: Ranking Grid, Compare Players, Compare Stats
    Pitching: Ranking Grid, Compare Players, Compare Stats
    Splits Leaderboards
    Pitch-Type Splits Leaderboards
    Season Stat Grid

    Postseason Leaders
    Batting: 2024, (WS), (LCS), (LDS), (WCS), Career
    Pitching: 2024, (WS), (LCS), (LDS), (WCS), Career

    Spring Training Leaders
    Batting: 2025, 2024, 2023
    Pitching: 2025, 2024, 2023

    KBO Leaders
    Batting, Pitching
    NPB Leaders
    Batting, Pitching

    Minor League Leaders
    AAA: International League, Pacific Coast League
    AA: Eastern League, Southern League, Texas League
    A+: Midwest League, South Atlantic League, Northwest League
    A: California League, Carolina League, Florida State League
    CPX: Arizona, Florida
    R: Dominican Summer League
    College Leaders
    Batting, Pitching

    WAR Tools
    Combined WAR Leaderboards
    WAR Graphs
    WPA Tools
    WPA Inquirer
    Rookie Leaders
    Batters 2025, Pitchers 2025
    Splits Leaders
    Batters: vs L, vs R, Home, Away
    Pitchers: vs L, vs R, Home, Away
  • Teams
    Team Batting Stats
    2025, 2024, 2023, 2022, 2021, 2020
    Team Pitching Stats
    2025, 2024, 2023, 2022, 2021, 2020
    Team WAR Totals (RoS)
    AL East
    Blue Jays  |  DC
    Orioles  |  DC
    Rays  |  DC
    Red Sox  |  DC
    Yankees  |  DC
    AL Central
    Guardians  |  DC
    Royals  |  DC
    Tigers  |  DC
    Twins  |  DC
    White Sox  |  DC
    AL West
    Angels  |  DC
    Astros  |  DC
    Athletics  |  DC
    Mariners  |  DC
    Rangers  |  DC
    NL East
    Braves  |  DC
    Marlins  |  DC
    Mets  |  DC
    Nationals  |  DC
    Phillies  |  DC
    NL Central
    Brewers  |  DC
    Cardinals  |  DC
    Cubs  |  DC
    Pirates  |  DC
    Reds  |  DC
    NL West
    D-backs  |  DC
    Dodgers  |  DC
    Giants  |  DC
    Padres  |  DC
    Rockies  |  DC
    Positional Depth Charts
    Batters: C, 1B, 2B, SS, 3B, LF, CF, RF, DH
    Pitchers: SP, RP
  • RosterResource
    Current Depth Charts
    AL East
    Blue Jays
    Orioles
    Rays
    Red Sox
    Yankees
    AL Central
    Guardians
    Royals
    Tigers
    Twins
    White Sox
    AL West
    Angels
    Astros
    Athletics
    Mariners
    Rangers
    NL East
    Braves
    Marlins
    Mets
    Nationals
    Phillies
    NL Central
    Brewers
    Cardinals
    Cubs
    Pirates
    Reds
    NL West
    D-backs
    Dodgers
    Giants
    Padres
    Rockies
    In-Season Tools
    2025 Closer Depth Chart
    2025 Injury Report
    2025 Payroll Pages
    2025 Transaction Tracker
    2025 Schedule Grid
    2025 Probables Grid
    2025 Lineup Tracker
    2025 Minor League Power Rankings
    Offseason Tools
    2025 Free Agent Tracker
    2025 Offseason Tracker
    2025 Opening Day Tracker
  • Prospects
    Prospects Home
    The Board
    The Board: Scouting + Stats!
    How To Use The Board: A Tutorial
    Farm System Rankings

    Top Prospects List
    20252024
    AL
    BALCHWATH
    BOSCLEHOU
    NYYDETLAA
    TBRKCRSEA
    TORMINTEX
    NL
    ATLCHCARI
    MIACINCOL
    NYMMILLAD
    PHIPITSDP
    WSNSTLSFG
    2025 Preseason Top 100
  • Glossary
    Library
    Batting Stats
    wOBA, wRC+, ISO, K% & BB%, more...
    Pitching Stats
    FIP, xFIP, BABIP, K/9 & BB/9, more...
    Defensive Stats
    UZR Primer, DRS, FSR, TZ & TZL, more...
    More
    WAR, UBR Primer, WPA, LI, Clutch
    Guts!
    Seasonal Constants
    Park Factors
    Park Factors by Handedness
  • Sign In

The Near-Immediate Usefulness of Max EV

by Alex Chamberlain
October 30, 2020

Maximum exit velocity (max EV) measures a player’s hardest-hit ball, typically measured within a single season and compared against other players. Our Mike Podhorzer has documented its leaders and laggards. Rob Arthur, one of baseball’s best public analysts and whom I admire greatly, wrote intelligently on the importance of max EV as a projection-buster back in 2018. Max Freeze (real name) blends extremely hard hits (114+ mph) with launch angle to look for possible power breakouts ahead of 2020.

It has been established (by Al Melchior and me, in fact) that max EV, while an effective indicator, is not the or even a superior indicator of hitter power.

That’s not to say max EV is useless, by any means. It is altogether a different breed of metric than, say, barrel rate (Barrel%, either per plate appearance [PA] or per batted ball event [BBE]) or average exit velocity (EV), both to which fantasy baseball analysts refer much more often. The latter two, and many others, are rate metrics that need large sample sizes to become reliable — or, in common parlance, to “stabilize.” (More on that here, from our former and beloved Eno Sarris.)

Meanwhile, max EV is not a rate or average but a singular data point. It can happen at any moment in time — including the very first batted ball of a hitter’s season. This makes it an intriguing addition to the ol’ tool belt insofar as it could become “reliable” (not necessarily in the statistical sense) much sooner than would barrels or EV. Potentially, we could use max EV loosely as a leading indicator of where a hitter’s barrel rate, average EV, or even weighted on-base average on contact (wOBAcon) might eventually settle.

So: what are the merits of max EV?

As noted in the posts linked in the first paragraph, max EV is a second-tier Statcast metric in terms of its correlation with traditional measurements of power such as isolated power (ISO) or home runs per fly ball (HR/FB) as well as with advanced measurements of contact quality such as wOBAcon.

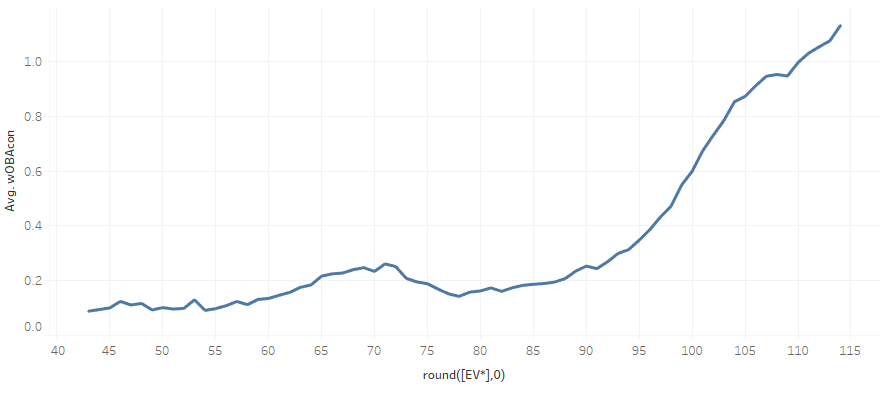
Despite its relative inferiority, you can still see strongly patterned trends between max EV and wOBAcon as well as other measurements of contact quality, including hard-hit rate (Hard% or HH%), which calculates the percentage of batted ball events that exceed 95 mph. The graph below shows how wOBAcon (red dotted line) and hard-hit rate (the blue line labeled “EV95+”) increase steadily with max EV.


Click to enlarge.

With each additional mile-per-hour of max EV, league-average wOBAcon increases by roughly 11 points and league-average Hard% increases by roughly 1.8 percentage points. Keep in mind, these are league-average values. Player performance naturally varies based on myriad other factors. Max EV is but one piece of a much larger puzzle that solves for a hitter’s contact quality. But contact quality still depends on many other things — most critically, launch angle. (Looking at you, Vladimir Guerrero Jr. and Yandy Díaz, patron saints of beefy boy grounders.) But that’s another issue for another day.

I also graphed lines for every whole-number exit velocity threshold from 95 mph to 105 mph, all of which, interestingly enough (to me, at least) appear to run parallel with one another. This suggests that all exit velocity thresholds, like Hard%, increase by 1.5 to 2 percentage points with each additional mile-per-hour of max EV. (For example, if the average hitter improves his max EV from 108 mph to 110 mph, we can expect his hard-hit rate to increase from 35.1% to 38.1% — and his percentage of balls hit 105+ mph to increase from 4.5% to 7.9%.)

This takeaway is especially important because exit velocity is especially important! Increased exit velocity means improved contact quality means increased probability of superior production on balls in play. The graph below shows how the league-average wOBAcon skyrockets on batted balls in excess of 95 mph. (The X-axis is exit velocity, and the Y-axis is league-average wOBAcon.)


Click to enlarge.

In addition to a scenario in which a hitter simply improves his max EV from one year to another, let’s say a hitter establishes his max EV early in a season, but his other metrics — wOBAcon, Hard%, Barrel%, average EV, etc. — lag behind and/or have not yet become reliable because the sample is too small.

For example, let’s say I, very proficient baseball hitter, hit a ball 110 mph on my very first batted ball of the season. On average, a hitter who maxes out at 110 mph achieves a hard-hit rate of 38% and a .397 wOBAcon. However, despite this spectacular singular event, I could only muster a 31% hard-hit rate and .349 wOBAcon (the league-average values for a max EV of 106 mph) through the end of April. We know one month is hardly enough time to evaluate a player’s performance. Has my max EV already alerted us to forthcoming improvement?

The big question upon which all of this assessment hinges (of course I’ve managed to bury the lede again) is: when does a hitter typically achieve his max EV?

Trying to pin down the exact moment a hitter achieves his max EV for the season seems dubious and, above all, somewhat arbitrary. However, if we relax expectations a bit, we can look for batted balls that very closely mimic a hitter’s max EV without identifying the exact moment he achieves his max EV. Most importantly, the threshold remains not only unique but also dynamic for every hitter.

With this in mind, I reframed the question: when does a hitter typically achieve 98% of his max EV? (To be clear: any batted ball that’s 98% of max EV or better, which therefore includes max EV itself).

I limited my observations to all 694 hitters who compiled at least 250 BBE during the 2017 through 2019 seasons. (No hitters compiled 250+ BBE in 2020, hence its omission.) In 2019, the average hitter amassed 4.26 plate appearances and 2.84 batted balls per game; I will use this as shorthand for ease of mental math below. The results of my research:

  • 90% eclipsed their 98% threshold by their 150th BBE (game 53).
  • 80% … by their 100th BBE (game 35).
  • (Per Sarris, average EV stabilizes around 80 BBEs: “what’s happening after 80+ balls in play for a player explains about half of what will happen on their future balls in play” — with emphasis on half).
  • 70% … by their 65th BBE (game 23).
  • 60% … by their 50th BBE (game 18).
  • 50% … by their 35th BBE (game 12).
  • 20% … by their 10th BBE (game 4).

Again, to emphasize a point: this doesn’t mean XX% of hitters achieved their actual max EV by game Y of the season — just that those hitters came within swinging distance (no pun intended) of their max EV, close enough to give us an idea of what they’re capable of. (Max EV can only increase, so, if anything, the 98%-threshold exercise might lead us to underestimate a hitter’s potential. That’s not necessarily bad!)

For reference, Marcus Semien (and several other A’s hitters) amassed his 35th BBE in the team’s 12th game — and in just his 50th plate appearance — of the 2019 season, consistent with my back-of-the-envelope arithmetic. Incidentally, he eclipsed the fabled 98% threshold on his 52nd ball in play — just four games later. Sixteen games into the Athletics’ season, he had a .378 wOBAcon but only a .323 expected wOBAcon (xwOBAcon). In other words, Semien achieved solid outcomes but without commensurate contact quality to support it.

If you were living and dying by xStats, you might have wagered Semien had been lucky, that he was due to backslide in the coming weeks. You’d have been wrong: Semien finished the season with not only a .391 wOBAcon — better than his first 16 games, albeit not substantially — but also a .384 xwOBAcon that fully validated his actual performance. In this instance, it appears that max EV helpfully anticipated better contact quality to come from Semien.

It’s entirely anecdotal, of course, but it (Semien’s example) makes me think this (gesturing wildly at max EV) could be helpful!

There are two large caveats in all of this:

  1. As previously noted, not all hitters will perform according to the graph above because not all hitters are exactly league-average.
  2. It’s impossible to know who will eclipse his 98% threshold when.

Regarding the latter, Aaron Altherr 알테어 eclipsed his 98% threshold on his very first batted ball of the 2017 season; now he’s playing in the KBO. José Abreu was one of 2019’s latest bloomers, failing to eclipse his 98% threshold until the season’s final month.

Abreu’s narrative deserves its own case study. I interpret it optimistically: Abreu was not a late bloomer as much as he was a legitimate breakout whose base skills improved, sustainably, as 2019 concluded. In fact, his improvement was so substantial that it arguably laid the foundation for his MVP-caliber 2020 performance:

the blue line depicts josé abreu's previous best 60-game rolling avg EV before 2020. he touched that peak a few times—sometimes within a season, sometimes at the end of one season into another

abreu began to consistently obliterate that peak starting in late-2019 and into 2020 pic.twitter.com/H42FCZxrnn

— Alex "Oxlade" Chamberlain (@DolphHauldhagen) October 29, 2020

A 60-game rolling average of Abreu’s exit velocity reached new levels in 2020, building upon improved performance in late-2019. It’s possible that looking at Abreu’s late-season, new-career-best max EV could have alerted us to his 2020 “breakout” (as much as a 3.5-WAR player can further break out) in which he established additional career-bests in barrels (14.3%), hard hits (53.3%), and average EV (92.9 mph), among other superlatives.

Anyway, certainly there’s more to be researched than what I’ve compiled here. In terms of major takeaways, I think max EV’s utility comes not from its absolute relationship with power and contact quality (which is weaker than other metrics) but, instead, from how quickly we can use it in-season in place of other superior metrics that are not yet reliable.

In short, perhaps max EV should be the first thing any of us take seriously in a baseball season’s early stages — historically, nearly 80% of healthy, full-time hitters have shown us their worth by the end of April. And I would look for hitters like Abreu, who, in September 2019, suddenly set a new personal-best max EV by more than 2 mph. These things don’t mean nothing, folks!


The Sleeper and the Bust Episode: 861 – Early 1B Preview
 
2020 Review: Surprising Average Fly Ball Distance Leaders

Two-time FSWA award winner, including 2018 Baseball Writer of the Year, and 8-time award finalist. Featured in Lindy's magazine (2018, 2019), Rotowire magazine (2021), and Baseball Prospectus (2022, 2023, 2024, 2025). Biased toward a nicely rolled baseball pant.

7 Comments
Oldest
Newest Most Voted
Inline Feedbacks
View all comments
TheGarrettCooperFanClub
4 years ago

This is great, thanks Alex!

8
In this article...
Marcus Semien
PAOBPISOwRC+WAR
429.305.138891.8

Regular Features

  • Mining the News

    A daily compilation of baseball news and analysis.
  • The Sleeper and The Bust Podcast

    Paul Sporer and Justin Mason lead the RotoGraphs staff in a daily fantasy baseball podcast.
  • Beat the Shift Podcast

    Ariel Cohen and Reuven Guy bring their analytical approach to fantasy baseball.
  • ADP Market Watch

    Offseason analysis of the NFBC Average Draft Position market for fall and winter drafts.
  • LEAGUE CLASSIFIEDS

    Fill your league with Rotographs Community Members.
  • Bullpen Report

    Detailed daily updates and charts on every bullpen in the Major Leagues to help you manage your saves and holds.
  • Bold Predictions

    The Rotographs staffs puts forward their best longshot predictions for the season.
  • Projecting X

    Mike Podhorzer’s projection analysis profiles, reviews, and deep-dives.
  • Ottoneu Strategy

    Strategy for the year-round FanGraphs Fantasy game.
  • Roto Riteup

    The most roto-relevant news of the previous day, recapped in a concise format for your morning coffee.

2025 Fantasy Rankings

C

-

1B

-

2B

-

SS

-

3B

-

OF

-

Top 200

SP

-

RP


Ottoneu Rankings

C

-

1B

-

MI

-

3B

-

OF

SP


Industry Awards

  •  •  2024 NFBC Super ($20K)
  •  •  2024 NFBC Super ($18K)
  •  •  2024 NFBC Auction Championship
  •  •  2024 TGFBI Overall
  •  •  2024 Tout Wars AL ($20K)
  •  •  2023 NFBC Super ($20K)
  •  •  2021 Tout Wars Mixed Auction
  •  •  2021 TGFBI League
  •  •  2021 NFBC Main Event
  •  •  2020 Tout Wars HTH
  •  •  2020 LABR Mixed Auction
  •  •  2017 Tout Wars Mixed Auction
  •  •  2017 Tout Wars AL
  •  •  2016 Tout Wars H2H
  •  •  2013 Tout Mixed Draft

    The Sleeper and the Bust Episode: 1438 – 2-Start Pitchers for Week 19
    7/25 – Paul Sporer
    Lineup Analysis (7/27/25)
    7/25 – Jeff Zimmerman
    Pitcher Playing Time Changes: July 25, 2025
    7/25 – Jon Becker
    Beat the Shift Podcast – Mid-Season Episode w/ Ray Murphy
    7/25 – Ariel Cohen
    Ottoneu Starting Pitching Planner: July 28–August 3
    7/25 – Jake Mailhot
    The Sleeper and the Bust Episode: 1437 – Batter Rebounds to Believe In
    7/25 – Paul Sporer
    Starting Pitcher Chart – July 25th, 2025
    7/24 – Paul Sporer
     
    3
    Midseason 3B Rank Assessment
    7/24 – Lucas Kelly
     
    4
    Paul Sporer's Baseball Chat - July 23rd, 2025
    7/23 – Paul Sporer
    Position Player Playing Time Changes: July 23, 2025
    7/23 – Jon Becker
     
    2
    Ottoneu Hot Right Now: July 23, 2025
    7/23 – Lucas Kelly
    Roto Riteup: July 23, 2025
    7/23 – Justin Mason
  • Alex Chamberlain
    Post Count: 305
  • Ariel Cohen
    Post Count: 263
  • Chad Young
    Post Count: 445
  • Jake Mailhot
    Post Count: 142
  • Jeff Zimmerman
    Post Count: 2309
  • Jon Becker
    Post Count: 226
  • Jordan Rosenblum
    Post Count: 18
  • Justin Mason
    Post Count: 1137
  • Lucas Kelly
    Post Count: 394
  • Mike Podhorzer
    Post Count: 2520
  • Paul Sporer
    Post Count: 2648
  • 2025 Rankings
  • Auction
  • Beat the Shift
  • Bold Predictions
  • Catchers
  • Chat
  • Draft
  • Dynasty
  • FAAB
  • Featured
  • First Base
  • Head to Head
  • Hitters
  • Injuries
  • Keeper Strategy
  • LABR
  • Lineups
  • Links
  • Market Watch
  • Meta Analysis
  • Mining the News
  • NFBC
  • Ottoneu
  • Outfielders
  • Podcast - The Sleeper and the Bust
  • Projections
  • Prospects
  • Rankings
  • Relief Pitchers
  • Roto
  • Roto Riteup
  • Second Base
  • Shortstops
  • SP Chart
  • Starting Pitchers
  • Statcast
  • Strategy
  • Streamers
  • Third Base
  • Tout Wars
  • Trades
  • Uncategorized
  • Waiver Wire
You are going to send email to

Move Comment

Updated: Thursday, July 24, 2025 6:00 AM ETUpdated: 7/24/2025 6:00 AM ET
@fangraphs - Contact Us - Advertise - Terms of Service - Privacy Policy
sis_logo
All major league baseball data including pitch type, velocity, batted ball location, and play-by-play data provided by Sports Info Solutions.
mlb logo
Major League and Minor League Baseball data provided by Major League Baseball.
Mitchel Lichtman
All UZR (ultimate zone rating) calculations are provided courtesy of Mitchel Lichtman.
TangoTiger.com
All Win Expectancy, Leverage Index, Run Expectancy, and Fans Scouting Report data licenced from TangoTiger.com
Retrosheet.org
Play-by-play data prior to 2002 was obtained free of charge from and is copyrighted by Retrosheet.

Support FanGraphs
Become a Member

Please consider becoming a FanGraphs Member. All the great work that you've come to rely on is made possible by Member support, including analysis, stats, projections, RosterResource, prospect coverage, and podcasts.

Membership starts at $.16 a day.

Already a Member: Log In

Sign Me Up