The Catcher Positional Adjustment Using Z-Scores
Introduction:
The catcher position in 2019 is the weakest offensive position in our beloved fantasy baseball competition. It is no secret. Every reasonably astute or semi-intelligent fantasy player is aware of this phenomenon. The more experienced competitor is also cognizant that the position has been getting even weaker over the past few seasons.
Unlike the middle infield positions which I have discussed here, it is clear that the catcher player pool demands a correction to account for “positional scarcity.” A boost is required to the otherwise dreadfully low values that the position would manufacture on its own.
This may be elementary to some, but the idea is as follows:
| Catcher Rank | Auction Value |
|---|---|
| 1 | 13.8 |
| 2 | 12.5 |
| 3 | 9.1 |
| 4 | 6.7 |
| 5 | 5.9 |
| 6 | 5.2 |
| 7 | 4.4 |
| 8 | 2.7 |
| 9 | 0.0 |
| 10 | -0.5 |
| . | . |
| 15 | -2.7 |
| 20 | -4.3 |
| 25 | -5.4 |
| 30 | -7.5 |
| 35 | -9.9 |
Using the current ATC Projections with my personal auction valuation method (a Z-Score method similar to the FanGraphs’ Auction Calculator) – the above auction prices represent what a catcher would be valued at assuming that we didn’t make any corrections to offensive positions, i.e. no positional adjustments. I assumed standard NFBC league settings [15 team, 5×5 mixed roto, 9 P, 14 H as per NFBC rules, which include 2 catchers].
In an NFBC auction, each team must select two starting catchers. The math works out so that with 15 teams, there must be a total of at least 30 starting catchers selected.
The 20th catcher, according to the above, is worth -$4.3. That is, someone should pay you $4.3 to take him off of their hands! Obviously, one cannot buy a player at an auction for -$4.3, yet someone must buy the 20th ranked catcher at a price of at least $1.
It is about marginal value. It is about the privilege not to roster the 30th best catcher. The catcher valued at -$4.3, is still $3.2 better than the 30th catcher valued at -$7.5. That dreadful (30th ranked) catcher still has to be … unfortunately … purchased by someone for $1.
One very simple “back of the envelop” method to adjust catcher prices would be to set the 30th ranked catcher to be valued at $1, and to price all other catchers by adding $1 to their marginal cost above #30.
| Catcher Rank | Initial Auction Value | Adjustment | Adjusted Auction Value |
|---|---|---|---|
| 1 | 13.8 | 8.5 | 22.3 |
| 2 | 12.5 | 8.5 | 21.0 |
| 3 | 9.1 | 8.5 | 17.6 |
| 4 | 6.7 | 8.5 | 15.2 |
| 5 | 5.9 | 8.5 | 14.4 |
| 6 | 5.2 | 8.5 | 13.7 |
| 7 | 4.4 | 8.5 | 12.9 |
| 8 | 2.7 | 8.5 | 11.2 |
| 9 | 0.0 | 8.5 | 8.5 |
| 10 | -0.5 | 8.5 | 8.0 |
| . | . | . | . |
| 15 | -2.7 | 8.5 | 5.8 |
| 20 | -4.3 | 8.5 | 4.2 |
| 25 | -5.4 | 8.5 | 3.1 |
| 30 | -7.5 | 8.5 | 1.0 |
| 35 | -9.9 | 8.5 | -1.4 |
Since the 30th ranked catcher was valued at -$7.5, this simplistic correction adds $8.5 to all catchers. This quick procedure is a bit more elementary than the theoretical way to do it – but it isn’t that far off. It is certainly a method.
Z-Scores:
A bit of background on general auction valuation by the Z-Score method:
Z-Scores, often referred to as standard scores, are the kernel of a widely popular auction valuation method for fantasy. The heart of its engine calculates the following value for each player, by scoring statistic.
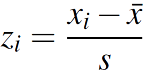
Where: Z[i] = Player i’s Z-Score; X[i] = Player i’s Category Stat; X-Bar = Average Stat for the category; S = Standard Deviation for that category.
To calculate your player/category’s Z-Score: Take your player’s stat, subtract the average stat, and divide by the standard deviation across the player pool for the stat. Repeat for all scoring categories – and add them up to get a total Z-Score.
Let’s look at an example of what the calculation of total Z-Score looks like. Let’s assume a standard 5×5 roto contest for 3 teams only, each having to select 1 catcher apiece.
| Catcher | Z[HR] | Z[R] | Z[RBI] | Z[SB] | Z[BA] | Z[Total] | Adjust | Z-Adj. |
|---|---|---|---|---|---|---|---|---|
| Justin Collette | -0.3 | 1.2 | 0.6 | 3.1 | -0.2 | 4.4 | 1.2 | 5.6 |
| Paul Mason | 1.2 | 1.5 | 1.8 | -1.2 | -0.6 | 2.7 | 1.2 | 3.9 |
| Pike Modhorzer | -0.9 | 0.4 | 0.3 | -1.3 | 0.3 | -1.2 | 1.2 | 0.0 |
| Jason Sporer | -1.2 | -0.7 | -0.6 | 0.1 | -0.9 | -3.3 | 1.2 | -2.1 |
Justin Collette here is the best player of this fictitious set, with Jason Sporer as the worst.
The key to adjusting catcher valuations begins with assessing the total Z-Score of the lowest ranked [starting] catcher that must be selected. The term for the “lowest catcher that must be taken” – is the replacement level catcher. That player here is, Pike Modhorzer.
Modhorzer, the 3rd best catcher – sets the replacement level at a Z-Score of -1.2. The theoretical Z-Score adjustment to make [along the lines of the adjustment in the introduction], would be to add 1.2 to all catchers, thereby setting the adjusted Z-Score of the replacement level catcher to zero.
Without getting into the math [which Zach Sanders explains in a 2011 post found here], the adjusted Z-Scores are then converted into auction dollars – with an adjusted Z-Score of 0 becoming a $1 player.
Historical Catcher Z-Score Trend:
I mentioned above that the catcher position has become exceedingly weaker in recent years. This is evident in the following chart:

The figures in the body of the chart represent the historical Z-Score levels for replacement level catchers, for various league types/settings. The table was calculated using final MLB stats for prior years, current ATC Projections for the 2019 season, and a Z-Score based method of valuation.
League Formats:
- NFBC – National Fantasy Baseball Championship – 15 Team leagues with 14 hitting slots, of which 2 are catchers.
- TGFBI – The Great Fantasy Baseball Invitational – Although the contest in 2019 will be aligning itself with the NFBC format, last year’s game featured 15 Team leagues with 14 hitting slots, of which 1 was a catcher.
- RTS – RealTime Sports – Leagues have 10 teams, 14 hitting slots, of which 2 are catchers.
- HOME – Home League – A home league that I play in which features 10 teams, 14 hitting slots, but only 1 catcher.
Glance at the progression of values in NFBC from 2016 to 2018. The replacement level declined from -6.33 to -6.26 to -6.71. The HOME league similarly sunk from -4.60 in 2016 to -5.43 in 2018. That is quite a change.
For 2019, ATC projections are indicating that the slide will continue. The HOME league, for example, is showing a horrific -6.97 replacement level, a 1.5 drop from 2018. Seven standard deviations below average [in the aggregate] is atrocious.
My colleague Jeff Zimmerman, similarly pointed out the dreadfulness of the catcher position in a recent article entitled “Catchers … What a Dumpster Fire.”
All of this would suggest a sizeable adjustment for catchers. At an auction/draft table – we always observe a hike in catchers’ prices, but we don’t always exhibit it to such an extraordinary level.
Adjusting Catcher Values:
So, what is the appropriate adjustment to make for catchers?
There is no perfect answer to the question above. The experts do not fully agree. Most fantasy players tend to apply a heavy adjustment. Earlier this winter, I had a conversation on Twitter with Razzball’s Rudy Gamble who suggested that there shouldn’t be much of an adjustment at all.
The basic options are as follows. Should we:
- Adjust the catcher auction values fully to set the lowest ranked starting catcher at $1? [We would do this by the fundamental process described above]
- Make no positional adjustments, and leave the catcher values alone? [Most will be purchasing a catcher valued negatively]
- Do something in the middle? If so – what?
I believe that in theory, it shouldn’t matter. Optically, we are best generating prices somewhere in the middle to help discover draft bargains.
Let’s look at what the market paid for catchers last year, in comparison to our adjustment options [after converting Z-Scores to Dollars]. For 2018 market value, we will use an average auction value (AAV) from a set of actual NFBC online auctions which Todd Zola of Mastersball had provided.
| (A) | (B) | (C) | |
|---|---|---|---|
| Catcher Rank | Full Adjustment | Market Pricing | No Adjustment |
| 1 | 29.3 | 31.5 | 18.8 |
| 2 | 23.1 | 23.0 | 12.9 |
| 3 | 22.1 | 20.6 | 12.1 |
| 4 | 17.3 | 15.9 | 7.5 |
| 5 | 15.7 | 13.8 | 6.0 |
| 6 | 15.1 | 10.6 | 5.4 |
| 7 | 12.4 | 9.8 | 2.7 |
| 8 | 12.2 | 9.6 | 2.6 |
| 9 | 12.1 | 8.2 | 2.6 |
| 10 | 10.1 | 6.7 | 0.8 |
| . | . | . | . |
| 15 | 7.3 | 3.9 | -2.0 |
| 20 | 4.6 | 2.3 | -4.5 |
| 25 | 2.5 | 1.0 | -6.5 |
| 30 | 1.0 | 0.3 | -8.0 |
| 35 | -1.2 | 0.0 | -9.9 |
| Replacement Level Z-Score | -6.43 | -3.92 |
Perspectives above:
A) Full formulaic Z-Score catcher replacement level adjustment.
B) The Average Auction Values in 2018 for catchers.
C) No positional adjustments.
Other than the top catcher, you can see that the market did not pay the fully adjusted price. Had you valued players as in (A), you would consider buying two expensive catchers, because catchers appear as large bargains. Had you valued players as in (C), you wouldn’t want to spend any money on catchers. Both approaches are extreme and are flawed.
To find the catchers generating the greatest relative discounts, one should value catchers akin to the way the market does. Only then, can you realize which are undervalued. Setting a similar perceived optic can lead to the capitalization of a present market inefficiency.
So how do we configure this?
The method that I am suggesting today involves setting the appropriate replacement level Z-Score. In the above, the “No adjustment” replacement level was -3.92. The “Full adjustment” level was -6.43. There is some Z-Score value that is more appropriate, given the observed market curve.
| Catcher Rank | 2018 AAV | Full Adjustment | Final 2017 | AVG 2015-2017 | AVG 2014-2017 | Final 2014 | No Adjustment | |
|---|---|---|---|---|---|---|---|---|
| 1 | 31.5 | 29.3 | 28.8 | 28.6 | 28.2 | 26.5 | 18.8 | |
| 2 | 23.0 | 23.1 | 22.5 | 22.3 | 21.9 | 20.1 | 12.9 | |
| 3 | 20.6 | 22.1 | 21.5 | 21.3 | 20.9 | 19.0 | 12.1 | |
| 4 | 15.9 | 17.3 | 16.7 | 16.5 | 16.0 | 14.1 | 7.5 | |
| 5 | 13.8 | 15.7 | 15.1 | 14.8 | 14.4 | 12.3 | 6.0 | |
| 6 | 10.6 | 15.1 | 14.5 | 14.3 | 13.8 | 11.9 | 5.4 | |
| 7 | 9.8 | 12.4 | 11.7 | 11.5 | 11.0 | 8.9 | 2.7 | |
| 8 | 9.6 | 12.2 | 11.5 | 11.3 | 10.8 | 8.8 | 2.6 | |
| 9 | 8.2 | 12.1 | 11.5 | 11.3 | 10.8 | 8.7 | 2.6 | |
| 10 | 6.7 | 10.1 | 9.5 | 9.2 | 8.7 | 6.7 | 0.8 | |
| . | . | . | . | . | . | . | . | |
| 15 | 3.9 | 7.3 | 6.6 | 6.3 | 5.8 | 3.7 | -2.0 | |
| 20 | 2.3 | 4.6 | 3.9 | 3.6 | 3.1 | 0.9 | -4.5 | |
| 25 | 1.0 | 2.5 | 1.8 | 1.5 | 1.0 | -1.2 | -6.5 | |
| 30 | 0.3 | 1.0 | 0.2 | 0.0 | -0.6 | -2.9 | -8.0 | |
| 35 | 0.0 | -1.2 | -1.9 | -2.2 | -2.7 | -5.0 | -9.9 | |
| Repl. Level Z-Score | -6.43 | -6.26 | -6.22 | -6.08 | -5.63 | -3.92 |
Above are computed auction dollars calculated using a variety of underlying historical Z-Score adjustments. 2017’s replacement level was at -6.26, while back in 2014 it was -5.63 [we saw the magnitude of the historical slide above].
Which curve should we select?
At the very top, market prices are best fit by the fully adjusted curve. The next few catchers are fit best by the 4-year historical average Z-Scores. The bottom of the curve is fit best by something in between the 4-year average, and the year 2014 curve.
The takeaway here, is that the historical catcher replacement levels provide a better fit to the market than the fully adjusted Z-Score method. Although the 4-year average curve fits best overall, I suggest to use the 3-year average one. With the 2017 Z-Score close to the 3-year average, we can see that replacement levels have somewhat stabilized. The 4-year average contains the 2014 season, which was considerably stronger for catchers, and an outlier for our going-forward purposes.
The next step would be to use the -6.22 implied replacement level Z-Score for the catcher adjustment, and subsequently converting to auction dollars. Had we applied this suggested adjustment in 2018 – on average, we would have yielded catcher values approximately $1 lower than the fully adjusted method [and about $8.5 higher than no adjustment].
2019 Adjusted Catcher Values:
It is yet too early to fully see how NFBC players are pricing catchers. For now, let’s apply what we have learned to the projected 2019 catcher pool:
| Catcher Rank | Selected Auction Values | Full Adjustment | No Adjustment | |
|---|---|---|---|---|
| 1 | 21.5 | 23.6 | 13.8 | |
| 2 | 20.2 | 22.5 | 12.5 | |
| 3 | 16.4 | 18.7 | 9.1 | |
| 4 | 14.0 | 16.4 | 6.7 | |
| 5 | 13.1 | 15.6 | 5.9 | |
| 6 | 12.0 | 14.4 | 5.2 | |
| 7 | 11.3 | 13.8 | 4.4 | |
| 8 | 9.6 | 12.2 | 2.7 | |
| 9 | 6.5 | 9.1 | 0.0 | |
| 10 | 6.0 | 8.6 | -0.5 | |
| . | . | . | . | |
| 15 | 3.6 | 6.3 | -2.7 | |
| 20 | 1.9 | 4.7 | -4.3 | |
| 25 | 0.6 | 3.4 | -5.4 | |
| 30 | -1.8 | 1.0 | -7.5 | |
| 35 | -4.2 | -1.2 | -9.9 | |
| Replacement Level Z-Score | -6.43 | -7.09 | -4.64 |
With catcher values plummeting further this year, the selected 3-Year average curve now provides something closer to a $2.5 difference to the fully adjusted Z-Score method [a $7 bump from unadjusted values]. That delta sounds reasonable to me; it jives with the fact that the catcher pool has deteriorated this year.
Rudy Gamble makes a smaller adjustment to catchers. Without going into his math, his catcher bump comes out to about $3 off of unadjusted values. Here is a brief summary for 2019:

I hope that you have found this discussion of adjusting the 2019 catcher values constructive and insightful. I am interested to hear your thoughts on both the method and results. What will you be using for your auctions/drafts this year?
Ariel is the 2019 FSWA Baseball Writer of the Year. Ariel is also the winner of the 2020 FSWA Baseball Article of the Year award. He is the creator of the ATC (Average Total Cost) Projection System. Ariel was ranked by FantasyPros as the #1 fantasy baseball expert in 2019. His ATC Projections were ranked as the #1 most accurate projection system over the past three years (2019-2021). Ariel also writes for CBS Sports, SportsLine, RotoBaller, and is the host of the Beat the Shift Podcast (@Beat_Shift_Pod). Ariel is a member of the inaugural Tout Wars Draft & Hold league, a member of the inaugural Mixed LABR Auction league and plays high stakes contests in the NFBC. Ariel is the 2020 Tout Wars Head to Head League Champion. Ariel Cohen is a fellow of the Casualty Actuarial Society (CAS) and the Society of Actuaries (SOA). He is a Vice President of Risk Management for a large international insurance and reinsurance company. Follow Ariel on Twitter at @ATCNY.
Very interesting. I want to make sure I am reading this correctly but by hedging the adjustment basically you are saying the top catchers won’t hit their projection? The 30th ranked catcher at EOS whoever it is, probably will achieve the same stats as whoever is projected as the 30th rated catcher in pre season. The difference is at the top- if Gary Sanchez reaches his projection he will clearly be worth a top 20 player because of how much better he is than number 30. In my SGP ranking Sanchez comes out as the #7 overall batter because he’s that much better than replacement if he reaches his projections.
Essentially how confident are you in the top catchers reaching their projections? Could be an interesting exercise
The catcher adjustment should be an approximation of the average of negative values of catchers ~25-30 because you’re not always stuck with #30 at a buck, you could get #25 at a buck.
There’s a bit more to this, but the catcher calculation is more of the following: 1. Value of the player (quantifiable) + 2. Catcher adjustment (quantifiable, as per the article) + 3. Free agent premium (not easily quantifiable) + 4. Injury risk cost (not easily quantifiable)
The second two also impact the valuation but are tougher to calculate. The free agent pool typically doesn’t have offensive catchers so that is a boost for guys like Sanchez and Realmuto, but if you were to have an injury like Schwarber in 2016 where you lose him for the year, the replacement player at catcher is so much worse than any other replacement player.
If you are adding money to catchers to make the adjustment, the you are adding more money to the pool. Doesn’t that money need to come out from somewhere else then (i.e. from the other positions)? So if you add $7 to every catcher (30 of them), that would be $210 extra in the auction pool. Then would you take a appropriate ratio out from every other non-catcher so that you take the $210 back out?
Yes. Whenever you bump up catchers, it comes out of the rest of the player pool (or the rest of the hitter pool, if you are targeting a H/P% split). The other players go down in price when you raise catcher values to balance the total dollars in play.
That’s what I do. That $210 works out to about $1 per hitter (on average, of course)
Interesting take. I am not so sure it is particularly applicable in one-catcher leagues, however, especially keeper leagues. For example, my main league is a 16-team, one-catcher, auction, keeper league. Realmuto and Sanchez are being kept. Without positional adjustment, the remaining catchers who will be taken (1-14), according to my program, have values between $9 and about -$4. That is a far lower spread between the best and the worst that will be drafted than any other position. The gap between each player is also lower, on average, than any other position. Therefore, my plan is to save my draft dollars for where they are more useful and just get a $1 catcher. After a few tactical tosses at the start, I’ll likely just toss the top catcher on my list (adjusted from values by my personal preferences) until I get one for $1 (if I don’t toss them, I’d have to either way until #14 or pay $2)–that way, either others are overpaying for $1 or less guys, or I get one of the better $1 or under guys.
I guess that is my thing with positional adjustments, they need to also take into account opportunity costs—paying more than value for catcher because of positional scarcity might mean losing out more at other positions. Now, in a two catcher league, that might be different, because catcher #30 is going to be significantly more ugly than catcher #16.
Yes, it is about opportunity cost to NOT be stuck with the last catcher. It is also about what the market is doing. 2 C leagues have a larger bump than 1 C leagues. The same methodology as described above still works. Use the replacement level Z-Score as calculated by the 3-year average actual replacement levels.
Your point more or less answers half of my point. I guess my second point is this: if the top two catchers are not available at all, and it is a one-catcher league, I don’t think that the premise of the article remains true—it is no longer clear that the catcher pool demands a positional scarcity adjustment. If the difference between the best catcher you can get and replacement level is lower at catcher than it is at any other position (which it can easily be when your choices are basically only different varieties of crap), I would think that catcher would not demand a positional scarcity adjustment and should not get one. Since a positional scarcity adjustment takes away from other positions, why do that when using the adjustment for catcher does not change the catcher outcome very much?
For example, in your own list, the unadjusted difference between catcher #3 and catcher #15 is only 11.8. I would think that the unadjusted difference between the best available and replacement level at any other position would be far greater. In that case, I would think that the smart play would be to put your money in the other positions because shorting the other positions (which you inherently do by bumping up catchers) could lead to a far great loss in results than 11.8, which is the absolute max you could lose at catcher by not adjusting.
This is pretty much what I do, except I wait a bit longer to start throwing out catchers because I usually start out by throwing out a bunch of closers. In one catcher leagues, I just can’t bring myself to spend $ on a catcher, mostly because of the heightened injury risk. Doing this, you never end up with the worst rated catcher and sometimes it’s amazing to watch a bidding war for the “last good” catcher, when in reality he’s worth $1-2.
Lots of people just choose not to roster a catcher and leave the spot empty — is that what negative z-scores imply? That they are “below replacement” level and thus shouldn’t even be rostered let alone played?
Or is this a whole different analysis to examine how bad a player has to be at a position before they hurt your 5×5 Roto cats via average?
I treat valuation of catchers by putting a theoretical value on them, and then looking to see how it lines up with what people are actually paying. As you say, usually it means you’ve adjusted catchers too far. So, I adjust it down until they start to align and the “profitability” of the average catcher is roughly $0. In general I’ll spend more than the average team on catchers though because as you note, the theoretical bump in value should be higher than what actually happens, so by funneling more money toward them, I’m getting a bargain on surplus value relative to what the actual team spends.