The Biggest Hitter K% Outliers of 2018

Yesterday, I devised a new expected strikeout rate for pitchers and used it to identify qualified starting pitchers who over- or under-performed in 2018. I’m reluctant to make out the exercise to be more than it is. I simply wanted to take the most intuitive approach to describing a pitcher’s strikeout rate (K%): by using the plate discipline exhibited by opposing hitters. Today, I seek to do the same for hitters. I can tell you now the discussion will be much more qualitative than quantitative.
But let’s start with the nitty gritty. I broke down a hitter’s plate discipline into its component pitch outcomes:
- Swing and miss in the zone: Zone% * Z-Swing% * (1 — Z-Contact%)
- Swing plus contact in the zone: Zone% * Z-Swing% * Z-Contact%
- Swing and miss outside the zone: (1 — Zone%) * O-Swing% * (1 — O-Contact%)
- Swing plus contact outside the zone: (1 — Zone%) * O-Swing% * O-Contact%
- No swing, in the zone: Zone% * (1 — Z-Swing%)
- No swing, outside the zone: (1 — Zone%) * (1 — O-Swing%)
Those components, when regressed against a hitter’s strikeout rate, produce a 0.84 adjusted r2. This is superior to the xK% metric Mike Podhorzer produced nearly half a decade ago, although only marginally (0.81 adjusted r2). The improvement is minimal, primarily because Pod’s equation used many of the same elements as mine. All I did differently was include each outcome type and scale them to the same denominator. Fundamentally, you could still use Pod’s equation and be absolutely fine. I just wanted to replicate the regression equation I specified for pitchers.
Unfortunately, the initial results weren’t worth sharing. Hitters are in (almost) complete control of when during a plate appearance they will swing, whereas pitchers have no such control over the hitter. Sure, a pitcher can maximize the likelihood that a hitter might swing and miss, but he can’t force the hitter to take the bat off his shoulder. (Every pitcher sees hitters from all walks of life: aggressive hitters, passive hitters, contact-oriented hitters, contact-disoriented hitters — and varying combinations of the two spectra. Over the course of the season, one could reasonably expect the average hitter to have been of average aggression and have average contact skills — and, therefore, any deviations from average can be attributed directly to the pitcher.)
This creates two wrinkles:
- Using the same model specification as I did in yesterday’s post fails to capture each hitter’s selective aggression.
- Some hitters are more likely to over- or under-perform their expected strikeout rates because of their selective aggression.
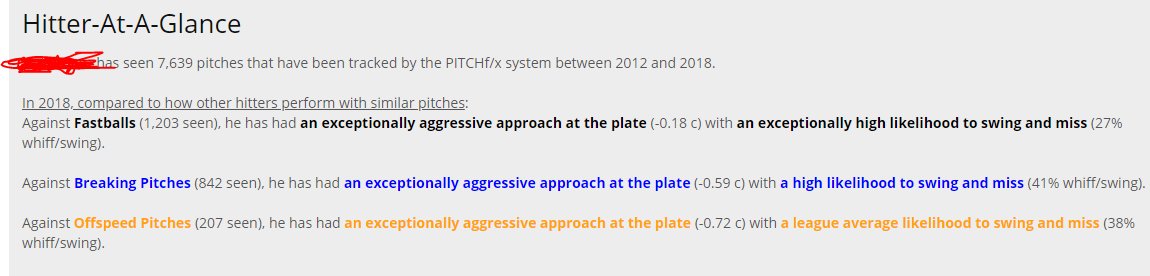
Consider Javier Baez. His actual strikeout rate is 2.4 percentage points lower than his expected strikeout rate, good for the 14th-best difference among 140 qualified hitters in 2018. Baez is the quintessential embodiment of this theme:
(click to enlarge)
That description, courtesy of Brooks Baseball, is terrifying. Yet it’s possible Baez keeps his strikeouts in check because of his aggression; if he were any more passive, the called strikes he would inevitably incur would reduce his margin for error when he does swing. To attest: he out-performed his expected strikeout rate by 3 percentage points in 2017.
Another over-performer, Mookie Betts is the antithesis of Baez: exceptionally passive and exceptionally contact-oriented. This combination of skills suggests he should have a much higher strikeout rate than he does; in fact, the margin by which his expected strikeout rate exceeds his actual strikeout rate ranks among the league’s best annually.
Among 2018’s worst under-performers, Scooter Gennett displays above-average aggression and contact skills, and Yoan Moncada shows below-average levels of each. Both hitters under-performed their strikeout rates by 3.7 and 6.4 percentage points, respectively.
Ultimately, plate discipline, on its own, tells most of the story but not nearly enough of it. Bad contact skills are not necessarily a death knell, especially when paired with aggression. Baez’s margin for error is razor-thin, but his aggression actually improves it, probably. (I touched on this same issue when I discussed Adalberto Mondesi’s viability in 2019, reluctant as I was to admit it.) My regression equation misses the sweet spot. It misses out on some kind of interaction between aggression and contact, and it misses out on exactly when during a plate appearance the aggression and contact are occurring.
So, to help further refine my estimates, I included in the model one more variable: pitches per plate appearance. On its own, pitches per plate appearance bears a moderate positive correlation with strikeout rate (r = +0.46), which suggests the deeper into a count a hitter gets, the more likely he is to strike out. (Can’t strike out on less than three pitches, ya know?) The resulting regression produces a 0.86 adjusted r2 — not significantly better But, just looking at the data, I can see huge changes for a handful of hitters of varying levels of aggression.
Regardless of which results I use, I must be much more discerning in my evaluation in light of certain hitters’ tendencies to consistently over-/under-perform. Accordingly, I have identified (using the good ol’ eyeballin’ method) a handful of hitters who discrepancies between their expected and actual strikeout rates varied much more differently than they have in previous years. Note that there’s a high probability I’m missing important hitters because they did not qualify for the batting title in previous seasons. I tried to order the following by luckiest or unluckiest within their respective sections (per my humble estimation).
- Over-performers:
- Odubel Herrera (-3.7% in 2018; +0.1% average from 2015-17)
- Travis Shaw (+0.5% in 2018; +4.0% average from 2016-17)
- Nick Markakis (-1.9% in 2018; +1.4% average from 2015-17)
- Salvador Perez (+1.0% in 2018; +3.1% average from 2015-17)
- Cody Dickerson (-1.6% in 2018; 0.0% average from 2016-17)
- Under-performers:
- Edwin Encarnacion (+1.0% in 2018; -3.1% average from 2015-17)
- Kyle Seager (+2.3% in 2018; -1.6% average from 2015-17)
- Paul Goldschmidt (+2.2% in 2018; -0.4% average from 2015-17)
- Evan Longoria (+2.3% in 2018; -0.4% average from 2015-17)
- Joey Votto (+1.1% in 2018; -1.3% average from 2015-17)
- Yangervis Solarte (+3.0% in 2018; +0.2% average during 2014-15, ’17)
- Asdrubal Cabrera (+2.6% in 2018; +0.4% average from 2015-17)
- Andrew McCutchen (+0.3% in 2018; -1.7% average from 2015-17)
- Charlie Blackmon (+1.9% in 2018; +0.4% average from 2015-17)
- Jose Abreu (-0.2% in 2018; -1.4% average from 2015-17)
- The jury is out, for now:
- Justin Smoak (+4.6% in 2018, +0.4% in 2017)
- Alex Bregman (-1.1% in 2018, +2.2% in 2017)
- Manuel Margot (-1.1% in 2018, +1.5% in 2017)
- Yuli Gurriel (+1.4% in 2018, -2.5% in 2017)
- Cody Bellinger (-2.1% in 2018, -0.3% in 2017)
It might surprise you to learn I actually omitted some of the prominent underachievers (as if I’m going to change your mind on Mike Trout and Betts, who, per this exercise, somehow got unlucky last year… good lord). I can briefly dissect each of the above hitters’ seasons, but I’d rather not. Allow me to simply call your attention to a few interesting names (in alphabetical order) whose stocks have taken a hit due to 2018 performance that did not live up to expectations and who I now feel more inclined to target:
- Encarnacion: Having never fallen outside the top 60 (by National Fantasy Baseball Championship average draft position, or NFBC ADP) and also having never finished worse than top-60 in any season, EE is currently staring down a ludicrous ADP of 119th overall. He’s entering his age-36 season, sure, but he’s still no worse than a break-even proposition at his current price, which is a pretty decent return on investment in a game where the average ROI is roughly -40%.
- Votto: …has never gone two straight seasons without being a top-50 player. Like Encarnacion, he’s getting old (35), so a bounceback is less of a guarantee than it might’ve been in previous years. But, also, Votto is an almost-unmatched hitting talent with longevity on his side thanks to elite plate discipline.
- Abreu: Despite his worst season since coming stateside, fantasy owners haven’t soured quite as strongly on Abreu as the previous two names. His ADP of 82 would be his worst since his debut, when no one knew exactly what to make of him. Assuming a return to good health, Abreu, like Encarnacion, is no worse than a break-even proposition.
- Seager: It doesn’t help that he not only failed to rebound after 2017’s disappointment but also got worse. However, it seems as though Seager suffered abysmal luck. His swinging strike rate (SwStr%) did increase substantially in 2018, so it’s not as if Seager’s poor performance is entirely undeserved. Still, there’s room for him to claw back two to three percentage points while rebounding via batting average on balls in play (BABIP). His current ADP of 232 almost matches his end-of-season rank from 2018. Even though he’s (just barely) on the wrong side of 30, it’s hard to imagine this year could be any worse than last. There’s good profit potential here.
- Goldschmidt: Rob Silver (formerly of 2016 NFBC Main Event champion fame, now of Baseball Prospectus fame) and I, as the kids say, “stanned hard” for Goldschmidt this year despite a very rough start to the year. After an awful first six weeks, Goldy went on an absolute tear to finish the season, producing a full-season 145 wRC+ that almost perfectly mirrored his career 144 mark. Even with midseason progress, his 25.1% strikeout rate was still the worst of his career. Turns out (to me, unsurprisingly) it might have all been extremely bad luck. (Aside: I saw an infographic last summer that said Goldschmidt had incurred the most called strikes on pitches outside the zone, but I can’t find it, so take my word on it. Thanks!) An ADP of 20th overall is, somehow, a decent price for Goldschmidt, especially considering he averaged 34.5 home runs each of the last two seasons — far better than the 27 homers Steamer projects him for now.
Ultimately, expected strikeout rate is much less useful for hitters than for pitchers. It does help identify regression candidates, but it takes a lot more legwork. It’s important to note acknowledge strikeout regression is but one of many moving parts; just because the players I outlined got unlucky in one facet of the game doesn’t preclude the fact they may have gotten lucky in others. I likely won’t pursue this specific form of this exercise again in the future, at least not publicly, but it’s nice to have some additional clarity.
Full caveat here that I am not nearly as well versed in statistics and data modeling as you are, so if my question is dumb please just let me know, lol. But:
Did you do something to compare these underperformers to the league-average baseline increase? K% went up 0.7% last year, which could go a decent ways toward explaining some of these changes.
Not a dumb question! I did not check, but my reasoning was: changes to the league K% each year are underpinned by changes to the league plate discipline. For example, swinging strike rate peaked in 2018 (as shown in link) as contact rates hit an all-time low. Ideally the league-wide trends bear out on an individual level as well (given the individuals, when aggregated, produce those league numbers). Therefore the relationship between strikeout rate and plate discipline remains constant and doesn’t need special controls from year to year (and therefore differences between K% and xK% remain consistent from year to year as well). Hope that makes sense, but let me know if not.