Archive for barrel

A Simple Fix for Barrels in 2021

Here is a disputed fact: MLB changed the ball. League brass, on the record, wanted to make the ball livelier but also raise the height of the seams, which would increase drag. The two changes — more bounce, but also more air resistance — would, more or less, offset each other.

The fact is disputed because some of the game’s most intelligent minds — namely, renowned baseball physicists, the very people most capable of determining if the ball is, indeed, different — doubt the ball has changed. It’s imperative I tell you this because they may be right, which would make me (and MLB, for the umpteenth time), well, wrong. Everything that follows assumes the ball has changed. Maybe this meshes with what you’ve witnessed, maybe it doesn’t. This is simply one stupid man’s interpretation of the data available to us thus far.

Early returns suggest MLB accomplished what it set out to accomplish. We can use weighted on-base average on contact (wOBAcon) to describe hitter production on balls in play, aka batted ball events (BBE). The average hitter is slightly less productive in 2021 than in past years, but not egregiously so, as shown below. Also, it’s only April; as the weather warms, so should be the bats. It’s reasonable to expect 2021’s league-wide wOBAcon value to climb a few ticks before year’s end.
Read the rest of this entry »


Blasts: A Subset of Barrels (Not the Same as Statcast Blasts)

Edit (5/13/24): Hi! Alex here, writing to you from the future. MLBAM just published swing data (it’ll be exciting, I promise you), and one of the marquee metrics for swings on Statcast is called a “Blast.” It has nothing to do with the Blasts herein. As far as I’m concerned, Statcast is the ledger of record, so I will brainstorm new terminology for this so it doesn’t create confusion… although changing the name of my metric might create confusion for the four people or whatever who use it. Anyway, just a PSA for y’all. These are not the same blasts!

I’ve heard (read) a lot of hullabaloo about “not all barrels are equal.” Hullabaloo or not, it’s true; although barrels capture exit velocity (EV) and launch angle (LA) combinations that produce optimal wOBAcon (weighted on-base average on contact) results, the Statcast metric is defined broadly enough to include absolute blasts alongside somewhat-pedestrian hard hits within the same grouping.

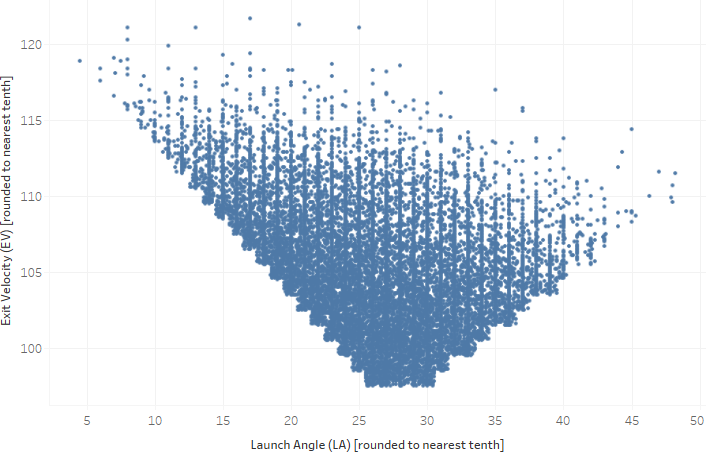
The algorithm used to classify barrels is not publicly available (edit: an anonymous tipster alerted me that it, indeed, is available! I think I reverse-engineered it correctly just by sight…), but one can reverse-engineer it easily enough. Here’s a plot of all barrels since the start of the 2017 season.

Given the scatterplot, the formula is most likely as follows:

if EV < 97.5 mph, then barrel = no
if LA > 25.5° and LA < 30.5°, then barrel = yes
if LA < 25.5° and (25.5 – LA) < (EV – 97.5), then barrel = yes
if LA > 30.5° and ((LA – 30.5) * 2) < ((EV – 97.5) * 3), then barrel = yes
if EV > 97.5 mph but none of these apply, then barrel = no

“Not all barrels are equal” takes on its meaning once you convert the above scatterplot to a heatmap. I set the low end of the color legend artificially high to show the contrast between barrels that are relatively productive versus those that are massively productive:

Read the rest of this entry »


Upgrading a Deserved Barrel%

New year, new deserved barrels metric. In October, I took a crack at devising a “deserved barrels” metric in which I took the basic components of a barrel — a hitter’s exit velocity (EV) and launch angle (LA) — and determined the capacity in which the components relate to Statcast’s barrel rate metric (barrels per batted ball event, or “Brls/BBE %” on Baseball Savant). I included squared terms (EV2, LA2) assuming the relationship is not linear. (A launch angle that’s too steep is detrimental, for example.)

Further offseason research led me to additional insights:

There exist many measures of contact quality; barrel rate captures how often a hitter produces high-quality contact. (Hard-hit rate functions similarly but ignores launch angle, to my knowledge, making barrel rate arguably superior.) It only made sense, then, that the latter finding above — that launch angle tightness matters to batted ball quality — should be incorporated into my deserved barrels work somehow.

Read the rest of this entry »


2019 Deserved Barrel% – Full List

A couple of weeks ago, I devised a deserved barrel rate (where barrel rate is calculated as a percentage of batted ball events, or Barrel/BBE) based exclusively on a hitter’s average exit velocity (EV) and average launch angle (LA). To employ such a simple model, I made a broad but accurate assumption: the average hitter’s average EV (or LA) has a distribution of EVs (or LAs) centered around it, and this distribution does not differ dramatically from other hitters’ distributions.

In layman’s terms, the typical hitter’s average launch angle is his — he owns it, and it reflects his swing plane and mechanics — but he is no better than any other typical hitter in repeating his average launch angle. He, like everyone else, will likely vary from the mean by a certain margin of error. I make the same assumption of exit velocity as well. The two variables bear almost zero correlation to each other. In light of this assumption, the best thing a hitter can do is maximize his exit velocity and hopes it coincides with an optimal launch angle.

(Some folks have suggested I include the percentage of balls hit 95+ mph to refine deserved barrels. The notion intrigues me. However, to illustrate a point: if you have two hitters with identical average EVs, would you expect their distribution of EVs to be dramatically different? Probably not. The inclusion of hard-hit rate accepts as fact that one hitter might be better at hitting 95+ mph more frequently — which would also suggest he hits more softly more frequently as well, and with certainty. This doesn’t stand out to me as a repeatable, let alone necessarily desirable, trait.)

Read the rest of this entry »


Devising a Deserved Barrel%

A couple of weekends ago at BaseballHQ‘s First Pitch Arizona conference, The Athletic’s Eno Sarris and I talked about hitter metrics most descriptive and/or predictive of power. In Eno’s presentation, he included a quip from analyst Hareeb al-Saq:

“Knowing barrels on top of average EV [exit velocity] tells you a lot. Knowing average EV on top of barrels tells you a little.”

Eno was surprised by this finding — that barrel rate is a more beneficial metric than average EV, or even EV on a certain type of batted ball event (BBE), such as fly balls and line drives. Incidentally, this is something Al Melchior and I researched last year for which we reached the same conclusion: barrels, whether as a percentage of batted ball events or plate appearances, correlate more strongly than average, maximum, or fly ball/line drive EVs did to common power metrics such as home runs per fly ball (HR/FB), isolated power (ISO), or hard-hit rate (Hard%).

However, it made more sense to Eno when I articulated that calculating barrel rate is simply the act of isolating a hitter’s most-optimal batted ball events. In other words, the inclusion of launch angle (LA) adds another explanatory dimension to EV. In my head, it’s like having two separate circles — one for EV, the other for LA, each containing every individual batted ball outcome from the season — and overlapping them. The overlapped portion of the Venn diagram signifies barrels, and it changes in size depending on the quality of the batted ball events.

Read the rest of this entry »