Stats That Matter: Cutting Through the B___S___
The amount of stats available to analysts today is overwhelming. At least it’s getting that way with me. I’d prefer everything to be available to investigate an idea. But no one has the time to go over every single stat to see if a player has changed for the better or worse. I’m going to eliminate all but 10 stats to focus on those few that matter the most.
The key behind my analysis is to find if a pitcher or hitter has changed. A few dozen projection sets exist to set a talent baseline but once the season starts, most people want to throw them out (some even before the season) if a hitter is batting .150 or a pitcher has a 6.00 ERA. Players are human and creatures of habit so most won’t change. But some do and being able to focus on these few can help to find values.
Additionally, there can be some outside factors beyond a player’s control (e.g. being shift) which can change their output. It’s time to cut through the pleasantries and cut to the chase. I’ll go ahead and start the analysis with hitters
Hitters
I asked on Twitter a few days back for some help collecting ideas to go with the ones I found. Here are the ways a hitter can change his production and the stats where that change will be seen.
Hitter change: Stat where change is seen
- Swing path: Launch angle and groundball rate
- Swing harder: exit velocity, hard hit rate, strikeout rate
- Spray ball: Pull rate, spray angle
- Pitch/count selection: Walk and strikeout rate, power
- Plate coverage (stance): Pull rate, strikeout rate
- Platoon difference: wOBA or OPS difference
- Speed: Sprint Time, Time to 1B
And here are the outside factors which can change (non-league or park variables which are known)
Outside factor: Stat which change is seen
- Pitch location: Zone rate, heatmap plot
- Pitch mix: Pitch mix percentages
- Shift rate: Rate of being shifted, BABIP
There is a quite a bit overlap in final stats. Overall, the stats to focus on to see if a hitter has changed are:
- Strikeout rate
- Walk rate
- Launch angle: Launch angle and groundball rate correlate almost perfectly so either can be used.
- Power: I’m not sure the best indicator but I do like Baseball Savants Hard Hit rate (batted balls over 95 mph). Other factors like HR/FB or ISO could be used when StatCast metrics are not available.
- Spray angle: I’d just concentrate on Pull% since most hitters will eventually only pulling the ball.
- Pitch Mix: The key here is focusing on fastball usage. Not every pitcher is going tothrow every breaking ball, but everyone has a fastball.
- Pitch Location: I find Zone% to be a decent proxy to see if pitchers must throw into the zone or can get a hitter to chase. At times though, an analyst may need to break out a heat map since the pitches may move but in the strike zone.
- Platoon issues: Career and current split in OPS or wOBA
- Shift Rate: The number of times and the effect of shifts. Information can be found on the FanGraphs splits pages.
- Player speed: Sprint speed and time to first values at Baseball Savant
In all, just ten factors need to be examined with seven easily added to our custom view. All but the platoon, sprint speed, and shift numbers can be added to our custom menu. Here is an example for Sir Mike Trout.
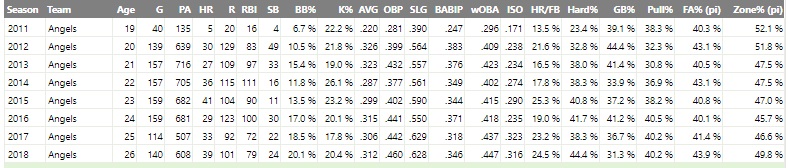
In some instances, factors may be pulling the same variable in different directions but overall, there is no change. Why should a person care if there is no change? Find and analyze someone who is experiencing changes.
Pitchers
Overall, this is a fickle group since anyone’s talent can change significantly from one game to the next (e.g. drop a pitch). It’s sometimes best to do some of the analysis from our Graphs tab (e.g. velocity and pitch mix). Like with hitters, here are the ways a pitcher can change and the stats that change.
- Velocity: Pitch speed, strikeouts
- Add/remove pitches: Pitches throw percentages
- Delivery: Individual pitch results (Swinging strike rate and groundball rate). Individual pitch result changes can lead to different strikeout and walk rates. While strikeout and walks drive most of a pitcher’s value, the reason behind any change needs to be determined. One reason may not exist, or it can be the sign of a bigger change. Additionally, the batted ball nature of each pitch needs to be considered for a pitcher’s overall batted ball profile.
- Pitch movement: Individual pitch results (Swinging strike rate and groundball rate)
- Attacking the strike zone: First strike rate, zone percentage
- Control and command of pitches: Walk and strikeout rate
- Strike zone location of pitches: Individual pitch results (Swinging strike rate and groundball rate)
- Pitch Sequencing: Individual pitch results (Swinging strike rate and groundball rate)
And now here are the outside factors which can weigh on a pitcher’s performance.
- Catcher framing ability: strikeout and walk rate
- Teams defense: BABIP
- Times allowed facing batters: Inning per appearance, times through the order.
All the following factors can be simplified down to these factors to see if a pitcher has changed.
- Walk, Strikeout, and Groundball rate: If these haven’t moved, the pitcher hasn’t likely changed and any out of place BABIP or ERA can be ignored. The problem with them changing, is to find if there is a root cause or was just a change in luck for a few games.
- Pitch Mix
- Velocity change: Fastball velocity is usually cited but others pitches (e.g. slider) are more effective at higher speeds.
- Individual pitch results: While I’ve created my own pERA metric to help evaluate pitches, it’s best for owners to navigate to the pitcher’s pitch split page. I focus almost entirely on the pitch’s swinging strike rate (correlates to strikeouts) and groundball rate (good batted ball results at the extremes). If fantasy owners aren’t looking at these they will continue to fall behind their competition. Don’t be lazy and use the pitch values (pVal). They are 100% at-bat result based (e.g. single, strikeout, etc) and correlate as good as ERA from season to season.
- Zone rate: Of the two values at FG, go with the Pitch Info values.
- First strike rate
- BABIP: I’d prefer to not focus on BABIP but some defences are better than others. I’d stay away from the player’s BABIP and link it to how much his team is under or over performing on balls-in-play.
- Times through the order: This metric is a little tough to perfectly find (Split tab) and is best to compare the percentage of plate appearances which are the third time.
That it for pitchers. With so much information available, it’s just 10 stats (pure luck on the same number as hitters) with some overlap with the Walk, Strikeout, and Groundball rates.
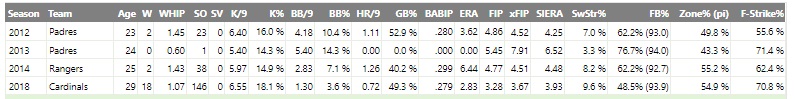
For pitchers at FanGraphs, it takes three navigations to get the needed information. First, here is a Custom Dashboard example for Miles Mikolas.
Next, owners need to head over to the Graphs tab and input the various metrics to notice any changes.

Finally, go to Splits -> Pitch Types -> All and get the individual pitch information.
That’s it, 20 stats to focus on. Ten for hitters and ten for pitchers. The rest is just noise when someone is trying to determine if a hitter has changed or changes have been forced on him by outside forces.
I’d be leery of any player analysis which doesn’t get close to this level of detail (lack of knowledge) or ones that go too far (showing off their useless knowledge). It’s a world with too much information and hopefully, I helped to limit the amount of it to be consumed. Just focus on what matters.
RotoGraphs is teaming up with the NFBC to provide unique content throughout the season. To find out about the various NFBC events like the Online Championship go over to the NFBC website to see their various league options.
Jeff, one of the authors of the fantasy baseball guide,The Process, writes for RotoGraphs, The Hardball Times, Rotowire, Baseball America, and BaseballHQ. He has been nominated for two SABR Analytics Research Award for Contemporary Analysis and won it in 2013 in tandem with Bill Petti. He has won four FSWA Awards including on for his Mining the News series. He's won Tout Wars three times, LABR twice, and got his first NFBC Main Event win in 2021. Follow him on Twitter @jeffwzimmerman.
BRB, off to create a 10×10 Roto league. 😉