
Starting Pitcher Chart – May 28th, 2026
- Daily SP Chart archive
- 2-Start podcast episode
- SP Rankings (last update: 4/27 | next: wk of 6/1)
Welcome to the Daily SP Chart, click here if you’re new to get an idea of what I’m doing with these rankings.
The chart includes their performance for 2026, their opponent’s wOBA versus the pitcher’s handedness, and recently added opponent’s K% (also v. SP handedness), my general start/sit recommendation for 10-team, 12-team, and 15-team (or more) leagues – essentially a shallow, medium, deep league setup – and then a note about some, most, or all depending on the day. If a pitcher only has an “x” in 15-team, it doesn’t mean there’s no potential use in 10s and 12s, but it’s a much riskier stream for those spots.
These are general recommendations for standard 5×5 roto leagues, and your league situation will carry more weight whether you are protecting ratios or chasing counting numbers. I usually won’t have much to write about aces who are locked into our rotations. If you want to discuss someone further, please feel free to leave a comment. I usually do a few sweeps of the comments before game time in case there are time-sensitive questions.
Pretty straightforward board of starts/sits. Check back for some notes in the AM.
—
| Rk | PITCHER | Team | Opponent | T | 10 | 12 | 15+ | IP | ERA | WHIP | K% | K-BB | OPP K% | opp wOBA RK |
|---|---|---|---|---|---|---|---|---|---|---|---|---|---|---|
| 1 | Paul Skenes | PIT | v. CHC | R | x | x | x | 60 | 3.00 | 0.82 | 28% | 24% | 21% | 13 |
| 2 | Chris Sale | ATL | at BOS | L | x | x | x | 62 | 1.89 | 0.87 | 30% | 24% | 21% | 8 |
| 3 | Nathan Eovaldi | TEX | v. HOU | R | x | x | x | 61.2 | 3.65 | 1.14 | 24% | 18% | 22% | 10 |
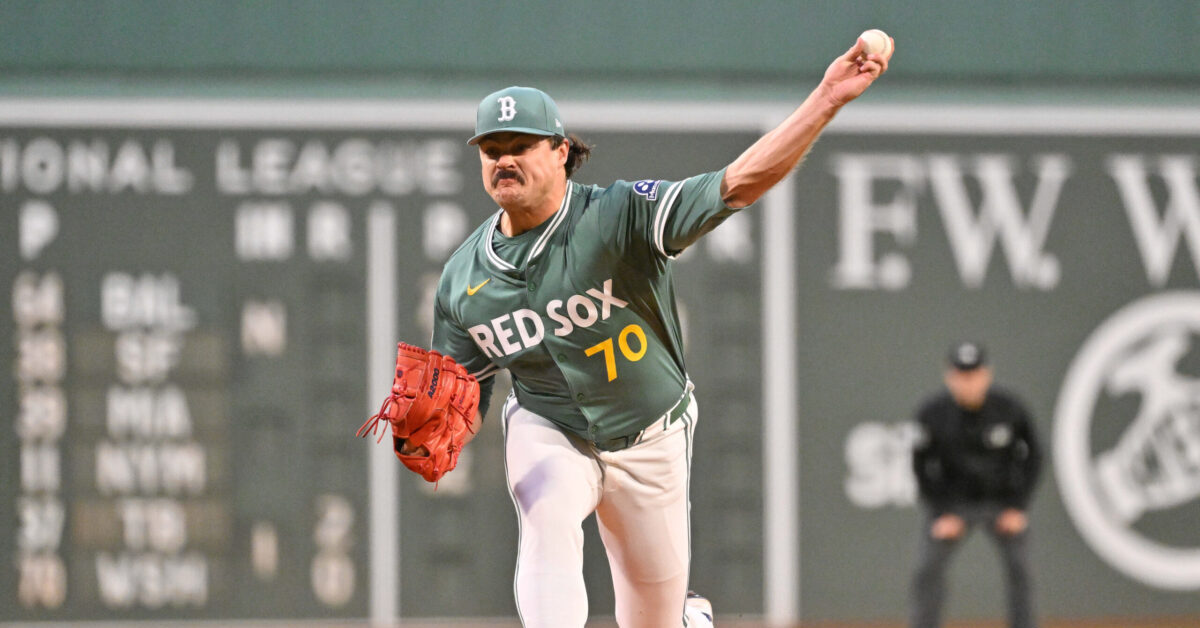
| 4 | Payton Tolle | BOS | v. ATL | L | x | x | x | 36.2 | 2.45 | 0.82 | 28% | 21% | 20% | 10 |
| 5 | Spencer Arrighetti | HOU | at TEX | R | x | x | x | 41 | 1.32 | 1.20 | 23% | 9% | 22% | 12 |
| 6 | Taj Bradley | MIN | at CHW | R | x | x | x | 52 | 2.77 | 1.17 | 27% | 18% | 24% | 20 |
| 7 | Davis Martin | CHW | v. MIN | R | x | x | x | 61.2 | 2.04 | 1.02 | 27% | 22% | 23% | 14 |
| 8 | Colin Rea | CHC | at PIT | R | x | 54 | 4.83 | 1.37 | 19% | 12% | 22% | 4 | ||
| 9 | Patrick Corbin | TOR | at BAL | L | x | 44.1 | 3.86 | 1.40 | 17% | 10% | 25% | 24 | ||
| 10 | Grayson Rodriguez | LAA | at DET | R | 9.1 | 10.61 | 2.14 | 20% | 7% | 23% | 24 | |||
| 11 | Jack Flaherty | DET | v. LAA | R | 47 | 5.94 | 1.66 | 24% | 12% | 26% | 22 | |||
| 12 | Chris Bassitt | BAL | v. TOR | R | 47.1 | 5.51 | 1.67 | 15% | 7% | 19% | 17 |
Intro
The chart includes their performance for 2026, their opponent’s wOBA versus the pitcher’s handedness, my general start/sit recommendation for 10-team, 12-team, and 15-team (or more) leagues – essentially a shallow, medium, deep league setup – and then a note about some, most, or all depending on the day. If a pitcher only has an “x” in 15-team, it doesn’t mean there’s no potential use in 10s and 12s, but it’s a much riskier stream for those spots.
These are general recommendations for standard 5×5 roto leagues, and your league situation will carry more weight whether you are protecting ratios or chasing counting numbers. I usually won’t have much to write about aces who are locked into our rotations. If you want to discuss someone further, please feel free to leave a comment. I usually do a few sweeps of the comments before game time in case there are time-sensitive questions.
Color Coding:
- Green – Good Matchup (so lower OPS output by the pitcher’s opponent)
- Yellow – OK
- Red – Bad
Is Tolle already better than McLean?
The insecure Mets fans are downvoting you!
Wind at 10+:
DET – out to R center at 11
CHW – Across from L to R at 16
BAL – in from L at 10
PIT – out to R center at 10
Only rain issue is BOS where it’s 34% at 1st pitch and 26% by games end so not terrible.
Taj was bumped to Friday. Twins are supposed to run a bullpen game.
Kendry Rojas is starting and likely going 3-4 innings. Simeon Woods Richardson will probably cover some of the middle innings after him, but that would be more dependent on how the game is going.
Hopefully that bullpen game doesn’t involve Orlando Arcia walking the bases loaded like last night.