Short Season Pitcher Variation
My initial goal was to determine the amount of variation in pitching stats in a short season. What I found was a stipulation filled mess. It should have been simple. Just take the first two months and compare how the pitchers performed to a full season. The short answer is that they did great because they pitched in cooler weather and were 100% healthy. Instead, should the results from August and Septemeber be used, by that point in the season, many had broken down and the breakouts (e.g. Lucas Giolito) emerged. There is no perfect way to answer my original idea, so I’ll try to provide several possible answers.
To limit the focus, I’m going to implement the following guidelines. It’s a lot and when I was setting them, I was questioning any possible findings. By changing any one of them, the process to find the results and the actual final results differ.
- Assumed a 12-team league and used SGP (Standing Gain Points) equation from The Process.
- I used historic Steamer projections to set the preseason valuation.
- I only examined WHIP and ERA. Most of the hot takes I’ve heard involve not wanting to deal with the possible variation in these rate stats.
- Ignored closers. They are their own beast.
- Focused on the 7 starters for 12 teams.
- Used April to May data and then August to September. Both aren’t ideal but the differences can then be analyzed.
- Anyone who didn’t pitch during the two-month time frame got zeros across the board.
- I just did 2019 and kept the mess to one season.
Test #1: ERA Tiers
The ERA projections are grouped into seven descending sets of 12 representing the estimated talent decline and the results.
| Grouping | Project | First 2 Months | Last 2 Months | Full Season |
|---|---|---|---|---|
| 1 | 3.33 | 3.78 | 3.35 | 3.51 |
| 2 | 3.65 | 3.74 | 3.47 | 3.70 |
| 3 | 3.90 | 3.58 | 3.98 | 3.71 |
| 4 | 4.08 | 3.99 | 4.71 | 4.38 |
| 5 | 4.08 | 3.71 | 3.97 | 3.87 |
| 6 | 4.20 | 4.40 | 4.22 | 4.19 |
| 7 | 4.42 | 4.85 | 4.19 | 4.70 |

As I expected, the data is messy but look at these two factors. First, any group projected for an ERA under 4.00 was below that mark for all three time periods. Second, focus on the four trend lines in the graph. They almost perfectly overlap. While there is plenty of variation, the pitchers with the best projections performed the best no matter the sample size.
Test #2: WHIP Tiers
While there was a significant variance in ERA between the projections and results, there was almost no variation in WHIP.
| Grouping | Project | First 2 Months | Last 2 Months | Full Season |
|---|---|---|---|---|
| 1 | 1.12 | 1.16 | 0.99 | 1.10 |
| 2 | 1.22 | 1.17 | 1.12 | 1.15 |
| 3 | 1.25 | 1.15 | 1.20 | 1.16 |
| 4 | 1.27 | 1.24 | 1.35 | 1.29 |
| 5 | 1.31 | 1.22 | 1.28 | 1.26 |
| 6 | 1.30 | 1.28 | 1.29 | 1.26 |
| 7 | 1.36 | 1.40 | 1.41 | 1.42 |
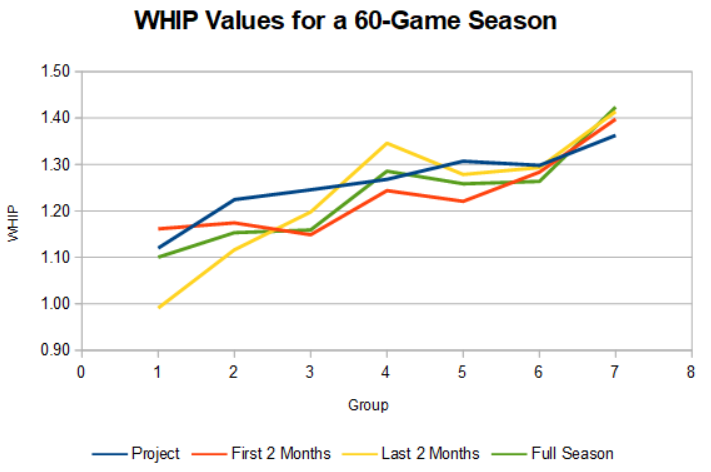
With this information, it might seem to be a season to ignore the variance in ERA and steer into good strikeout and WHIP pitchers (e.g. Matt Boyd). Maybe.
Test 3: ERA Teams
For this test, I drafted 12 seven-pitcher teams. Team 1 got the top-rated pitcher by SGP, Team 2 the next one, and so on down. Once the 12th team picked, the draft snaked back around with team 12 picking again, then team 11, and so on. The attempt was to draft 12 equal teams (team 3 got stacked). The one row of data that is confusing is the last one, Standings Change. It’s expected change in the standings for the Standard Deviation value.
| Team | Projected | First 2 Months | Last 2 months | Season |
|---|---|---|---|---|
| 1 | 3.84 | 4.03 | 4.99 | 4.15 |
| 2 | 3.68 | 2.99 | 4.08 | 3.27 |
| 3 | 3.87 | 4.99 | 4.01 | 4.20 |
| 4 | 3.94 | 3.17 | 4.21 | 3.72 |
| 5 | 3.93 | 3.52 | 2.92 | 3.17 |
| 6 | 3.94 | 4.34 | 3.15 | 3.75 |
| 7 | 4.06 | 3.79 | 4.51 | 4.24 |
| 8 | 3.99 | 4.35 | 4.21 | 4.37 |
| 9 | 3.89 | 4.58 | 3.37 | 4.40 |
| 10 | 4.02 | 4.10 | 4.23 | 3.99 |
| 11 | 3.96 | 4.12 | 3.48 | 3.92 |
| 12 | 3.92 | 4.47 | 4.94 | 4.64 |
| Min | 3.68 | 2.99 | 2.92 | 3.17 |
| Standard Dev | 0.10 | 0.59 | 0.66 | 0.45 |
| Max | 4.06 | 4.99 | 4.99 | 4.64 |
| Standings Change | 1.4 | 8.3 | 9.4 | 6.3 |

The values range from an ERA as low as 3.00 to others at 5.00. Only team 10 had a small range of outcomes. The actual values may not end up so high because some fantasy managers would have tried to make adjustments (e.g. no starts in Colorado).
Also, note the two and three standings difference (6.3 vs 8.3 and 9.4) from the two month and full season samples. These will be important when the variation is compared to WHIP.
Test 4: WHIP teams
I used the same teams created for the ERA experiment and calculated each team’s WHIP.
| Team | Projected | First 2 Months | Last 2 months | Season |
|---|---|---|---|---|
| 1 | 1.21 | 1.21 | 1.31 | 1.21 |
| 2 | 1.21 | 1.06 | 1.22 | 1.10 |
| 3 | 1.24 | 1.47 | 1.19 | 1.26 |
| 4 | 1.24 | 1.11 | 1.31 | 1.20 |
| 5 | 1.25 | 1.08 | 1.03 | 1.06 |
| 6 | 1.28 | 1.35 | 1.11 | 1.22 |
| 7 | 1.26 | 1.17 | 1.31 | 1.24 |
| 8 | 1.25 | 1.29 | 1.28 | 1.30 |
| 9 | 1.26 | 1.28 | 1.22 | 1.32 |
| 10 | 1.25 | 1.30 | 1.25 | 1.27 |
| 11 | 1.24 | 1.25 | 1.24 | 1.23 |
| 12 | 1.28 | 1.31 | 1.30 | 1.32 |
| Min | 1.21 | 1.06 | 1.03 | 1.06 |
| Standard Dev | 0.02 | 0.12 | 0.09 | 0.08 |
| Max | 1.28 | 1.47 | 1.31 | 1.32 |
| Standings Change | 1.6 | 9.0 | 6.4 | 6.0 |
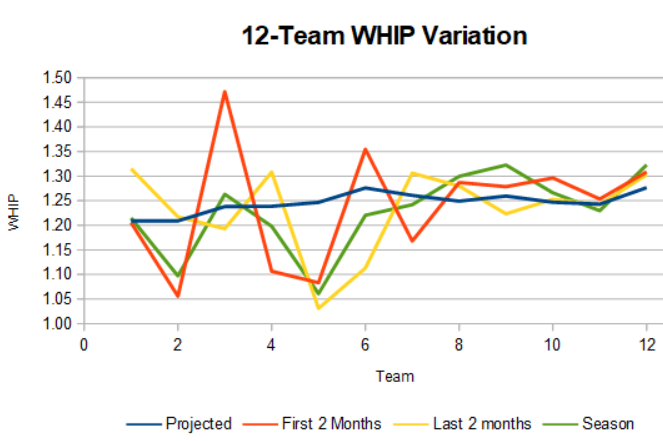
The results are mixed. If just going off the first two months, the standings difference between the projected and actual is substantial (6.0 vs 9.0). If just the last two months are used, it’s just 0.4 (6.0 vs 6.4). I can’t think of a good reason why.
The other point of interest is that teams seven to 12 have almost no variation in the values. Some managers got what they paid for.
Conclusions
I hoped for some red flashing arrows on the best approach, but there were none. I started out thinking that ignoring ERA would be the answer but WHIP is almost as volatile. Here my shaky conclusions:
- I’m not fading top-end starting pitchers, especially the top half-dozen aces. Their across-the-board production is top-notch and could be a significant anchor in a shortened season.
- If deciding between two players, I’ll likely take the pitcher projected for the lower WHIP.
- In a roto league, I think dumping a category is in play and I might consider ERA to be an option.
That’s it for now. If I have time, I’m considering running the 12-team numbers again for other seasons to see if the variation holds.
Jeff, one of the authors of the fantasy baseball guide,The Process, writes for RotoGraphs, The Hardball Times, Rotowire, Baseball America, and BaseballHQ. He has been nominated for two SABR Analytics Research Award for Contemporary Analysis and won it in 2013 in tandem with Bill Petti. He has won four FSWA Awards including on for his Mining the News series. He's won Tout Wars three times, LABR twice, and got his first NFBC Main Event win in 2021. Follow him on Twitter @jeffwzimmerman.
Nice read. I would imagine a lot of starters aren’t going 5 innings early in the season, so wouldn’t that give bulk pitchers more value? I.e targeting pitchers who will come in after an opener?
Logical. Might come down to considering: historical IP/start (see this author’s articles on the subject), weakness of team’s 2020 bullpen depth, perhaps organizational philosophy (e.g. use of opener, use of DL, preference to provide spot starts to keep assets fresh and test them for playoff worthiness). And your tolerance for injury risk. (This author’s grail might be SP injury factors.) Then, schedule advantages and relative strength of team’s offense.
What if we used K:BB instead?
I also agree punting ERA makes sense in that you could accidentally turn out with a solid performance in the category.
Given that teams will be playing 66% of their games within their division, I’d like to see a breakdown of who benefits more from familiarity — hitters or pitchers.