pFIP: Pitch Height, Launch Angle, and the FIP Framework

A summarized version of this post was originally presented as part of PitcherList’s PitchCon online baseball conference for charity to support the ALS Association.
Pitch location, especially pitch height, enables pitchers to augment hitters’ launch angles. This is hugely important for pitchers given that hitters exert outsized influence on exit velocities (EVs), while pitchers exert little influence on EV. As such, EV is more predictive of hitter success than launch angles are. Yet EV remains at the mercy of its launch angle counterpart; a 115-mph blast isn’t half as valuable on the ground as it is in the air. A pitcher can improve his chances of inducing those suboptimal launch angles by weaponizing optimal pitch locations.
There’s a corollary to this for pitchers: capital-S ‘Stuff’ is more predictive of pitcher success, yet it’s pitch location that primarily dictates the outcome of a pitch or plate appearance. Max Bay, now of the Astros’ R&D department, once said Stuff makes a pitcher “resilient” to bad locations–it allows more room for mistakes. But mistakes are still made, and for the majority of pitchers, they are made (or avoided) largely through pitch location.
How sensitive, then, is launch angle to pitch height? If we raise or lower a pitch by an inch or a foot, how much can we expect the resultant launch angle to change? How much can we expect rates of ground balls (GB%), line drives (LD%), fly balls (FB%), and pop-ups (PU%) to change?

I wish this graphic were oriented so pitch height could be the y-axis. Normally I’d use a program other than Excel. It was giving me a hard time. Use your imagination and spatial reasoning skills!
Regressing launch angle on pitch height, we can establish that, on average:
- Every additional inch of pitch height corresponds with an increase in launch angle of 1.16 degrees (°). Per foot, that’s roughly 14°.
- Thus, the difference in average launch angles between the bottom of the strike zone (plate_z ≈ 1.5) and the top (plate_z ≈ 3.5) is roughly 28°.
- The heart of the zone (plate_z ≈ 2.5) corresponds with an average launch angle of roughly 17°–prime line drive territory.
It’s important to emphasize “average” here. Deviations from a typical outcome require deviations from a typical pitcher. Consider Framber Valdez: only a handful of pitchers throw lower in the zone than him on average, and none of them* have remotely close to the same degree of “steepness” to their pitches, per vertical approach angle (VAA), as Valdez does. Steep pitches located down generate weak batted ball outcomes, where “weakness” is describing the outcome, not the EV. At certain launch angles, EV becomes moot, and Valdez reigns supreme among ground-ballers for bad launch angles. (A mix of unsurprising and seemingly very surprising names populate the other end of the launch angle spectrum.)
*Except Zack Greinke, whose pitch steepness is, in my estimation, more a byproduct of his lack of pitch velocity, which makes his pitches easier for hitters to see despite their alleged “steepness.” Context is key.
As with nearly everything else in baseball, we ought to discuss the relationship between pitch height and launch angle in terms of probabilities. Unfortunately, our brains aren’t really wired to think that way. An average is an average, which is helpful, but it obscures the very important fact that any launch angle is achievable at any pitch location. Pitch height does not guarantee a particular launch angle outcome. It simply helps us ascertain the array of launch angles that are likelier to occur.
That said, I think we can use batted ball rates to help us think more probabilistically. Because launch angle behaves linearly with pitch height, we can fairly safely assume that batted ball rates will change linearly with pitch height, too.
For this exercise, I have defined the batted ball types we all know and love according to the following launch angle thresholds:
- Ground ball: X < 5° (.210 AVG, .192 wOBA in 2022)
- Line drive: 5° ≤ X < 25° (.621 AVG, .649 wOBA)
- Fly ball: 25° ≤ X < 45° (.300 AVG, .473 wOBA)
- Pop-up: X ≥ 45° (.024 AVG, .024 wOBA
- For reference, pop-ups ≥ 40° = .038 AVG, .044 wOBA, aka not substantially different. This will be important later.
If we regress each batted ball type on pitch height (we don’t need to do this, but it helps smooth out the trends we see and reveal the ones we don’t), the following relationships emerge. Keep in mind, these outcomes are exclusive of any other influences and reflect all pitch types, not just fastballs or any particular set of pitch shapes:
- Ground balls: Every inch of pitch height reduces GB% by roughly 1.1 percentage points (pp) (r2 = 0.94). At the bottom and top of the strike zone, the average GB% is estimated to be 51.0% and 24.4%, respectively.
- Line drives: There is no relationship between changes in pitch height and changes in LD% (r2 = -0.02). Despite this, the intercept term, with a coefficient of 0.28, is strongly statistically significant, suggesting that, on average, LD% is strongly static at roughly 28.0%.
- Fly balls: Every inch of pitch height increases FB% by roughly 0.4pp (r2 = 0.83). At the bottom and top of the strike zone, the average FB% is estimated to be 15.3% and 25.3%, respectively.
- Pop-ups: Every inch of pitch height increases PU% by roughly 0.7pp (r2 = 0.96). At the bottom and top of the strike zone, the average PU% is estimated to be 6.1% and 23.3%, respectively.
The most critical revelation here: ground balls and pop-ups are most sensitive to changes in pitch height. This informs everything that follows.
Influencing launch angle sounds easy, but it’s not. Who knew?
Again, we’re dealing with probabilities, not certainties. Pitching is a high-variance proposition. A pitcher can lean on pitch height to influence launch angle, yet:
- He cannot always command to his ideal location
- Even when he locates in his ideal location, he cannot guarantee whether or not the hitter makes contact (or swings at all)
- Even when the hitter makes contact, (to reiterate:) any launch angle is achievable at any pitch location
Just because pitcher “contact management” fails to exhibit reliable league-wide trends does not mean it’s not an ownable skill. Frankly, most pitchers don’t own the skill. But those who do can replicate it reliably year to year.
What else influences launch angles?
VAA is a valuable component of Stuff that shows why pitching is more than just location, yet remains inextricable from it. Differences in VAA move the needle on batted ball outcomes, but those differences are sensitive to pitch height.
Horizontal pitch location affects launch angles, but its impact is far less significant than that of vertical pitch location (aka height).
Outside the pitcher’s control, hitters’ swing planes affect launch angle outcomes, too. If Valdez faced Rhys Hoskins and Eric Hosmer 500 times each, he would arrive at dramatically different batted ball outcomes because of Hoskins’ and Hosmer’s respective predispositions to fly balls and grounders.
Pushing FIP theory forward
The logical extension of all this, to me, is a mild critique of fielding independent pitching (FIP) theory as it is represented by its popular ERA estimators. I’m not here to relitigate the validity of the FIP framework—it made sense 20 years ago and it still makes sense today.
FIP and xFIP are simplified models that, in a sense, assert what a pitcher can and can’t control—or, at least, what a pitcher should or shouldn’t be credited for. FIP rewards pitchers for strikeouts and penalizes them for walks and home runs; xFIP replaces home runs with fly balls, acknowledging that rates of home runs are subject to more noise than rates of fly balls. The prevailing assumption by both is that a pitcher has no control over his batting average on balls in play (BABIP).
I don’t think we believe that anymore, at least not in full. We routinely witness pitchers who consistently buck the trend. Remember when peak Marco Estrada befuddled us not all that long ago? We have the data and minds to move past this, and mostly we have. Yet even the most proficient and intelligent of public analysts return to FIP and xFIP as evidential shorthand, mostly due to institutional inertia (friction?).
To wrest ourselves from this stasis, we can leverage data to assert which types of batted balls need not be fully “independent” of fielding. Pop-ups, both within and outside the infield, are almost always automatic outs. Ground balls, meanwhile, are low-variance outcomes, resulting in mostly outs, occasionally singles, almost never anything more. It is a perfect confluence of traits: pop-ups and ground balls are not only more sensitive to pitch height, which a pitcher can control, but also more stable and more harmless in their outcomes. A pitcher can’t guarantee a fielder makes every play, but he ought to be rewarded for leading the horse to water, even if it won’t drink.
Composing a new ERA estimator
my new year's resolution is to not create any new quality of contact metrics or pitching estimators in 2023
— Jordan in Finland (Fantasy Baseball Oligarch) (@RosenJordanBlum) December 31, 2022
Sorry, Jordan.
Hypothetically, if you were to ask me to develop an ERA estimator, I’d propose the following components: strikeouts, walks plus hits by pitch, pop-ups (batted balls 40° and above, rather than 45° and above), and what I’ll call dribblers, a subset of ground balls -13° and below. Why dribblers? Because they’re weaker and more extreme than regular ground balls, just as pop-ups are weaker and more extreme than fly balls (although less constraining than “infield fly balls,” which restrict pop-ups only to the infield. Booooo infield fly balls!). Each would be calculated as a percentage of total batters faced (TBF) and represented as a difference from the league average. For example, K% would actually be “pitcher K% minus league K%.”
And if you asked me to compare the resulting estimator to FIP, xFIP, and SIERA—hypothetically, no doubt—we would find that it is both more predictive of next-year ERA than and just as sticky (predictive of itself year over year) as any of them. For short, let’s call it pFIP, where “p” stands for “predictive”:

Testing correlations, using consecutive pitcher-seasons of 600+ TBF from 2017 through 2022:
| Estimator | Predictiveness (R² w/ Y2 ERA) | Stickiness (R² w/ Y2 Self) |
|---|---|---|
| ERA | 0.16 | 0.16 |
| FIP | 0.18 | 0.30 |
| xFIP | 0.18 | 0.52 |
| SIERA | 0.20 | 0.52 |
| pFIP | 0.20 | 0.52 |
And if you increase the threshold to 650+ TBF (which, at just 95 consecutive pitcher-season combinations, is admittedly thin):
| Estimator | Predictiveness (R² w/ Y2 ERA) | Stickiness (R² w/ Y2 Self) |
|---|---|---|
| ERA | 0.14 | 0.14 |
| FIP | 0.21 | 0.28 |
| xFIP | 0.16 | 0.45 |
| SIERA | 0.19 | 0.47 |
| pFIP | 0.22 | 0.50 |
At the very least, pFIP goes punch for punch with SIERA without the unneeded complexity. While SIERA admirably endeavored to capture the nonlinear, interactive elements of pitching, it did so with an everything-but-the-kitchen-sink approach, one that is not easily comprehensible to the layperson. And do you want that internet dullard to call you a nerd who never even played in high school, even though it’s not true, just because you cited SIERA to him in a petty cyber spat? I didn’t think so.
Why is pFIP better, if only slightly? I think it’s thanks to an intuitive and self-evident theoretical foundation that pleasantly captures where reliable skills and reliable outcomes intersect.
(Note: the shortened 2020 season constrains our sample insofar as every pitcher-season from that campaign was, itself, a “small sample” and does not meet the thresholds I set. That removes the 2019-2020 and 2020-2021 combinations from our sample to test predictiveness. In a perfect world, I’d use more data, but Statcast only dates back to 2015. I could have used those years, sure, or I could have lowered the threshold. Yell at me about it! I’m a glutton for punishment. (I’m not, please don’t yell.))
Modifying pFIP, already
While hitters exert most of the influence over EV, pitchers do exert a small amount of influence. So, let’s add something to pFIP to account for pitcher “EV influence.” It might be easier, and possibly more effective, to use barrel rate (Brl%) or hard-hit rate (Hard%). I’d prefer to formulate something like this:
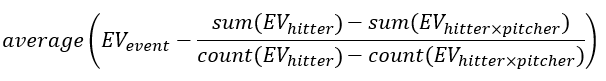
Order of operations: (1) for a given batted ball event, calculate the average EV of the hitter against every other pitcher; (2) find the difference between the EV that occurs and the hitter’s every-other-pitcher EV; and (3) calculate the average of all of those differences for that pitcher. The result is the miles per hour (mph) a pitcher adds to or subtracts from a hitter’s “naturally occurring” EV.
EV influence is not sophisticated, but I’ve found it to be more instructive than, say, average EV. “Modified pFIP” finds it instructive, too, improving both the descriptive and predictive powers of pFIP:
| Estimator | Descriptiveness (R² w/ Y1 ERA) | Predictiveness (R² w/ Y2 ERA) |
|---|---|---|
| ERA | 1.00 | 0.16 |
| FIP | 0.66 | 0.18 |
| xFIP | 0.47 | 0.18 |
| SIERA | 0.45 | 0.20 |
| pFIP | 0.45 | 0.20 |
| Modified pFIP | 0.47 | 0.23 |
And, again, at the increased threshold of 650+ TBF:
| Estimator | Descriptiveness (R² w/ Y1 ERA) | Predictiveness (R² w/ Y2 ERA) |
|---|---|---|
| ERA | 1.00 | 0.14 |
| FIP | 0.64 | 0.21 |
| xFIP | 0.43 | 0.16 |
| SIERA | 0.43 | 0.19 |
| pFIP | 0.48 | 0.22 |
| Modified pFIP | 0.47 | 0.24 |

A majority of pitchers in our sample improve with a modification to include EV influence. This has a lot to do with selection bias: a pitcher will keep pitching if he is finding success, and he will find success probably because he is dampening hitters’ EVs.
pFIP isn’t necessarily the best, nor the first
Other run estimators better than the Big Three already exist; I want to be clear that I’m not here to claim the opposite. Baseball Prospectus’ DRA comes to mind. Others have placed greater emphasis on the contact that pitchers allow through the lens of launch angle, like Connor Kurcon’s Classified Run Average (CRA), which uses barrel rate, and Dan Richards‘ Forecasted Run Average (FRA), which uses averages for EV and launch angle. Heck, Eno Sarris and the aforementioned Jordan Rosenblum just published new Stuff-and-Location-based ERA projections the other day. (I have been asking for a Stuff-based metric that can be converted to an ERA scale for ever. Without pitch-level information, we are omitting, like, three-fourths of the information available to us!) All of these are stickier and more predictive than the Big Three, and I’d wager there are more out there. Pushing ERA estimators forward is probably one of fantasy baseball’s favorite pastimes. Ultimately, pFIP is about validating a theory, not about winning a pissing contest.
There’s a larger conversation to be had about the Big Three,
but I don’t really want to belabor it too much here, and it’s not like we haven’t been having it for years. To summarize my feelings quickly: we should have an ERA estimator (or an array of estimators) that is as descriptive as possible and another estimator(s) that’s as predictive as possible. Anything in between is not really worth our time. The Big Three might fall into the latter category.
Moreover, should FIP be the basis of WAR (wins above replacement)? My rhetorical question, of course, is, does it most accurately capture what pitchers control and what they don’t? Or does its assumptions/implications paint too broadly?
Oh yeah, here’s a pFIP leaderboard
Because what good would all this be without one?
| Season | Name | ERA | FIP | xFIP | SIERA | pFIP | Modified pFIP |
|---|---|---|---|---|---|---|---|
| 2022 | Max Scherzer | 2.29 | 2.62 | 3.23 | 2.88 | 2.51 | 2.31 |
| 2022 | Spencer Strider | 2.67 | 1.83 | 2.30 | 2.41 | 2.40 | 2.38 |
| 2022 | Shane McClanahan | 2.54 | 3.00 | 2.60 | 2.82 | 2.54 | 2.38 |
| 2022 | Shohei Ohtani | 2.33 | 2.40 | 2.65 | 2.73 | 2.54 | 2.43 |
| 2022 | Aaron Nola | 3.25 | 2.58 | 2.77 | 2.80 | 2.75 | 2.64 |
| 2022 | Clayton Kershaw | 2.28 | 2.57 | 2.83 | 2.98 | 2.67 | 2.75 |
| 2022 | Corbin Burnes | 2.94 | 3.14 | 2.85 | 2.91 | 2.94 | 2.82 |
| 2022 | Sandy Alcantara | 2.28 | 2.99 | 3.29 | 3.42 | 2.69 | 2.82 |
| 2022 | Justin Verlander | 1.75 | 2.49 | 3.23 | 3.09 | 2.73 | 2.83 |
| 2022 | Zack Wheeler | 2.82 | 2.89 | 3.06 | 3.19 | 3.30 | 2.84 |
| 2022 | Gerrit Cole | 3.50 | 3.47 | 2.77 | 2.77 | 2.77 | 2.90 |
| 2022 | Max Fried | 2.48 | 2.70 | 3.09 | 3.31 | 3.25 | 2.93 |
| 2022 | Carlos Rodón | 2.88 | 2.25 | 2.91 | 2.83 | 2.86 | 2.96 |
| 2022 | Julio Urías | 2.16 | 3.71 | 3.81 | 3.66 | 3.15 | 2.99 |
| 2022 | Aaron Ashby | 4.44 | 4.06 | 3.29 | 3.48 | 3.17 | 3.02 |
| 2022 | Cristian Javier | 2.54 | 3.16 | 3.53 | 3.14 | 2.99 | 3.06 |
| 2022 | Brandon Woodruff | 3.05 | 3.08 | 3.14 | 3.03 | 3.00 | 3.07 |
| 2022 | Joe Musgrove | 2.93 | 3.59 | 3.47 | 3.45 | 3.33 | 3.09 |
| 2022 | Luis Severino | 3.18 | 3.70 | 3.38 | 3.37 | 3.04 | 3.12 |
| 2022 | Frankie Montas | 4.05 | 3.78 | 3.61 | 3.74 | 3.22 | 3.12 |
| 2022 | Dylan Cease | 2.20 | 3.10 | 3.50 | 3.48 | 3.26 | 3.13 |
| 2022 | Nestor Cortes | 2.44 | 3.13 | 3.63 | 3.48 | 3.17 | 3.22 |
| 2022 | Zac Gallen | 2.54 | 3.05 | 3.31 | 3.32 | 3.28 | 3.23 |
| 2022 | Framber Valdez | 2.82 | 3.06 | 2.99 | 3.14 | 3.03 | 3.25 |
| 2022 | Tyler Anderson | 2.57 | 3.31 | 4.10 | 4.04 | 3.77 | 3.30 |
| 2022 | Jesús Luzardo | 3.32 | 3.12 | 3.11 | 3.28 | 3.21 | 3.31 |
| 2022 | Yu Darvish | 3.10 | 3.31 | 3.58 | 3.39 | 3.35 | 3.34 |
| 2022 | Jeffrey Springs | 2.46 | 3.04 | 3.29 | 3.32 | 3.64 | 3.35 |
| 2022 | Alex Cobb | 3.73 | 2.80 | 2.89 | 3.15 | 3.29 | 3.35 |
| 2022 | Kevin Gausman | 3.35 | 2.38 | 2.75 | 2.94 | 3.28 | 3.36 |
| 2022 | Chris Bassitt | 3.42 | 3.66 | 3.72 | 3.75 | 3.93 | 3.39 |
| 2022 | Ranger Suárez | 3.65 | 3.87 | 3.82 | 4.11 | 3.69 | 3.45 |
| 2022 | Jon Gray | 3.96 | 3.80 | 3.46 | 3.56 | 3.53 | 3.47 |
| 2022 | George Kirby | 3.39 | 2.99 | 3.33 | 3.32 | 3.27 | 3.51 |
| 2022 | Robbie Ray | 3.71 | 4.17 | 3.58 | 3.50 | 3.33 | 3.55 |
| 2022 | Brady Singer | 3.23 | 3.58 | 3.30 | 3.40 | 3.43 | 3.55 |
| 2022 | Shane Bieber | 2.88 | 2.87 | 2.98 | 3.21 | 3.33 | 3.57 |
| 2022 | Alek Manoah | 2.24 | 3.35 | 3.97 | 3.85 | 3.75 | 3.58 |
| 2022 | Graham Ashcraft | 4.89 | 4.21 | 4.09 | 4.22 | 3.66 | 3.58 |
| 2022 | Drew Smyly | 3.47 | 4.23 | 4.18 | 4.06 | 3.90 | 3.62 |
| 2022 | Corey Kluber | 4.34 | 3.57 | 3.92 | 3.85 | 3.89 | 3.63 |
| 2022 | Logan Webb | 2.90 | 3.03 | 3.31 | 3.56 | 3.55 | 3.64 |
| 2022 | Hunter Greene | 4.44 | 4.37 | 3.64 | 3.33 | 3.43 | 3.65 |
| 2022 | Jameson Taillon | 3.91 | 3.94 | 3.79 | 3.84 | 3.78 | 3.65 |
| 2022 | Lance Lynn | 3.99 | 3.82 | 3.44 | 3.35 | 3.55 | 3.65 |
| 2022 | Triston McKenzie | 2.96 | 3.59 | 3.77 | 3.57 | 3.37 | 3.66 |
| 2022 | Alex Wood | 5.10 | 3.76 | 3.41 | 3.45 | 3.51 | 3.67 |
| 2022 | Tyler Mahle | 4.40 | 3.87 | 4.03 | 3.88 | 3.66 | 3.69 |
| 2022 | Luis Castillo | 2.99 | 3.07 | 3.23 | 3.35 | 3.69 | 3.70 |
| 2022 | Drew Rasmussen | 2.84 | 3.26 | 3.56 | 3.74 | 3.56 | 3.71 |
| 2022 | Andre Pallante | 3.17 | 3.98 | 3.71 | 3.78 | 3.42 | 3.71 |
| 2022 | Tyler Wells | 4.25 | 4.52 | 4.60 | 4.53 | 3.82 | 3.72 |
| 2022 | Kyle Wright | 3.19 | 3.58 | 3.30 | 3.48 | 3.71 | 3.73 |
| 2022 | Paul Blackburn | 4.28 | 4.21 | 3.89 | 4.09 | 3.75 | 3.74 |
| 2022 | Jordan Montgomery | 3.48 | 3.61 | 3.43 | 3.61 | 3.94 | 3.75 |
| 2022 | Michael Wacha | 3.32 | 4.14 | 3.99 | 4.07 | 3.75 | 3.75 |
| 2022 | Noah Syndergaard | 3.94 | 3.83 | 4.28 | 4.39 | 4.01 | 3.75 |
| 2022 | Tarik Skubal | 3.52 | 2.96 | 3.40 | 3.58 | 3.62 | 3.75 |
| 2022 | Charlie Morton | 4.34 | 4.26 | 3.60 | 3.48 | 3.69 | 3.75 |
| 2022 | Ross Stripling | 3.01 | 3.11 | 3.67 | 3.71 | 3.68 | 3.76 |
| 2022 | Lucas Giolito | 4.90 | 4.06 | 3.66 | 3.79 | 3.81 | 3.77 |
| 2022 | Pablo López | 3.75 | 3.71 | 3.56 | 3.71 | 3.68 | 3.78 |
| 2022 | Patrick Sandoval | 2.91 | 3.09 | 3.67 | 3.94 | 3.97 | 3.79 |
| 2022 | Rich Hill | 4.27 | 3.92 | 4.12 | 4.13 | 3.88 | 3.80 |
| 2022 | Justin Steele | 3.18 | 3.20 | 3.48 | 3.81 | 4.07 | 3.81 |
| 2022 | Josiah Gray | 5.02 | 5.86 | 4.57 | 4.27 | 3.86 | 3.82 |
| 2022 | Joe Ryan | 3.55 | 3.99 | 4.35 | 3.98 | 3.75 | 3.82 |
| 2022 | Luis Garcia | 3.72 | 3.93 | 3.82 | 3.77 | 3.86 | 3.82 |
| 2022 | Carlos Carrasco | 3.97 | 3.53 | 3.45 | 3.60 | 3.83 | 3.84 |
| 2022 | Marcus Stroman | 3.50 | 3.76 | 3.49 | 3.74 | 3.64 | 3.86 |
| 2022 | Merrill Kelly 켈리 | 3.37 | 3.65 | 3.86 | 4.01 | 3.91 | 3.89 |
| 2022 | Blake Snell | 3.38 | 2.80 | 3.21 | 3.20 | 3.64 | 3.89 |
| 2022 | Johnny Cueto | 3.35 | 3.79 | 4.38 | 4.49 | 3.94 | 3.90 |
| 2022 | Trevor Rogers | 5.47 | 4.36 | 4.11 | 4.20 | 3.97 | 3.91 |
| 2022 | Sonny Gray | 3.08 | 3.40 | 3.66 | 3.73 | 3.99 | 3.92 |
| 2022 | Miles Mikolas | 3.29 | 3.87 | 3.80 | 3.99 | 4.04 | 3.92 |
| 2022 | Taijuan Walker | 3.49 | 3.65 | 3.88 | 4.05 | 3.79 | 3.92 |
| 2022 | Nick Lodolo | 3.66 | 3.90 | 3.49 | 3.29 | 3.96 | 3.94 |
| 2022 | Nick Martinez | 3.47 | 4.43 | 4.04 | 4.03 | 4.15 | 3.96 |
| 2022 | Zach Davies | 4.09 | 4.83 | 4.57 | 4.71 | 4.32 | 3.98 |
| 2022 | Martín Pérez | 2.89 | 3.27 | 3.80 | 4.08 | 4.18 | 3.99 |
| 2022 | Jose Quintana | 2.93 | 2.99 | 3.72 | 4.02 | 4.23 | 4.03 |
| 2022 | Jose Suarez | 3.96 | 3.91 | 3.86 | 3.91 | 3.95 | 4.04 |
| 2022 | Tony Gonsolin | 2.14 | 3.28 | 3.69 | 3.74 | 3.93 | 4.07 |
| 2022 | Eric Lauer | 3.69 | 4.50 | 4.08 | 4.07 | 4.06 | 4.08 |
| 2022 | Nathan Eovaldi | 3.87 | 4.30 | 3.46 | 3.55 | 3.84 | 4.08 |
| 2022 | Paolo Espino | 4.84 | 4.93 | 4.14 | 4.05 | 4.10 | 4.12 |
| 2022 | Cal Quantrill | 3.38 | 4.12 | 4.39 | 4.49 | 4.23 | 4.12 |
| 2022 | David Peterson | 3.83 | 3.64 | 3.31 | 3.57 | 4.00 | 4.13 |
| 2022 | Adrian Sampson 샘슨 | 3.11 | 3.79 | 4.39 | 4.48 | 4.21 | 4.13 |
| 2022 | Dane Dunning | 4.46 | 4.45 | 4.03 | 4.17 | 4.34 | 4.13 |
| 2022 | Keegan Thompson | 3.76 | 4.40 | 4.26 | 4.05 | 4.07 | 4.15 |
| 2022 | Logan Gilbert | 3.20 | 3.46 | 3.78 | 3.84 | 3.83 | 4.17 |
| 2022 | Jordan Lyles | 4.42 | 4.40 | 4.39 | 4.36 | 4.31 | 4.21 |
| 2022 | Kyle Gibson | 5.05 | 4.28 | 3.94 | 4.06 | 4.27 | 4.21 |
| 2022 | Michael Kopech | 3.54 | 4.50 | 4.83 | 4.73 | 4.02 | 4.21 |
| 2022 | Sean Manaea | 4.96 | 4.53 | 3.96 | 3.90 | 3.89 | 4.22 |
| 2022 | Dylan Bundy | 4.89 | 4.66 | 4.70 | 4.65 | 4.09 | 4.24 |
| 2022 | Kyle Bradish | 4.90 | 4.46 | 4.01 | 4.15 | 3.95 | 4.26 |
| 2022 | Jake Odorizzi | 4.40 | 4.28 | 4.70 | 4.59 | 4.25 | 4.27 |
| 2022 | JT Brubaker | 4.69 | 3.92 | 3.87 | 3.97 | 4.11 | 4.28 |
| 2022 | Mitch Keller | 3.91 | 3.88 | 3.99 | 4.18 | 4.41 | 4.30 |
| 2022 | José Urquidy | 3.94 | 4.60 | 4.32 | 4.18 | 4.07 | 4.33 |
| 2022 | Austin Voth | 4.34 | 4.14 | 4.33 | 4.16 | 4.40 | 4.36 |
| 2022 | Reid Detmers | 3.77 | 3.79 | 4.20 | 4.12 | 4.26 | 4.38 |
| 2022 | Adam Wainwright | 3.71 | 3.66 | 4.10 | 4.34 | 4.52 | 4.43 |
| 2022 | José Berríos | 5.23 | 4.55 | 4.21 | 4.13 | 4.31 | 4.46 |
| 2022 | Ian Anderson | 5.00 | 4.25 | 4.22 | 4.58 | 4.31 | 4.48 |
| 2022 | Austin Gomber | 5.56 | 4.54 | 4.19 | 4.24 | 4.49 | 4.48 |
| 2022 | Jakob Junis | 4.42 | 3.65 | 3.67 | 3.78 | 4.44 | 4.51 |
| 2022 | Brad Keller | 5.09 | 4.50 | 4.35 | 4.57 | 4.43 | 4.53 |
| 2022 | Tyler Alexander | 4.81 | 4.99 | 4.77 | 4.83 | 4.61 | 4.54 |
| 2022 | Cole Irvin | 3.98 | 4.21 | 4.35 | 4.37 | 4.37 | 4.55 |
| 2022 | Adrian Houser | 4.73 | 4.21 | 4.64 | 5.03 | 4.61 | 4.55 |
| 2022 | Zach Plesac | 4.31 | 4.45 | 4.39 | 4.46 | 4.38 | 4.57 |
| 2022 | Glenn Otto | 4.64 | 5.21 | 4.82 | 4.83 | 4.61 | 4.58 |
| 2022 | Daniel Lynch | 5.13 | 4.63 | 4.30 | 4.34 | 4.39 | 4.60 |
| 2022 | Dean Kremer | 3.23 | 3.80 | 4.43 | 4.54 | 4.60 | 4.60 |
| 2022 | Chris Archer | 4.56 | 4.49 | 4.57 | 4.76 | 4.47 | 4.61 |
| 2022 | Nick Pivetta | 4.56 | 4.42 | 4.26 | 4.21 | 4.35 | 4.63 |
| 2022 | Marco Gonzales | 4.13 | 5.05 | 4.90 | 4.99 | 4.87 | 4.64 |
| 2022 | James Kaprielian | 4.23 | 4.63 | 5.06 | 5.04 | 4.65 | 4.66 |
| 2022 | Mike Clevinger | 4.33 | 4.98 | 4.76 | 4.49 | 4.69 | 4.68 |
| 2022 | Zach Thompson | 5.18 | 4.87 | 4.44 | 4.62 | 4.79 | 4.71 |
| 2022 | Chris Flexen 플렉센 | 3.73 | 4.49 | 5.04 | 4.99 | 4.62 | 4.71 |
| 2022 | Taylor Hearn | 5.13 | 3.98 | 4.20 | 4.18 | 4.48 | 4.72 |
| 2022 | Zack Greinke | 3.68 | 4.03 | 4.54 | 4.84 | 4.68 | 4.73 |
| 2022 | Kyle Freeland | 4.53 | 4.21 | 4.48 | 4.51 | 4.64 | 4.76 |
| 2022 | German Marquez | 4.95 | 4.71 | 4.02 | 4.27 | 4.53 | 4.84 |
| 2022 | Jonathan Heasley | 5.28 | 5.67 | 5.49 | 5.30 | 4.48 | 4.85 |
| 2022 | Spenser Watkins | 4.70 | 4.24 | 4.68 | 4.86 | 4.73 | 4.87 |
| 2022 | Yusei Kikuchi | 5.19 | 5.62 | 4.07 | 4.02 | 4.53 | 4.91 |
| 2022 | Kris Bubic | 5.58 | 4.78 | 4.51 | 4.77 | 4.97 | 4.95 |
| 2022 | Erick Fedde | 5.81 | 5.15 | 4.74 | 5.00 | 4.85 | 4.97 |
| 2022 | Chad Kuhl | 5.72 | 5.26 | 4.78 | 4.80 | 4.68 | 4.98 |
| 2022 | Dakota Hudson | 4.45 | 4.34 | 4.82 | 5.11 | 4.89 | 4.98 |
| 2022 | Madison Bumgarner | 4.88 | 4.85 | 4.83 | 4.76 | 4.73 | 5.00 |
| 2022 | Drew Hutchison | 4.53 | 4.93 | 4.93 | 5.07 | 5.07 | 5.21 |
| 2022 | Patrick Corbin | 6.31 | 4.84 | 4.21 | 4.33 | 4.98 | 5.25 |
| 2022 | Bryse Wilson | 5.52 | 5.06 | 4.54 | 4.53 | 4.87 | 5.39 |
Default sort ascending by Modified pFIP
Click headers to sort!
How important is it to adjust pitcher EV according to batter EV? Because EV of batters faced is not so readily available.
Truthfully for most pitchers it is probably not important to adjust from a predictive standpoint. Most pitchers simply don’t own EV suppression as a skill to a meaningful degree. To others, like Ryan Yarbrough, Julio Urías, Patrick Corbin, etc. (just random outliers at both ends of the spectrum off the top of my head), it’s immensely meaningful, to the tune of up to half a run of ERA or more. For Yarbrough specifically, it’s a 0.65–0.70 difference.
As for access to the hitter EV data: yes, that’s challenging. It’s definitely only something you can do if you have the entire year’s worth of Statcast data scraped and at your disposal. That’s why I plan to host pFIP on my Pitch Leaderboard, so folks don’t have to worry about it!