Launch Angle, Pitch Location, and What Pitchers Can(not) Control
I spend a lot of time bothering Connor Kurcon. He’s a smart dude with a certain intuition about baseball and a certain ability to apply that intuition to produce tangible results that invariably reflect his hypotheses. He devised Predictive Classified Run Average (pCRA), an ERA estimator that outperforms the big three (FIP, xFIP, and SIERA). He also created a dynamic hard-hit rate which, to me, was astoundingly clever and a superior accomplishment to pCRA (although maybe he disagrees).
Anyway, like I said, I bother him a lot, he tolerates me, we bounce ideas off each other. The journey starts there, with my incessant annoyance of him, but also it starts here, with this Tom Tango axiom: exit velocity (EV) is the primary predictive element of hitter performance (as measured by weighted on-base average on contact, aka wOBAcon) — significantly more so than launch angle (LA). Some of the inner machinations of Tango’s mind:
That's not that interesting. What I was more interested is its relationship to NEXT YEAR's wOBA.
Not surprisingly, the performance of the 5% hardest batted balls is what indicates talent in the following year, and by a huge amount. If you've been following my barrels thread.. pic.twitter.com/hvLWr0rCSr
— Tangotiger 🍁 (@tangotiger) February 27, 2020
I won’t speak for Kurcon, but I think this finding helped guide his work on the dynamic hard-hit rate. I also think it inspired his foray into replicating this effort for pitchers or, at the very least, his attempts to determine the most predictive element of pitcher performance. Which leads us to this tweet that (spoiler alert) is actually not stupid at all:
This is going to sound stupid, verging on really stupid, but I honestly wonder if pitchers have any control over EV, like, at all and whether or not their allowed batted ball quality just comes down to launch angle. (1/6)
— Connor Kurcon (@ckurcon) May 29, 2020
Which led me to respond with this table:
it's hard for me to believe they don't have at least *some* control over EV via pitch-type evidence, but also the difference in LA across pitches seems much larger than EV, so i can see "talent" being mostly LA-related, with extreme EVs scaling probabilities up or down weakly pic.twitter.com/moZv2LwT2b
— Alex "Oxlade" Chamberlain (@DolphHauldhagen) May 29, 2020
And at this point, you’re like, I didn’t come here to read a bunch of sh*t written back and forth on Twitter. Right! Sorry! But it’s important. I wanted to believe specific pitch types — and, thus, overall pitch selection — influenced a pitcher’s contact quality allowed. I wanted to believe that, if the most predictive element of hitter performance is exit velocity, then the pitchers who suppress exit velocity most effectively would find success.
What I hadn’t considered is that the ownership (so to speak) of predictive capacity might be mutually exclusive — that is, if exit velocity is the most predictive skill for hitters, then it simply can’t be so for pitchers. And if launch angle is the odd man out, then (as Kurcon already realized) it’s launch angle, and not exit velocity, that pitchers “own” as their most predictive trait.
In the same train of thought, Tango touches up on this concept, noting certain contact qualities and certain launch angles predict pitcher performance best:
Here it is from a pitcher's perspective:
The best predictor of good pitcher talent is weakly hit balls outside of 8-40 degrees.
The best predictor of poor pitcher talent is strongly hit balls above 0 degrees.
The rest of batted balls is ~average pitcher talent. pic.twitter.com/oA9G21yKLz
— Tangotiger 🍁 (@tangotiger) March 1, 2020
But: if launch angle is so important to pitchers, what elements determine a pitcher’s launch angle allowed to begin with?
More and more, I began to suspect the outcomes in the table I presented to Kurcon failed to contextualize how each pitch type is used. To wit: fastballs up, both by virtue of command and because of rise; breaking stuff down, possibly by virtue of command but most likely because of the natural physical movement of the ball (downward break). In other words, certain pitch types do allow different launch angles on average but only because of where they end up in the zone on average.
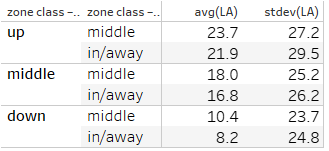
I followed up Kurcon’s and my conversation with this simple table that described the average and standard deviation of launch angle by zone location:
If you’re following along at home using Statcast’s zone classifications…

… the zones are classified as follows:
- Vertically:
- Up = 1, 2, 3, 11, 12
- Middle = 4, 5, 6
- Down = 7, 8, 9, 13, 14
- Horizontally:
- In/Away = 1, 3, 4, 6, 7, 9, 11, 12, 13, 14
- Middle = 2, 5, 8
The table provides merely anecdotal evidence, but it is nonetheless striking: vertical pitch location appears to affect launch angle, with smaller impacts away from the horizontal middle of the zone (slightly shallower angles with slightly wider variance at the inner and outer edges).
Alas, I sought to elevate the evidence from subjective to objective.
I took three years of Statcast data and isolated all non-bunt batted ball events (BBEs), totaling more than 350,000 observations from 2017 through 2019, from which I randomly sampled roughly half of them. I then assigned three vertical zone locations, three Statcast-defined pitch categories, and their nine possible combinations:
- Fastball (four-seamer, two-seamer, sinker, cutter)
- Up
- Middle
- Down
- Offspeed (change-up, splitter, forkball, screwball)
- Up
- Middle
- Down
- Breaking (slider, curve, knuckle-curve, knuckleball, eephus)
- Up
- Middle
- Down
Using what are called dummy variables, I established a true/false mechanism to classify the location and pitch type of each pitch. If a pitch is up, that pitch receives a 1 (true) for “up” and a 0 (false) for “middle” and “down.” If it’s a fastball, that’s a 1 for “fastball” and a 0 for “breaking” and “offspeed.” Fastball up? Mark it 1 for “fastball up” and 0 for the other eight combinations. For the purposes of this exercise, no pitch can have more than one “1” assigned to it. Edit (7/14/20): I then calculated the percentage of BBEs for every category as well as the launch angle for each pitcher by year.
With the data prepared, I regressed these averaged classifications Edit (7/14/20): (among pitchers who incurred at least 200 BBE in a season) against our criterion metrics: exit velocity and launch angle. The result? Neither pitch location nor pitch type, when defined broadly, bear a meaningful relationship with exit velocity. (I don’t think this is the exact composition of Kurcon’s finding — I’m not sure of all the ways he poked and prodded at the data — but it tracks with his hunch.) With launch angle, however? Moderately strong.
Moreover, the influence of pitch category on launch angle suffered in the absence of pitch location, bearing an arguably nonexistent relationship (r2 = 0.06). Pitch location as a determining factor of launch angle, however, fared admirably without pitch category (r2 = 0.27), while the combination of the two produced glowing results (r2 = 0.39). (The latter result suggests pitch category still matters, independent of pitch height. It might. We’ll touch on that.)
Let’s collect our thoughts:
- Exit velocity is the most predictive trait of hitter performance.
- The “ownership” of predictive traits is mutually exclusive, such that exit velocity is the best predictor of ongoing hitter success, then launch angle allowed is the best predictor of ongoing pitchers success.
- The combination of these two axioms — if exit velocity is more predictive (and, thus, launch angle is less predictive) of future wOBAcon, and if hitters “own” exit velocity as their predictive trait — that it is inherently more difficult to predict a pitcher’s ability to control contact quality allowed.
- (Which is something the community as known, absent Statcast, for a long time.)
- This finding hearkens back to Expected Fielding Independent Pitching (xFIP), which attributes pitcher skill exclusively to strikeouts, walks, and fly balls — and nothing else! Remarkably prescient, at this point, even prior to the advent of Statcast.
- Generalized pitch location using Statcast zones correlates moderately with launch angle allowed, whereas pitch category bears arguably no meaningful relationship. Combining the two is most optimal, but pitch category clarifies pitch location, not the other way around.
To take everything one step further, I replaced the dummy variables for pitch location and category with pitch height (plate_z, if you’re brave enough to download and manipulate Statcast’s raw data). This continuous variable would allow me to define vertical pitch location more granularly, rather than binning it into three broad groups.
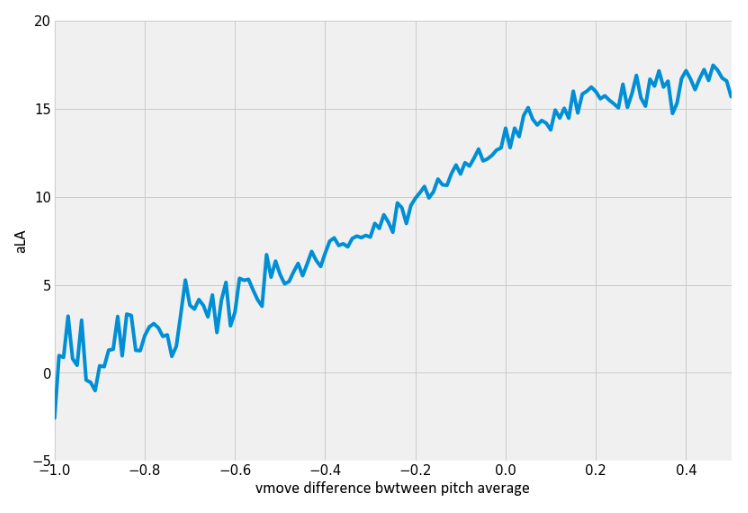
Unfortunately, a regression of pitch height against launch angle for ~175,000 distinct BBE is absurdly noisy. To circumvent this issue, I rounded each plate_z measurement to the hundredths place (2.46, for example, as opposed to 2.459426) and calculated the average launch angle for each rounded plate_z value. I then plotted the rounded plate_z values against their average launch angles and measured the relationship. The result was insane:
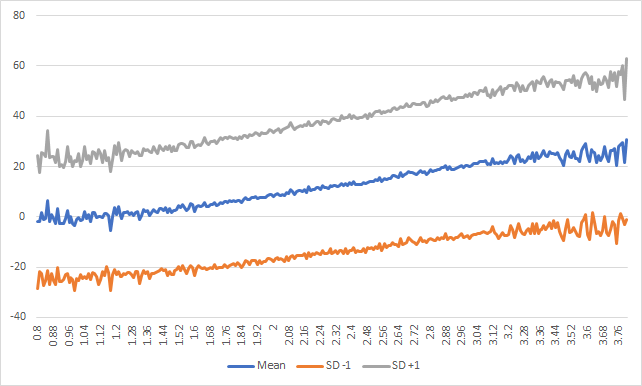
(X-axis = pitch height, Y-axis = launch angle. Click to enlarge.)
That’s an r2 between pitch height and average launch angle of 0.96(!!!!) Wilder to me, and important, too, is the consistency of the grey and orange lines, which denote one standard deviation above and below the average launch angle (for each measured pitch height). To the untrained eye, the three lines are perfectly parallel.
Still not convinced pitch category doesn’t matter, though, so here is the above plot of average launch angle but for each pitch category. You can see subtle but distinct differences, especially in slope. I suspect fastball movement and velocity influences the more-varied launch angles the pitch category allows on average.

(Click to enlarge.)
OK, so? Who cares? What does it mean?
It means that a baseball is hard to hit! (Who knew?) More specifically, a baseball is hard to hit with a consistent launch angle no matter where it is in the zone, even the pitcher absolutely grooves it. Although launch angle variance is minimized in the heart of the zone, as we might expect it to be (it’s slightly easier to square up a meatball), the standard deviation of launch angle is still roughly 25° — whereas the standard deviation steeply high or low in the zone barely pushes 29° or 30°.
(It’s important to note that pitch height [probably — I haven’t explored this yet] influences launch angle in different ways, depending on perspective. That said, Eric Hosmer and Rhys Hoskins will do very different things with a pitch in the heart of the zone. Over the course of a season, pitchers [probably] augment launch angle relative to a league average depending on where they spot their pitches, while hitters [probably] augment launch angle relative to their own average depending on what they choose to swing at.)
Although we can finally confirm hitting a baseball is hard (ha!), the key takeaway, to me, is a pitcher has a significant opportunity to influence the launch angle he allows, irrespective of pitch type. The italicized portion is news to me, because this table suggests otherwise.
I say “opportunity to influence” in lieu of something more concrete because the grey and orange lines illustrate how widely varied launch angle can be at any pitch height. For pitchers, it is an opportunity, not a certainty — a game of probability that a pitcher plays to incur a specific launch angle. He can’t control the specific angle, per se, but he can control the probability that a specific angle or range of angles might occur.
This is an important tenet because launch angle, despite its inferiority to exit velocity for predictive purposes, remains gravely important on an outcomes basis. The image below depicts batting average on balls in play (BABIP) and xwOBAcon by launch angle, regardless of exit velocity:
(Click to enlarge.)
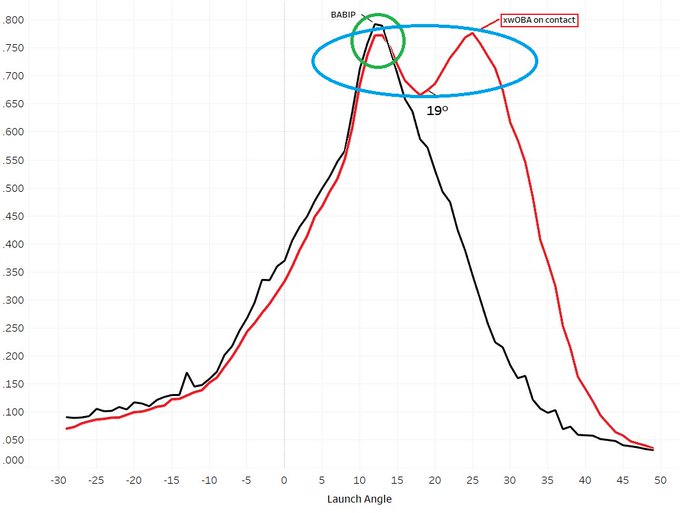
BABIP peaks (at nearly .800!) around 12° to 13°; xwOBAcon peaks twice, first with BABIP around 12° to 13°, then again around 24° to 25°. While it seems like a bad idea to allow too many batted balls at 12° to 13° or 24° to 25°, it’s arguably worse to settle in between those two peaks at 18° to 19°, where a mistake in either direction is damaging and the pitcher’s probability of eliciting a mistake from the hitter (that is, the pitcher’s margin for error) decreases significantly.
In any sense, if a pitcher can actively influence the probability with which they incur a less-damaging launch angle — if they can augment the expected value of a batted ball — by commanding a pitch to a certain part of the zone, that pitcher seems to me predisposed to more success.
As such, (I agree with Kurcon that) an expected or predictive wOBAcon for pitchers should maybe not be calculated according to the same mechanisms as for hitters (distinct versions of xwOBAcon, I mean, where hitters’ is primarily EV-driven; pitchers’, LA-driven) and should look something like this:
this is how we should be estimating xwOBA on contact (i think) pic.twitter.com/V7YBIjyBzL
— Connor Kurcon (@ckurcon) July 8, 2020
However, I don’t want to ignore horizontal pitch location all together. This table implies horizontal pitch location matters, too. The relationship appears parabolic — a peak at the heart of the plate, with shallower average angles approaching the edges of the plate, like an upside-down “U.” I re-jiggered the regression to include a linear and squared terms for horizontal plate location (plate_x and plate_x2, respectively) along with vertical plate location (plate_z).
The resulting relationship (of precise pitch location with average launch angle, by all combinations of plate_x and plate_z, both rounded to the tenths place) was a similarly crazy-strong r2 of 0.95. Between r2s of 0.95 and 0.96, we are splitting hairs, and I would rather use the estimated angle that incorporates more dimensions of pitcher command. (A regression that uses plate location and also pitch category is slightly weaker — r2 = 0.90 — but might provide more value for pitchers than others, depending on how varied their command and pitch selections are.)
(I must reiterate that such strong r2 estimates are misleading — we are aware of how wide the variance is around average launch angle. That’s why it’s important to facilitate this discussion in terms of probability rather than certainty.)
I think that covers everything — for now, at least. Let’s recap the recap by adding more bullet points in green:
- Exit velocity is the most predictive trait of hitter performance.
- The “ownership” of predictive traits is mutually exclusive, such that exit velocity is the best predictor of ongoing hitter success, then launch angle allowed is the best predictor of ongoing pitchers success.
- The combination of these two axioms — if exit velocity is more predictive (and, thus, launch angle is less predictive) of future wOBAcon, and if hitters “own” exit velocity as their predictive trait — that it is inherently more difficult to predict a pitcher’s ability to control contact quality allowed.
- (Which is something the community as known, absent Statcast, for a long time.)
- This finding hearkens back to Expected Fielding Independent Pitching (xFIP), which attributes pitcher skill exclusively to strikeouts, walks, and fly balls — and nothing else! Remarkably prescient, at this point, even prior to the advent of Statcast.
- Generalized pitch location using Statcast zones correlates moderately with launch angle allowed, whereas pitch category bears arguably no meaningful relationship. Combining the two is most optimal, but pitch category clarifies pitch location, not the other way around.
- Pitch height as well as precise pitch location play a massive role in affecting the probability of a pitcher allowing a certain launch angle.
- If pitchers cannot control exit velocity, their ability to control (the probability of) launch angle may be the delineating factor between (the probability of) good or bad outcomes.
- (I am reluctant to dismiss exit velocity as a controllable element of pitcher performance, but that’s a discussion for another day. Rob Arthur, one of my favorite baseball geniuses, has insinuated pitcher control of exit velocity is not zero, and I think, intuitively, most of us would agree regardless of his evidence.)
- (I am also reluctant to say launch angle is the only delineating factor — just, perhaps, the most important one. Keep in mind this entire discussion concerns contact quality exclusively and ignores the whiffs/strikeouts/plate discipline components of pitcher performance.)
- Lastly: this is all pretty intuitive, right? Like, it’s important to confirm the relationship with data, but now that it’s confirmed, doesn’t it kind of feel like, no, duh?
I figure a couple of tables might do us some good. Who gains and loses when we look at pitch location of batted balls as a determinant of probable launch angle? Who incurs the most contact in advantageous and disadvantageous parts of the zone? “Say no more, fam.”
The table below describes the percentages of estimated launch angles between 18° and 22° (perhaps the most damaging pocket of angles), 12° and 27°, and 8° and 32° by pitcher in 2019 (min. 200 BBE). The lower the percentage of BBE in each range of launch angles, the better, ideally. This table depicts the simpler version of the model, which uses plate location but not pitch categories.
| Year | Name | BBE | 18 < xLA < 22 | 12 < xLA < 27 | 8 < xLA < 32 |
|---|---|---|---|---|---|
| 2019 | Gio Gonzalez | 245 | 11% | 37% | 56% |
| 2019 | Wade LeBlanc | 278 | 8% | 38% | 57% |
| 2019 | Tommy Milone | 329 | 5% | 34% | 57% |
| 2019 | Jordan Zimmermann | 382 | 5% | 34% | 59% |
| 2019 | Zack Greinke | 577 | 9% | 37% | 59% |
| 2019 | Zach Davies | 449 | 8% | 35% | 60% |
| 2019 | Masahiro Tanaka | 541 | 6% | 37% | 61% |
| 2019 | Mike Montgomery | 251 | 10% | 41% | 61% |
| 2019 | Dallas Keuchel | 275 | 7% | 37% | 64% |
| 2019 | Hyun-Jin Ryu 류현진 | 414 | 13% | 42% | 64% |
| 2019 | Eduardo Rodriguez | 469 | 13% | 46% | 65% |
| 2019 | Ryan Yarbrough | 235 | 7% | 41% | 66% |
| 2019 | Jon Lester | 337 | 11% | 46% | 66% |
| 2019 | Patrick Corbin | 506 | 11% | 44% | 66% |
| 2019 | Mike Leake | 469 | 10% | 40% | 66% |
| 2019 | Martin Perez | 365 | 14% | 45% | 66% |
| 2019 | Luis Castillo | 455 | 8% | 40% | 66% |
| 2019 | Wade Miley | 237 | 11% | 45% | 67% |
| 2019 | Anibal Sanchez | 357 | 13% | 48% | 67% |
| 2019 | Craig Stammen | 247 | 11% | 41% | 67% |
| 2019 | Aaron Nola | 522 | 14% | 45% | 67% |
| 2019 | Kenta Maeda | 390 | 11% | 46% | 67% |
| 2019 | Kevin Gausman | 287 | 14% | 46% | 68% |
| 2019 | Jason Vargas | 437 | 7% | 41% | 68% |
| 2019 | Miguel Castro | 204 | 7% | 46% | 68% |
| 2019 | Julio Teheran | 481 | 13% | 43% | 69% |
| 2019 | David Price | 247 | 13% | 53% | 69% |
| 2019 | Stephen Strasburg | 513 | 13% | 46% | 69% |
| 2019 | Blake Snell | 248 | 15% | 48% | 69% |
| 2019 | Luis Cessa | 230 | 10% | 40% | 70% |
| 2019 | Trevor Richards | 330 | 15% | 49% | 70% |
| 2019 | Jhoulys Chacin | 307 | 11% | 45% | 70% |
| 2019 | Cal Quantrill | 316 | 10% | 49% | 70% |
| 2019 | Zach Eflin | 493 | 10% | 44% | 70% |
| 2019 | Jake Arrieta | 416 | 14% | 49% | 71% |
| 2019 | Trevor Cahill | 260 | 12% | 49% | 71% |
| 2019 | Chris Stratton | 219 | 13% | 45% | 71% |
| 2019 | Jose Berrios | 568 | 13% | 51% | 72% |
| 2019 | Michael Pineda | 417 | 11% | 48% | 72% |
| 2019 | Jose Urena | 274 | 12% | 48% | 72% |
| 2019 | Zack Godley | 239 | 11% | 52% | 72% |
| 2019 | Trevor Williams | 461 | 14% | 52% | 72% |
| 2019 | Marcus Stroman | 413 | 9% | 47% | 72% |
| 2019 | Kyle Gibson | 464 | 14% | 51% | 72% |
| 2019 | Brad Peacock | 245 | 9% | 48% | 72% |
| 2019 | Merrill Kelly 켈리 | 413 | 10% | 48% | 72% |
| 2019 | Steven Brault | 290 | 16% | 50% | 72% |
| 2019 | Yonny Chirinos | 374 | 12% | 52% | 72% |
| 2019 | Max Scherzer | 369 | 16% | 51% | 73% |
| 2019 | Kyle Freeland | 342 | 18% | 53% | 73% |
| 2019 | Cole Hamels | 318 | 12% | 54% | 73% |
| 2019 | Jose Quintana | 507 | 16% | 48% | 73% |
| 2019 | Jose Suarez | 253 | 14% | 51% | 73% |
| 2019 | Julio Urias | 201 | 16% | 54% | 73% |
| 2019 | Mike Clevinger | 288 | 15% | 49% | 73% |
| 2019 | Carlos Carrasco | 221 | 12% | 50% | 73% |
| 2019 | Griffin Canning | 244 | 18% | 52% | 73% |
| 2019 | Ivan Nova | 541 | 11% | 49% | 73% |
| 2019 | Andrew Cashner | 455 | 15% | 51% | 73% |
| 2019 | Thomas Pannone | 211 | 12% | 54% | 73% |
| 2019 | Joey Lucchesi | 379 | 13% | 47% | 74% |
| 2019 | Spencer Turnbull | 427 | 10% | 50% | 74% |
| 2019 | Dario Agrazal | 248 | 14% | 50% | 74% |
| 2019 | J.A. Happ | 477 | 14% | 50% | 74% |
| 2019 | Peter Lambert | 312 | 13% | 50% | 74% |
| 2019 | Aaron Brooks | 348 | 13% | 51% | 74% |
| 2019 | Marco Gonzales | 484 | 15% | 50% | 74% |
| 2019 | Joe Musgrove | 450 | 16% | 52% | 74% |
| 2019 | Trent Thornton | 373 | 16% | 54% | 74% |
| 2019 | Yusei Kikuchi | 521 | 15% | 55% | 74% |
| 2019 | Dylan Bundy | 463 | 19% | 53% | 74% |
| 2019 | Luis Perdomo | 214 | 14% | 51% | 74% |
| 2019 | Mike Soroka | 492 | 12% | 48% | 74% |
| 2019 | Brett Anderson | 583 | 12% | 53% | 74% |
| 2019 | Ross Stripling | 239 | 17% | 55% | 74% |
| 2019 | Frankie Montas | 259 | 15% | 54% | 75% |
| 2019 | Yu Darvish | 258 | 13% | 52% | 75% |
| 2019 | Kevin McCarthy | 203 | 9% | 44% | 75% |
| 2019 | Taylor Clarke | 259 | 18% | 55% | 75% |
| 2019 | Sandy Alcantara | 582 | 14% | 51% | 75% |
| 2019 | Robbie Ray | 400 | 11% | 52% | 75% |
| 2019 | Shane Bieber | 530 | 18% | 55% | 75% |
| 2019 | League Average | 15% | 53% | 75% | |
| 2019 | Dillon Peters | 235 | 16% | 57% | 76% |
| 2019 | Adam Plutko | 351 | 18% | 56% | 76% |
| 2019 | Jakob Junis | 532 | 16% | 54% | 76% |
| 2019 | Justin Verlander | 470 | 15% | 58% | 76% |
| 2019 | Vince Velasquez | 322 | 13% | 55% | 76% |
| 2019 | Gabriel Ynoa | 377 | 11% | 50% | 76% |
| 2019 | Homer Bailey | 479 | 17% | 57% | 76% |
| 2019 | Jalen Beeks | 303 | 16% | 50% | 76% |
| 2019 | Junior Guerra | 219 | 17% | 53% | 76% |
| 2019 | Antonio Senzatela | 434 | 14% | 56% | 76% |
| 2019 | Tyler Mahle | 346 | 15% | 58% | 76% |
| 2019 | Jon Gray | 414 | 12% | 53% | 76% |
| 2019 | Charlie Morton | 428 | 16% | 56% | 76% |
| 2019 | Sonny Gray | 412 | 17% | 58% | 76% |
| 2019 | Pablo Lopez | 328 | 13% | 54% | 77% |
| 2019 | Felix Hernandez | 231 | 16% | 58% | 77% |
| 2019 | Miles Mikolas | 545 | 17% | 57% | 77% |
| 2019 | Jake Odorizzi | 327 | 18% | 63% | 77% |
| 2019 | Adam Wainwright | 379 | 16% | 55% | 77% |
| 2019 | Chris Paddack | 364 | 15% | 59% | 77% |
| 2019 | Jorge Lopez | 382 | 15% | 54% | 77% |
| 2019 | John Means | 461 | 13% | 56% | 77% |
| 2019 | Daniel Norris | 435 | 14% | 55% | 77% |
| 2019 | Jordan Lyles | 388 | 16% | 59% | 77% |
| 2019 | Adrian Houser | 293 | 15% | 55% | 77% |
| 2019 | Drew Smyly | 272 | 17% | 58% | 77% |
| 2019 | Felix Pena | 260 | 18% | 57% | 77% |
| 2019 | Javy Guerra | 234 | 18% | 58% | 77% |
| 2019 | Ariel Jurado | 407 | 15% | 53% | 77% |
| 2019 | Jeff Hoffman | 204 | 13% | 61% | 77% |
| 2019 | Andrew Heaney | 249 | 14% | 57% | 78% |
| 2019 | Domingo German | 388 | 15% | 54% | 78% |
| 2019 | Jacob deGrom | 464 | 19% | 61% | 78% |
| 2019 | Jaime Barria | 255 | 14% | 55% | 78% |
| 2019 | Jack Flaherty | 470 | 18% | 56% | 78% |
| 2019 | Adrian Sampson | 409 | 12% | 51% | 78% |
| 2019 | Mike Minor | 576 | 17% | 56% | 78% |
| 2019 | Kyle Hendricks | 512 | 17% | 54% | 78% |
| 2019 | Zack Wheeler | 563 | 12% | 51% | 78% |
| 2019 | Aaron Sanchez | 404 | 16% | 57% | 78% |
| 2019 | Tyler Beede | 354 | 17% | 60% | 78% |
| 2019 | Clayton Kershaw | 433 | 18% | 60% | 78% |
| 2019 | David Hess | 255 | 15% | 55% | 78% |
| 2019 | Nick Pivetta | 279 | 18% | 59% | 78% |
| 2019 | Glenn Sparkman | 470 | 17% | 55% | 79% |
| 2019 | Brad Keller | 498 | 16% | 60% | 79% |
| 2019 | German Marquez | 493 | 17% | 60% | 79% |
| 2019 | Chase Anderson | 322 | 15% | 54% | 79% |
| 2019 | Chris Sale | 337 | 14% | 57% | 79% |
| 2019 | Matthew Boyd | 469 | 15% | 57% | 79% |
| 2019 | Michael Wacha | 324 | 18% | 59% | 79% |
| 2019 | Madison Bumgarner | 355 | 21% | 63% | 79% |
| 2019 | Dakota Hudson | 518 | 16% | 58% | 80% |
| 2019 | Lance Lynn | 469 | 17% | 57% | 80% |
| 2019 | Anthony DeSclafani | 278 | 17% | 63% | 80% |
| 2019 | Danny Duffy | 379 | 17% | 62% | 80% |
| 2019 | Mike Foltynewicz | 335 | 18% | 61% | 80% |
| 2019 | Max Fried | 461 | 16% | 58% | 80% |
| 2019 | Chris Archer | 312 | 15% | 57% | 80% |
| 2019 | Shaun Anderson | 302 | 16% | 57% | 80% |
| 2019 | Wei-Yin Chen | 217 | 18% | 63% | 81% |
| 2019 | Tanner Roark | 472 | 17% | 55% | 81% |
| 2019 | Chris Bassitt | 337 | 15% | 61% | 81% |
| 2019 | Brandon Woodruff | 311 | 17% | 60% | 81% |
| 2019 | Matt Strahm | 328 | 16% | 63% | 81% |
| 2019 | Trevor Bauer | 461 | 23% | 63% | 81% |
| 2019 | Jeff Samardzija | 380 | 15% | 63% | 82% |
| 2019 | Dereck Rodriguez | 275 | 21% | 64% | 82% |
| 2019 | James Paxton | 299 | 22% | 60% | 82% |
| 2019 | Framber Valdez | 211 | 18% | 63% | 82% |
| 2019 | Wilmer Font | 220 | 19% | 60% | 82% |
| 2019 | Derek Holland | 232 | 21% | 64% | 82% |
| 2019 | Lucas Giolito | 411 | 19% | 63% | 82% |
| 2019 | Gerrit Cole | 432 | 18% | 63% | 83% |
| 2019 | Sam Gaviglio | 275 | 12% | 57% | 83% |
| 2019 | Caleb Smith | 398 | 20% | 62% | 83% |
| 2019 | Zach Plesac | 338 | 21% | 64% | 83% |
| 2019 | Noah Syndergaard | 553 | 17% | 62% | 84% |
| 2019 | Eric Lauer | 324 | 19% | 65% | 84% |
| 2019 | Tyler Skaggs | 221 | 21% | 64% | 84% |
| 2019 | Elieser Hernandez | 225 | 18% | 62% | 84% |
| 2019 | Reynaldo Lopez | 558 | 19% | 59% | 84% |
| 2019 | Mike Fiers | 541 | 17% | 63% | 84% |
| 2019 | Steven Matz | 462 | 21% | 64% | 84% |
| 2019 | Dylan Cease | 206 | 14% | 59% | 85% |
| 2019 | Walker Buehler | 388 | 20% | 63% | 85% |
| 2019 | Freddy Peralta | 218 | 22% | 65% | 85% |
| 2019 | Rick Porcello | 566 | 22% | 67% | 86% |
| 2019 | Drew Pomeranz | 245 | 23% | 66% | 89% |
Click headers to sort!
If I considered every pitcher from the last three years, the table would be grossly long, so feel free to inquire about a specific pitcher in the comments if someone’s missing.
Further Musings
Unsurprisingly, upon my presentation of these results to him, Kurcon identified other strong relationships with launch angle through average vertical movement…
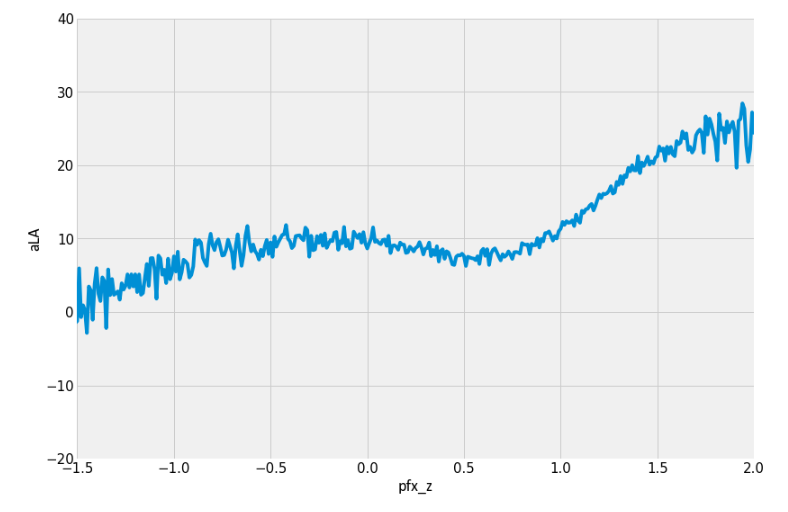
(Click to enlarge.)
… as well as the difference of a particular amount of vertical movement from the average vertical movement for a given pitch type, which may bear a stronger, or at least steeper, relationship (four-seamers pictured below):
(Click to enlarge.)
He admits there likely is collinearity (a shared relationship) with pitch height, and that’s true. Pitch height is influenced by command but also by where the pitch moves relatives to its original release point. I touch on this point earlier; breaking pitches, because of their purpose and by virtue of their movement, will typically end up lower in the zone than a fastball.
The existence of collinearity doesn’t make either relationship less meaningful — in fact, it further affirms the idea that it’s not pitch type that matters as much as pitch location. But any distinctions related to movement within pitch type can be meaningful.
* * *
More food for thought for me investigate further: balls in play comprise roughly one-sixth of all pitch outcomes — a relatively small fraction of pitches thrown. Should a pitcher’s distribution of pitch locations among batted balls reflect his distribution of pitch locations overall? Is this overall distribution more indicative (i.e., predictive) of the pitcher’s future success than his distribution for batted balls only? If Player X grooves 50% of his pitches, but only 40% of his batted ball events come against grooved pitches, has he benefited disproportionately?
* * *
All of this seems to me hugely instructive of why a command artist Zack Greinke (or Cy Young candidate Hyun-Jin Ryu, or recent late-career bounce-back Aníbal Sánchez) can suppress contact quality so successfully. And, yes, it makes me reconsider my slander against Shane Bieber, who thrives on command but has allowed grotesque expected wOBAcon (xwOBAcon) numbers since his debut (although, to my credit, he is merely average per the table above).
* * *
One pitcher who brings up an interesting predicament for me, though, is Jacob deGrom. He has suppressed contact quality spectacularly the last two years — and yet he ranks fairly poorly by measure of “estimated” launch angles above, suggesting he lives too much in the zone where hitters could thrive. Meanwhile, Kurcon’s pCRA posits that barrels add more valuable to ERA estimators than either fly balls or home runs alone — barrels, which combine optimal fly ball rates and exit velocities into a catch-all metric — while Dan Richards‘ Forecasted Run Average (FRA) uses average exit velocity and average launch angle to devise an estimator similarly superior to FIP, xFIP, or SIERA.
The convergence of all these things — of pCRA, of FRA, of deGrom’s success — suggests to me there is still a component of pitcher contact quality allowed not uncovered yet, one that might still be explained by pitch types. Because I can’t shake how the average change-up, slider, and splitter still performs better than the average fastball with respect to exit velocity on non-bunt batted balls:
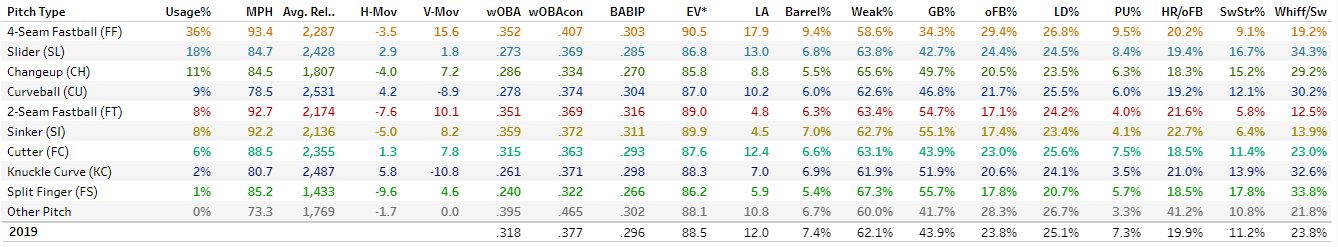
(Click to enlarge.)
Does deGrom’s ability to induce whiffs reflect an inability among hitters to square up his pitches? In terms of launch angle tightness among nearly 200 pitchers who allowed 200 BBE in 2019, deGrom ranks 5th-best, at +29.8°. Michael Pineda, who actually fares above-average in terms of “estimated launch angles,” ranked 2nd-worst by measure of angle variance, at +25.0°. German Márquez (+25.7°) and Jon Gray (+25.8°) ranked 20th- and 22nd-worst, respectively. (Maybe it’s launch angle variance, not average, we should care more about.)
If we know launch angle variance is tightest at the heart of the zone (around 25°… just like Pineda…) and loosest the farther away we deviate (around 29°-30°… just like deGrom…), then it makes sense that deGrom (excellent command) might excel despite his “poor” outcomes in the table above, whereas Pineda and Gray (groove city) really under-perform. Bieber ranks in the lower quintile (39th-worst) of launch angle variance, at +26.2°. This might be whiff-related (Bieber commands his fastball, but it’s extremely vulnerable in terms of inducing very few whiffs). But it also seems like it might still be a simple matter of pitch height. And this tracks, right? Based on everything we know about these pitchers? I feel like this matters.
(Also, let’s acknowledge that deGrom’s “poor” outcomes do not comprehensively account for all pertinent variables. As Kurcon observed, movement matters, too! And, invariably, horizontal plate location, which I don’t even touch on here!)
To-do list:
- How predictive of launch angle is pitch location?
- What’s the relationship between launch angle variance and (vertical) movement?
- How does this all look from the hitter side of things?
- (Note to self: look at Christian Yelich.)
- In terms of pitch height (or location in general), is it wiser to use all pitches (Pitch%) rather than just batted ball events (BBE%, roughly one-sixth of all pitches)?
- To re-frame the question: ideally, the distribution of pitch height/location among BBE mirrors that of pitch height/location among all pitches. Do dramatic differences between the two indicate good/bad luck? Would using all pitches be more indicative of pitcher skill, because they can control how often they throw to, but not how often a hitter will swing, in a certain part of the zone?
* * *
I hand this hot potato back to Kurcon. I know he already has ideas brewing about pitcher exit velocity.
I’d dive farther into how zone coverage in general effects EV and LA. That could play a big part to the rest of this.
Alex,
Great stuff – very professional! I greatly appreciate the article. Wow, there’s a lot of detailed reading in it. So, please forgive me when I say I skimmed over a lot of it. One aspect I was thinking about and didn’t see mentioned was the pitcher’s ability to keep the batter guessing. Two ways of doing this that I recall most clearly were stated by Pedro Martinez and Greg Maddux.
Pedro Martinez said that early in his career he diligently worked on keeping everything as concealed as possible until as late as possible in his delivery. This entailed keeping his arms in tight to the body, concealing his hand and wrist movement when he was gripping the ball inside his glove, keeping his hand hidden in the glove as long as possible during the delivery, and mirroring his motion, arm slot and release as much as possible regardless of the pitch type.
Greg Maddux stated that he always changed speeds and locations while trying to make balls look like strikes and strikes look like balls.
Of course, both of these guys innately understood and could execute with impeccable command the “no duh” elements you mentioned. But, my point is that “keeping them guessing” may be a critical element beyond just what the ball is doing on a given pitch. I guess the comment about Maddux is about what the ball is doing, but more about what he’s throwing and where he’s throwing it than about what it’s doing after he releases it.
Thanks!
I would be entirely unsurprised to learn that sequencing and/or varied pitch location suppresses hitter effectiveness. I do not touch upon it here so no worries about missing it. This post from Ethan Moore does some great work on the subject of sequencing and, in essence, creating a score for a pitcher’s predictability or unpredictability. I’d love to see Pedro’s or Maddux’s scores for this. Moreover, I think (if I were able to reproduce it) it could make for great research fodder!
Great article! Do you think adjusting for pitch count would lower the variability in LA? Can you include the batter’s average EV in the model?
Definitely something I think worth exploring, although Connor looked into something like that is and found almost no evidence of it being helpful. But I wonder if we need to look beyond average EV and at hard-hit rate, or something that better exemplifies the predictive elements of hitter skill. I do think there’s something to be said of hitter skill, as you’re hypothesizing here! It’s just that it’s also possible the average pitcher faces roughly the same average skill level over the course of the season, hence not a helpful predictor or descriptor.
Really interesting stuff! I’m wondering if the statistical irrelevance of horizontal location has more to do with a lack of spray angle data than anything else? Obviously, outcomes change on a ball with an identical EV/LA depending on where in the field it’s hit – with a heavily shifted infield, the expected value of a 90 MPH ground ball is going to be radically different depending on whether it’s hit pull-side or oppo, and that’s 1000% something a pitcher can control to some extent with side to side pitch location. I’m sure there will be plenty of research to do on this once we have Hawkeye data in a few weeks!
I wouldn’t say horizontal location is irrelevant — just not as important. But there is definitely a consistent pattern where, as you stray farther from the lateral center of the plate, launch angle gets shallower, and that’s basically at all pitch heights.