Juiced Baseball: Pitcher Evaluation Changes
I’ve screwed up. A lot. A few years back, I created a pitching metric called pERA which took each individual pitch’s results (swinging-strike and groundball rate) and combined them into one metric. The problem was that I wrote the article in 2016 and used a formula I created back in 2015 with 2002-2015 data. The juiced ball arrived and I never adjusted the formula for the change. Oopsy.
I felt a little sick when it finally dawned on me that the formula needed updating and ma initial findings are available in this Twitter thread.
I've invested too much time this morning looking into GB%, ERA, and ERA estimators. Two conclusions:
1. Happy Fun Ball has everything messed up. Don't assume any previous assumptions are true.
2. Groundball pitchers are ruling the day.1/6
— Jeff Zimmerman (@jeffwzimmerman) August 16, 2019
It finally dawned on me that the formula I was using to evaluate pitchers was off. With strikeouts and walks being equal, groundball pitchers outperform flyball pitchers. With a deadened ball, a high flyball rate meant most flyballs would go for easy outs. Not any more. Now those flyballs go for home runs. It’s time for a little math to show the change.
First, here are the HR/9 rates from the past 10 seasons.
| Season | HR/9 |
|---|---|
| 2010 | 0.96 |
| 2011 | 0.94 |
| 2012 | 1.02 |
| 2013 | 0.96 |
| 2014 | 0.86 |
| 2015 | 1.02 |
| 2016 | 1.17 |
| 2017 | 1.27 |
| 2018 | 1.16 |
| 2019 | 1.40 |
It’s easy to spot the change with the 2019 season being over a 0.5 HR/9 increase from 2014. I decided to group the seasons into three similar rates.
Baseball: Seasons
Normal: 2010 to 2015 (~1.00 HR/9)
Juiced: 2016 & 2018 (~1.15 HR/9)
Happy: 2017 & 2019 (~1.35 HR/9)
Back in 2015, I compared the ratio of ERA to kwERA (ERA based on just strikeouts and walks) over different groundball rates and here are the results:
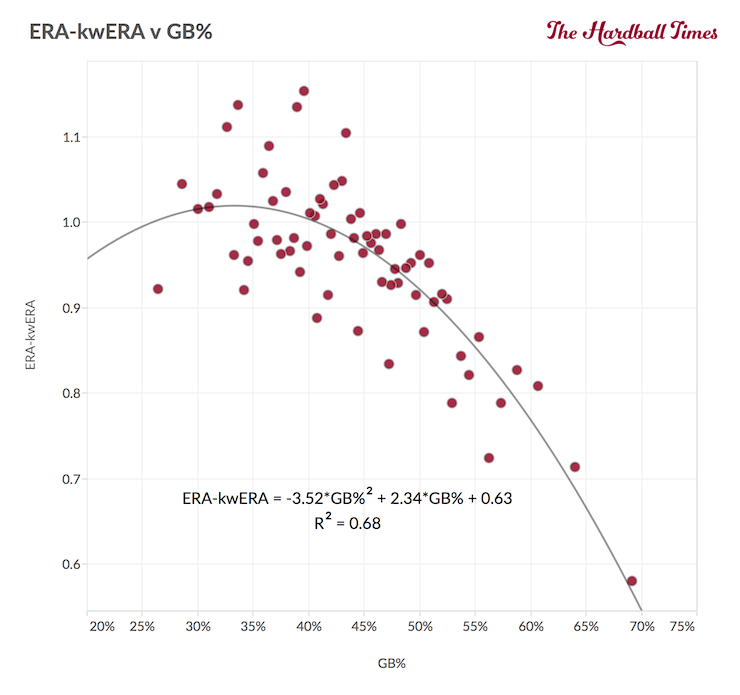
While noisy, it showed that generating groundballs helped a pitcher outperform their expected ERA. I decided to revisit this chart with the new balls. Here are the graphs for the three baseball types. I looked at any pitcher with 30 IP in the time frames.
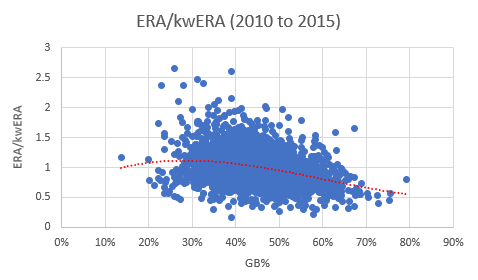
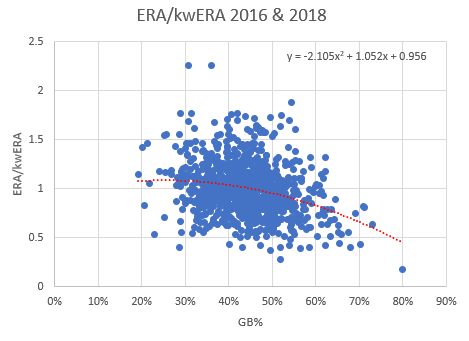
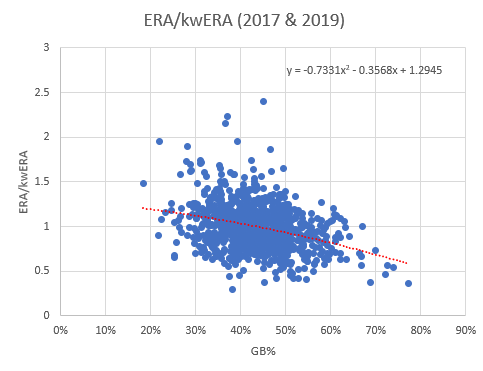
The parabolic line straightens out with almost no curve in the final graph. The two big keys to take away from the graphs.
- With all three ball types, groundball pitchers have an advantage.
- With this past season’s ball, it the first time allowing more and more flyballs hurt a pitcher’s bottom line. Usually, the effect of flyballs levels off or drops.
When I originally created pERA, it was to help show that high flyball pitchers outperform their xFIP. With the 2019 ball, xFIP is a great short cut to get a pitcher’s talent.
Using my historic formula and the two new ones, I decided to compare values for the 2019 qualified starters on each end of the groundball spectrum, Dakota Hudson (57% GB%) and Reynaldo Lopez (35% GB%). Here are their 2019 pERA values using the three different formulas.
Note: The final 2019 pERA spreadsheet found here using the “Happy” formula.
Hudson
Normal: 4.55 pERA
Juiced: 4.71
Happy: 4.58
Lopez
Normal: 4.35 pERA
Juiced: 4.54
Happy: 4.60
Hudson doesn’t have much of a range in values. On the other hand, Lopez no longer gets a bonus for the high flyball rate.
With this knowledge, don’t just focus on acquiring groundball pitchers. Strikeouts and walks drive results but if two pitchers have similar plate control numbers, get the pitcher generating the most groundballs.
Also, the ball may not change as I project so I have a couple of other formulas now to be able to adjust evaluations on the fly.
I’m sure there is more individual pitcher analysis that needs to be done, but I need to let my head absorb the changes. The information can be confusing so feel to ask any questions. For now, I’m off to help others (and myself) pinpoint which hitters can be helped and hurt by the changing ball.
Jeff, one of the authors of the fantasy baseball guide,The Process, writes for RotoGraphs, The Hardball Times, Rotowire, Baseball America, and BaseballHQ. He has been nominated for two SABR Analytics Research Award for Contemporary Analysis and won it in 2013 in tandem with Bill Petti. He has won four FSWA Awards including on for his Mining the News series. He's won Tout Wars three times, LABR twice, and got his first NFBC Main Event win in 2021. Follow him on Twitter @jeffwzimmerman.
Jeff, What is causing Hudson’s juiced ball pERA to be higher than his happy ball ERA? Thanks
His 4.4 BB /9. He had a 4.93 xFIP
Jeff, Just to clarify, I’m assuming your using the player’s same 2019 stats and are just applying 3 separate formulas (normal, juiced and happy). Is that correct? If so, could you explain how 4.4 BB/9 and 4.93 xFIP can cause this to happen? Sorry, I won’t pretend to be a stats guru, but I expected to see an increase in each formula’s pERA based on the increased HR rate for each (and I couldn’t understand your spreadsheet). Thanks
Hudson’s Fangraphs page shows him with a 4.93 FIP and 4.55 xFIP. Lopez is showing 5.04 FIP and 5.27 xFIP.
Hey Jeff,
If the unthinkable happens, and the HR rate continues to rise, what will you call the next tier of the juiced ball? The boom-boom ball?
Manfred’s f’ing joke