Ideal In-Season Overall Talent Evaluation Stat
The 2020 and ’21 seasons have created a unique fantasy baseball environment that has never existed. One of the biggest challenges is evaluating players. It’s been almost 18 months since there have been games across all levels. Players have changed for the good and bad. There is just no way to know how much with everyone hidden at the alternate sites. For hitters, xwOBA and a Barrel% formula can be a solution to spot and verify some breakouts.
With hitters, I find they change at a slower rate. While pitchers can change a pitch’s shape or its usage overnight, hitters can’t immediately change their batting eye or gain 50-home run power. It’s going to be subtle changes that won’t be noticeable for a few weeks. Still, I want to try to be one step ahead of these unknown adjustments by using the best indicators and hope to marry these best estimates from long-range projections.
I’ve moved off of relying on a single estimate since being inspired by “The Model Thinker” by Scott Page. The author states, “do not put too much faith in one model”. I’ve used this inspiration to create my own projections and I believe his point needs to be restated:
“The lesson should be clear: if we can construct multiple diverse, accurate models, then we can make very accurate predictions and valuations and choose good actions.
…Keep in mind, these second and third models need not be better than the first model. They could be worse. If they are a little less accurate, but categorically (in the literal sense) different, they should be added to the mix. “
My focus is to project good players, not the individual components (e.g. batting average and stolen bases). If a player is good, they’ll play, and at least contribute Runs and RBI in Roto. In points-based leagues, a hitter’s overall talent correlates better with the scoring system, so it’s even better. While I had planned on starting my research from scratch, there was no need. I found a couple of great articles with most of the work already done.
The first was by Craig Edwards when he stated the following here at FanGraphs
There is still a bunch of noise and the relationship isn’t incredibly strong, but it appears from the data we have that xwOBA, in small sample sizes, might predict future wOBA better than wOBA itself does.
The other one was at MLB.com where Sam Sharpe goes through several expected stats and comes up with these two conclusions:
xwOBA predicts future wOBA well with small sample sizes. If a player has had little service time or has made a major swing change this year, maybe it’s best to trust xwOBA rather than wOBA.
and
Barrel% is easy to use and predictive of future success on balls in play.
First and foremost, xwOBA seems to be the ideal stat to use for in-season talent evaluation. Out of the 11 factors shown on a hitter’s BaseballSavant page, it’s the one fantasy managers need to focus on.
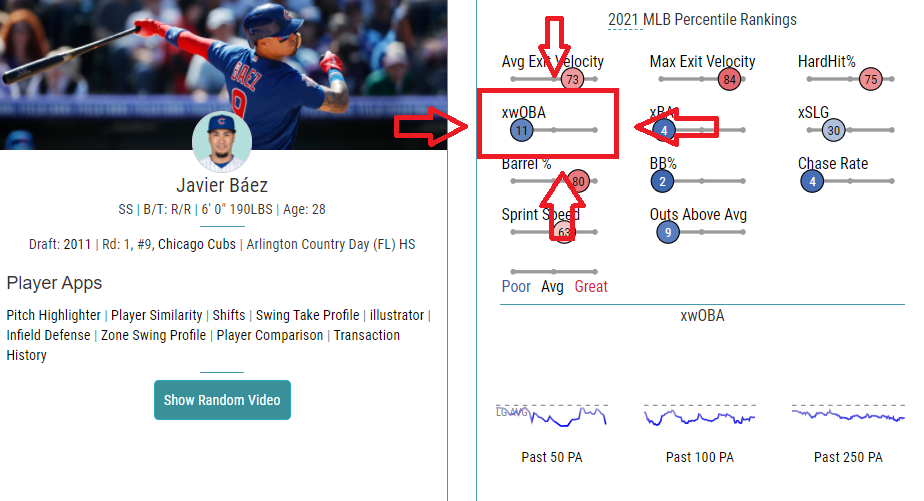
About everything else on the image can be ignored when projecting rest-of-season talent. Tom Tango, the creator of them, admits they are just descriptive in nature.
Tango then stressed that the expected metrics were only ever intended to be descriptive, that they were not designed to be predictive, and that if they had been intended to be predictive, they could have been designed differently or other metrics could be used.
Just be careful when using any of Savant’s expected stats to predict future production.
Going to several individual hitters’ pages can take time but there are xwOBA leaderboards available at Savant (regular and percentile) and here at FanGraphs. I like to use the percentile table when comparing players to get a quick assessment of how much the hitters differ.
One major issue is that xwOBA is not regressed at all so players with small samples stick out. Here is an example of several low plate appearance hitters ranked ahead of Bryce Harper.
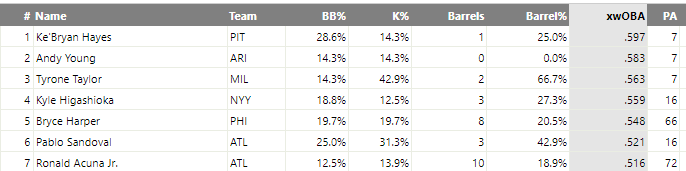
Ideally, it would be best to regress the xwOBA. I can’t find the amount and can’t create it since FanGraphs is just getting the xwOBA values from Savant. I don’t have access to the raw numbers and formulas. I sort of reverse engineer the stabilization rate to be around to 65 plate appearances. The value seems a little small, but it does temper the extreme values caused by small samples. Using .3145 xwOBA as the league average, here are the regressed xwOBA values for the same seven hitters
Regressed xwOBA = (league xwOBA x 65 + hitter xwOBA x PA)/(65 + PA)
| Name | xwOBA | Regressed xwOBA | Diff |
|---|---|---|---|
| Ke’Bryan Hayes | .597 | .342 | -.255 |
| Andy Young | .583 | .341 | -.242 |
| Tyrone Taylor | .563 | .314 | -.249 |
| Kyle Higashioka | .559 | .363 | -.196 |
| Bryce Harper | .548 | .432 | -.116 |
| Pablo Sandoval | .521 | .355 | -.166 |
| Ronald Acuna Jr. | .516 | .420 | -.096 |
While everyone dropped, Harper and Acuna don’t as much and now project better than the other five. While most people will do some regression in their head knowing the plate appearance difference, so standard is nice.
Using xwOBA is a nice and simple solution to evaluating a hitter’s talent based on just that season. And more many fantasy managers, that’s, but I never do things nice and easy.
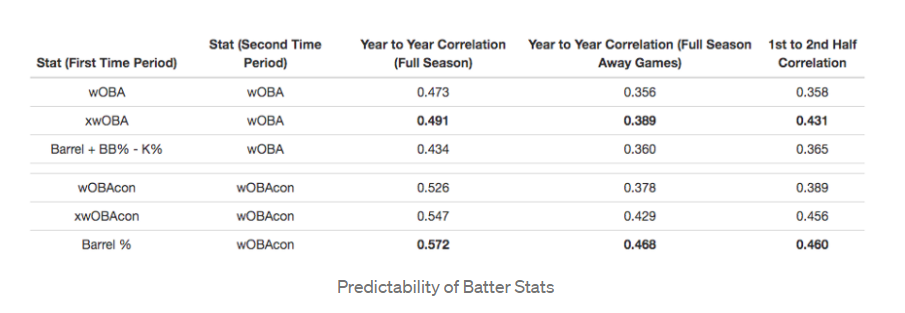
From Sam Sharpe’s work, I that Barrel% correlated with xwOBA. Here is more of what he had to say.
It’s amazing how much information we can maintain by throwing out all the other batted ball types. For batters, Barrel% is almost just as reliable a skill as xwOBAcon.
And here is the table he used to compare the different values.
While it was not the best formula, the BB%+Barrel%-K% interested me. To find minor league breakouts, I found what traits they had in common. It was simple, they were better than league average in each of strikeout rate, walk rate, power, and the ability to put the ball in the air. Good plate discipline and hit line drives.
I recreated the BB%+Barrel%-K% value but I regressed each value before adding them together.
First, here is a comparison of both of the regressed values on a percentile rank.
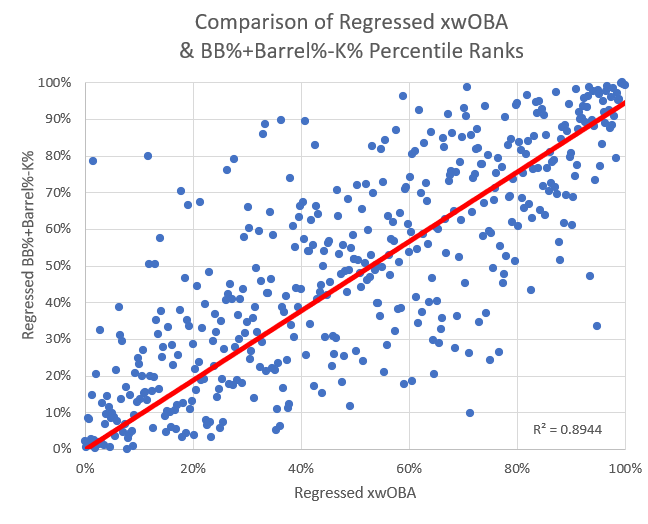
Not a perfect relationship, but most of the time, the two metric line up. Just for reference, here are the leaders and laggards when the two values are averaged together.
| Name | Regressed xwOBA | Regressed BB%+Barrel%-K% | Average |
|---|---|---|---|
| Freddie Freeman | 100% | 100% | 100% |
| Juan Soto | 100% | 99% | 100% |
| Ronald Acuna Jr. | 100% | 100% | 100% |
| Bryce Harper | 99% | 100% | 100% |
| Corey Seager | 98% | 98% | 98% |
| Asdrubal Cabrera | 97% | 99% | 98% |
| Manny Machado | 99% | 97% | 98% |
| Vladimir Guerrero Jr. | 99% | 95% | 97% |
| Jose Ramirez | 97% | 98% | 97% |
| Will Smith | 99% | 95% | 97% |
| Dustin Fowler | 5% | 0% | 3% |
| Franchy Cordero | 4% | 1% | 2% |
| Cristian Pache | 2% | 2% | 2% |
| Ryan Jeffers | 2% | 2% | 2% |
| Teoscar Hernandez | 3% | 1% | 2% |
| Anthony Alford | 1% | 3% | 2% |
| Martin Maldonado | 0% | 2% | 1% |
| Jackie Bradley Jr. | 2% | 0% | 1% |
| Leody Taveras | 0% | 2% | 1% |
| Javier Baez | 0% | 1% | 0% |
Nothing seems out of place except Asdrubal Cabrera over say … Mike Trout (#23). Here is how both have performed so far this season.
| Name | PA | BB% | K% | Barrel% | xwOBA | wOBA |
|---|---|---|---|---|---|---|
| Mike Trout | 65 | 20.0% | 30.8% | 25.0% | .481 | .523 |
| Asdrubal Cabrera | 63 | 15.9% | 9.5% | 8.5% | .350 | .320 |
The issue when looking only at 2021, Trout’s 25.0% Barrel% is getting regressed down to 14.9%. But everyone knows Trout’s historic production, so it can be paired with this season’s data to create a composite valuation. That said, Trout’s 10% point increase in K% from his career average (21% to 31%) does raise a red flag and is keeping him from being included with the elite hitters.
One issue I noticed with the Barrel% formula is that hitters with Junior-high scholar’s bowl power (don’t @ me, I know my kind) will be over projected until the regression amount becomes irrelevant. It’s the opposite issue Trout had.
When determining a hitter’s talent from just this season’s stats, focus on xwOBA but remember to take playing time into account. If a person wants a backup stat, a regressed BB%+Barrel%-K% will work. When they are paired with multi-season projections, hopefully, some now struggling breakouts can be spotted.
Jeff, one of the authors of the fantasy baseball guide,The Process, writes for RotoGraphs, The Hardball Times, Rotowire, Baseball America, and BaseballHQ. He has been nominated for two SABR Analytics Research Award for Contemporary Analysis and won it in 2013 in tandem with Bill Petti. He has won four FSWA Awards including on for his Mining the News series. He's won Tout Wars three times, LABR twice, and got his first NFBC Main Event win in 2021. Follow him on Twitter @jeffwzimmerman.
Love the article. It amazes me the way the analysis has evolved over time.
Thanks