Failure to Launch
Welcome back to the internet’s premier home for breaking down any and all minutiae from a 2006 Matthew McConaughey vehicle that inexplicably co-starred a naked Terry Bradshaw. Jay Kay, let’s talk about baseball dongs instead. Or rather, the lack of them.
Last time out, we looked at three players that have started 2022 out with a fizzle but had some underlying metrics that point to better times ahead. In case you missed it, we’re splitting 2022 into two periods – the first month of the season (up until May 8), as well as the time since (stats through June 15th). Besides looking at the raw HR per PA rates, we’ll also use percentile rankings to better capture how players compare to their peers, as to see better into the relative changes without being dragged down too much by the new offensive environment (new ball, humidors, etc).
But after checking in on glasses that were half full, let’s now play a reverse card and take a peek at three players that have not only sputtered on early power but whose drops are supported by some rusty scaffolding.
Here are the players in 2022 with a HR per PA rate that has dropped by a minimum of 10 percentile points compared to what it was in 2021:
| Player | 2021 PA | 2022 PA | 2021 HR/PA | 2022 HR/PA | HR/PA +/- | 2021 Percentile Rank | 2022 Percentile Rank | Rank +/- |
|---|---|---|---|---|---|---|---|---|
| Yasmani Grandal | 375 | 201 | .061 | .010 | -.051 | 93 | 12 | -82 |
| Austin Meadows | 591 | 144 | .046 | .000 | -.046 | 76 | 0 | -75 |
| Javier Báez | 547 | 203 | .057 | .015 | -.042 | 89 | 23 | -67 |
| Avisaíl García | 515 | 202 | .056 | .020 | -.037 | 87 | 22 | -66 |
| Elias Díaz | 371 | 155 | .049 | .013 | -.036 | 80 | 16 | -64 |
| Tyler O’Neill | 537 | 168 | .063 | .018 | -.045 | 95 | 32 | -63 |
| Franmil Reyes | 466 | 145 | .064 | .021 | -.044 | 96 | 37 | -59 |
| Jesse Winker | 485 | 260 | .049 | .015 | -.034 | 80 | 23 | -57 |
| Max Muncy | 592 | 188 | .061 | .021 | -.040 | 93 | 39 | -54 |
| Marcus Semien | 724 | 268 | .062 | .022 | -.040 | 94 | 42 | -52 |
| Robbie Grossman | 671 | 181 | .034 | .000 | -.034 | 51 | 0 | -51 |
| AJ Pollock | 422 | 169 | .050 | .018 | -.032 | 81 | 32 | -49 |
| Teoscar Hernández | 595 | 155 | .054 | .019 | -.034 | 85 | 37 | -48 |
| Adam Duvall | 555 | 222 | .068 | .027 | -.041 | 98 | 51 | -47 |
| César Hernández | 637 | 285 | .033 | .000 | -.033 | 47 | 0 | -47 |
| Joey Votto | 533 | 189 | .068 | .026 | -.041 | 97 | 52 | -45 |
| Andrew McCutchen | 574 | 213 | .047 | .019 | -.028 | 78 | 33 | -44 |
| Justin Turner | 612 | 234 | .044 | .017 | -.027 | 72 | 28 | -44 |
| Freddie Freeman | 695 | 273 | .045 | .018 | -.026 | 74 | 30 | -43 |
| Eduardo Escobar | 599 | 252 | .047 | .020 | -.027 | 77 | 35 | -41 |
| Lourdes Gurriel Jr. | 541 | 218 | .039 | .014 | -.025 | 61 | 20 | -41 |
| Wil Myers | 500 | 134 | .034 | .007 | -.027 | 50 | 9 | -41 |
| Nick Castellanos | 585 | 255 | .058 | .027 | -.031 | 92 | 53 | -39 |
| Darin Ruf 러프 | 312 | 210 | .051 | .024 | -.027 | 83 | 47 | -36 |
| Ryan McMahon | 596 | 248 | .039 | .016 | -.022 | 60 | 25 | -35 |
| Matt Olson | 673 | 280 | .058 | .029 | -.029 | 91 | 57 | -34 |
| Rafael Ortega | 330 | 167 | .033 | .012 | -.021 | 48 | 15 | -33 |
| Andrew Benintendi | 538 | 252 | .032 | .008 | -.024 | 44 | 11 | -33 |
| Bobby Dalbec | 453 | 180 | .055 | .028 | -.027 | 87 | 54 | -33 |
| Ramón Laureano | 378 | 131 | .037 | .015 | -.022 | 56 | 24 | -32 |
| Cedric Mullins | 675 | 275 | .044 | .022 | -.023 | 73 | 41 | -32 |
| Brandon Belt | 381 | 121 | .076 | .033 | -.043 | 100 | 68 | -32 |
| Josh Donaldson | 543 | 191 | .048 | .026 | -.022 | 79 | 48 | -31 |
| Ketel Marte | 374 | 245 | .037 | .016 | -.021 | 58 | 27 | -31 |
| Ryan Jeffers | 293 | 152 | .048 | .026 | -.021 | 79 | 49 | -30 |
| Jonathan Villar | 505 | 134 | .036 | .015 | -.021 | 54 | 24 | -30 |
| Lorenzo Cain | 286 | 148 | .028 | .007 | -.021 | 37 | 7 | -30 |
| Jorge Polanco | 644 | 250 | .051 | .028 | -.023 | 82 | 53 | -30 |
| Nelson Cruz | 584 | 244 | .055 | .029 | -.026 | 86 | 57 | -29 |
| Josh Bell | 568 | 264 | .048 | .027 | -.021 | 79 | 51 | -27 |
| Brandon Crawford | 549 | 220 | .044 | .023 | -.021 | 70 | 43 | -27 |
| J.T. Realmuto | 537 | 226 | .032 | .013 | -.018 | 44 | 18 | -26 |
| Dylan Carlson | 619 | 174 | .029 | .017 | -.012 | 41 | 15 | -25 |
| Enrique Hernández | 585 | 238 | .034 | .017 | -.017 | 51 | 27 | -24 |
| Garrett Cooper | 250 | 220 | .036 | .018 | -.018 | 54 | 32 | -22 |
| Andy Ibáñez | 272 | 128 | .026 | .008 | -.018 | 33 | 11 | -22 |
| Mike Zunino | 375 | 123 | .088 | .041 | -.047 | 100 | 78 | -22 |
| Yoshi Tsutsugo | 262 | 135 | .031 | .015 | -.016 | 43 | 21 | -22 |
| Brandon Lowe | 615 | 133 | .063 | .038 | -.026 | 95 | 74 | -21 |
| José Abreu | 659 | 255 | .046 | .035 | -.010 | 75 | 54 | -21 |
| Harrison Bader | 401 | 224 | .040 | .022 | -.018 | 62 | 42 | -20 |
| Trea Turner | 646 | 264 | .043 | .027 | -.017 | 69 | 50 | -19 |
| Mike Yastrzemski | 532 | 205 | .047 | .029 | -.018 | 77 | 58 | -19 |
| Miguel Cabrera | 526 | 201 | .029 | .015 | -.014 | 40 | 22 | -18 |
| Seth Brown | 307 | 200 | .065 | .040 | -.025 | 96 | 78 | -18 |
| Ian Happ | 535 | 238 | .047 | .029 | -.017 | 76 | 59 | -17 |
| Ronald Acuña Jr. | 360 | 155 | .067 | .039 | -.028 | 96 | 80 | -17 |
| Amed Rosario | 588 | 219 | .019 | .000 | -.019 | 17 | 0 | -17 |
| Tony Kemp | 397 | 229 | .020 | .004 | -.016 | 21 | 5 | -16 |
| Randal Grichuk | 545 | 199 | .040 | .025 | -.015 | 64 | 47 | -16 |
| Brett Phillips | 292 | 134 | .045 | .030 | -.015 | 73 | 58 | -15 |
| Tucker Barnhart | 388 | 136 | .018 | .000 | -.018 | 15 | 0 | -15 |
| Xander Bogaerts | 603 | 252 | .038 | .024 | -.014 | 59 | 44 | -15 |
| José Iglesias | 511 | 194 | .018 | .000 | -.018 | 15 | 0 | -15 |
| Frank Schwindel | 259 | 238 | .054 | .034 | -.020 | 85 | 71 | -15 |
| Salvador Perez | 665 | 212 | .072 | .042 | -.030 | 99 | 84 | -14 |
| Yuli Gurriel | 605 | 223 | .025 | .013 | -.011 | 31 | 19 | -12 |
| Carlos Santana | 659 | 180 | .029 | .017 | -.012 | 40 | 28 | -12 |
| Willi Castro | 450 | 144 | .020 | .014 | -.006 | 20 | 8 | -12 |
| Rhys Hoskins | 443 | 264 | .061 | .049 | -.012 | 93 | 82 | -11 |
| Dansby Swanson | 653 | 255 | .041 | .035 | -.006 | 65 | 54 | -11 |
| Jacob Stallings | 427 | 162 | .019 | .012 | -.006 | 18 | 7 | -11 |
| Luis Robert | 296 | 205 | .044 | .029 | -.015 | 71 | 61 | -11 |
| Trent Grisham | 527 | 236 | .028 | .017 | -.012 | 39 | 29 | -10 |
| Gary Sánchez | 440 | 193 | .052 | .036 | -.016 | 84 | 73 | -10 |
| Ozzie Albies | 686 | 263 | .044 | .030 | -.013 | 70 | 61 | -10 |
Before checking in on someone who hasn’t been a complete anchor, let’s start by clearing the tracks of some pure fantasy wreckage.
Yasmani Grandal
- 2021: 23 HR – .061 HR per PA (93rd percentile)
- 2022: 2 HR – .010 HR per PA (12th percentile)
**2022 ATC Projections: 25 HR – .050 HR per PA**
Like a lot of other things on the South Side, Grandal has been an absolute mess in 2022, slashing .185/.294/.237 and hitting just two home runs over his first 201 PA, most recently hitting the IL with lower back spasms.
Can you believe that after looking at his massive EV gains in 2021, some people actually thought that Grandal was set up to continue his power binge in 2022? What a bunch of rubes.
His rate of hitting home runs has cratered but more concerningly, his key exit velocities have disappeared so quickly that the Grandal family is now asking for the public’s help in locating them. The 13.3% Brl% (89th percentile) from 2021 was at 9.4% in the first month of 2022, and at a 3.1% Brl% since, the only thing Grandal is barreling towards currently is the BHEH (Billy Hamilton Event Horizon). And things are even worse when looking at balls hit in the air. Grandal had a 98.7 mph Air% average EV (96th percentile) in 2021 but sits at 91.3 mph (42nd percentile) currently, while his 50.0% Air% 100+ mph (96th percentile) is at 21.0% this season, knocking him all the way down to the bottom-20%.
Besides the drops in exit velocity, a few other things stick out about Grandal’s ball-striking this season. He’s still getting the ball in the air, with a 48.1% Air% right in line with 49.3% Air% last season but what he hasn’t been doing is getting pull-happy. After running a career-high 44.3% Pull% in 2021 (38.2% Pull% for career), things have pushed completely backward, with Grandal’s 34.9% Pull% representing a new career low. And while his 36.4% Topped% is a career-high after sitting at 28%-29% for the past four years, Grandal’s percentage of launch angles greater than 38 degrees has jumped to 22.5% in 2022, up from 12.8% in 2021 and 17% in 2019-2020.
Considering how much he’s either topping the baseball or totally skying it, Grandal’s launch angle chart in 2022 looks exactly as scattershot as you might expect:
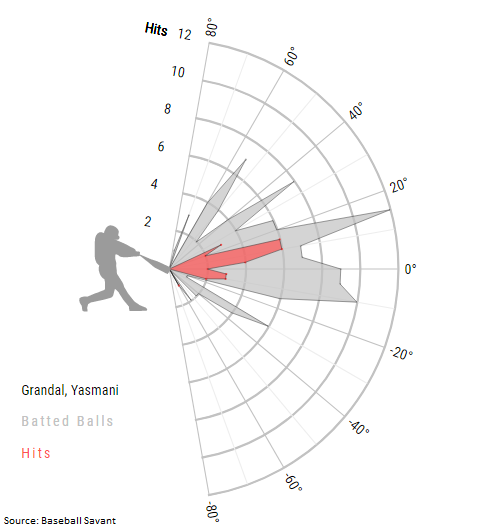
Given the potpourri of launch angles and severe drop in exit velocities, it’s hard to bet on an immediate return to power for Grandal. But he still has excellent plate discipline and we’re not far removed from the EVs being a lot spicier. With Grandal’s IL stint driving his value even lower, I’m still bullish on a bounceback because I like cheap things – but also, as we’ve previously covered, I’m a total rube.
Javier Báez
- 2021: 31 HR – .057 HR per PA (89th percentile)
- 2022: 3 HR – .015 HR per PA (23rd percentile)
**2022 ATC Projections: 28 HR – .047 HR per PA
Expectations for Báez were high heading into 2022 after putting up a premier power/speed combo in 2021, hitting 31 HR, with 18 SB. But the new Tiger has been a cruel mistress for those that paid his ~60 ADP, with Báez hitting just three home runs and stealing as many bases as Yasmani Grandal. The lack of thefts isn’t a conversation for today but it’s easy to find things to point fingers at when it comes to going deep.
Before getting to his own troubles, we can’t just ignore the power drag that comes from playing your home games at Comerica Park. For example, here is Báez’s spray chart for all of the balls he’s hit in the air at home in 2022:
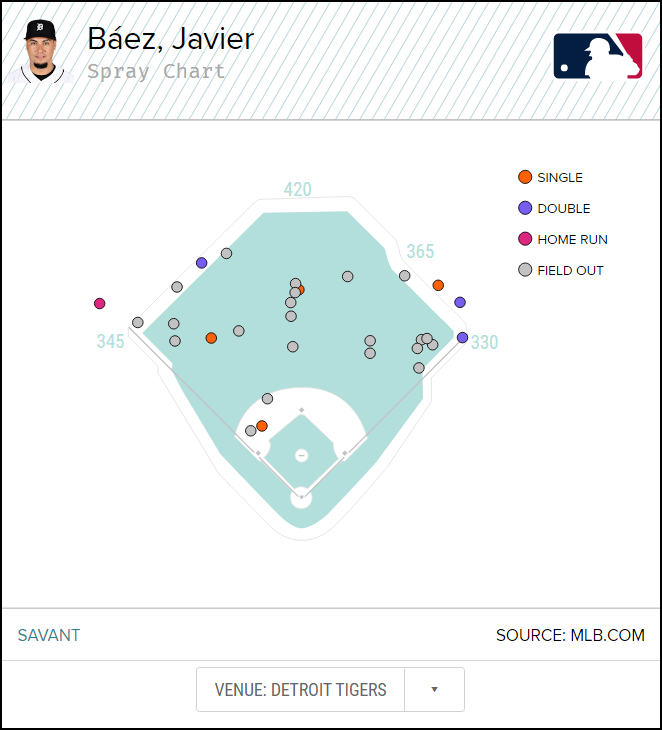
I’ll leave it to you if you’d like to watch but six of the eight balls hit near the wall might’ve been home runs in a lot of parks, as Comerica absolutely eats up balls that are hit in the alleys or taken the other way. But we can’t just blame everything on the park because Báez has troubles lurking all over the place.
We can start with how all of his top-end EVs have fallen on hard times after previously residing in the upper crust. Báez’s 13.4% Brl% from last year is at a 7.2% Brl this season, taking him from the top-11% down to the 44th percentile. But that’s the best news.
His average EV on balls in the air finished 2021 in the 88th percentile but did drop from 97 mph in the first half, to 93.4 mph in the second half. It’s more of the same this year, with Báez dropping again to 94.5 mph in the first month of 2022, and is down to 92.7 mph since, now sitting in the 28th percentile.
It’s the same story on balls hit in the air over 100 mph, with Báez sitting in the 39th percentile this season, falling from the 93rd percentile in 2021. And also like his Air% average EV, it’s been dropping for a while. Báez’s 50.0% Air% (100+ mph) in the first half of 2021 dropped to 42.6% in the second half, then to 39.1% in the first month of 2022. And now? 20.0% – for context, this is the land of César Hernández and Josh VanMeter.
But it’s not as simple as just lower EVs have caused less power; they’re just a part of his daisy chain of destruction. And if you’re looking for the fuse, maybe start with his swing charts.
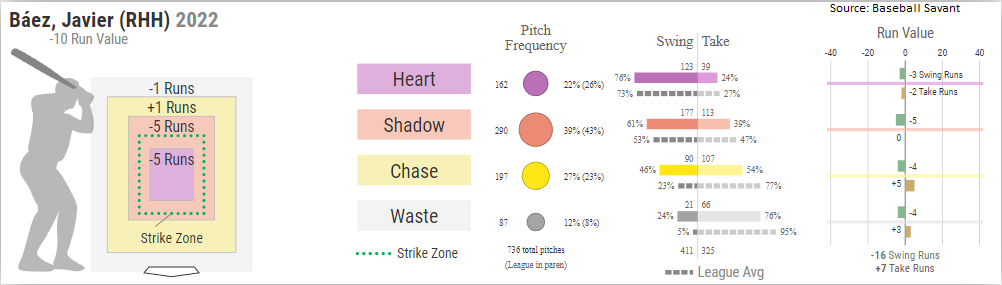
Looking at the above, much is the same as it’s been in the past. A 76% Swing% on balls in the heart of the zone is above average and near his 79% last year, 76% in 2020, and 78% in 2019. And he’s dropped to 61% in the shadow zone, after 69% in 2021, 66% in 2020, and 65% in 2019.
Okay, so we have some changes in the strike zone but nothing too drastic. And once we move further out to the chase zone, Báez is at a 46% Swing%, after 45% in 2022. But once we get wasted, things really start moving. After an 18% Swing% in the waste zone in 2019 and 17% in 2020, Báez sunk all the way to 12% in 2021, drifting ever closer to the 6% that the rest of baseball averages.
But in 2022, Báez is now running a 24% Swing% on pitches in the waste zone, double what he did last season and nearly 5x the league rate. And it’s not like he’s exactly been Vlad Guerrero (Sr.) on successfully hitting trash – out of 300 qualified hitters, want to guess who is currently dead-last for Run Value in the waste zone?
You guessed it; Bill Brasky. Kidding, kidding – It’s Javier Báez!
So, what gives? Well, it might not be the whole story but some things do jump out about his performance against specific pitches – namely the slider.
Báez’s numbers versus offspeed pitches are actually up, though, the ones versus fastballs have dropped. But the breakers, my oh my, the breakers. He has a .157 wOBA (.178 xwOBA) against them that’s down from a .364 wOBA (.310 xwOBA), while his Whiff% has increased nine points to a 53.8% Whiff%.
But while his performance against curveballs hasn’t been as punishing as last season (.609 wOBA, .404 xwOBA), a .351 wOBA against them isn’t exactly the worst. No, for that distinction we need to head on over to slide town, where Báez has posted a .142 wOBA in 2022 which is down from a .226 wOBA, and a 55.3% Whiff% that is up from 45.5%.
Somehow I doubt it’s a coincidence that Báez has faced a career-high 32.2% sliders in 2022. Because if there’s anything that baseball does consistently, it’s pouncing on weaknesses. Oh, so you can’t hit the slider this year? Here, have piles of sliders.
To summarize, Báez plays at a power-sucking home park, has ongoing drops in his top-end exit velocities, and is swinging more wildly than ever, in particular, flailing at the sliders that he’s now seeing more of than he ever has before.
I’m sure this will work out totally great.
Luis Robert
- 2021: 13 HR – .044 HR per PA (72nd percentile)
- 2022: 6 HR – .029 HR per PA (61st percentile)
**2022 ATC Projections: 29 HR – .048 HR per PA
While not yet achieving the lofty expectations that came with his top-20 ADP, Robert hasn’t exactly been a disaster (#53 hitter on the Razzball player rater) and his six home runs are more than Báez and Grandal combined. But, to paraphrase the late 20th-century poet, Paula Cole, where have all the EVs gone? Doo-doo, doo doo-doo, doo doo-doo, doo doo-doo.
Unlike the previous batters we looked at, Robert’s home run rate and top EVs were totally fine for the first month of the season. His .053 HR per PA was in the 90th percentile (up from the 71st in 2021), an 18.0% Brl% was up from 12.5%, his 96.1 mph Air% average EV was up from 94.6 mph, while a 43.8% Air% (100+ mph) was identical to his mark last season. But oh, what a difference six weeks make.
In our second period of 2022, Robert’s EVs have totally crumbled right along with his home run rate (.015 HR/PA), as well as many other indicators of power. Since May 8th:
- 4.0% Brl% (down 14-pts)
- 89.5 mph Air EV (down 6.6 mph)
- 17.5% Air% 100+ mph (down 26-pts)
- 40.4% Air% (down from 52.5%)
- 29.3 Pull% (down from 39.3%)
Decreases are going to happen over different windows of time but most concerning for Robert is the magnitude of the drops. We’re not just talking about a few percentile points, these are massive (and sudden) decreases coming from not just a top-100 pick like Báez and Grandal but from a late-1st/early-2nd round pick that many were predicting would ascend into the top-tier of fantasy hitters in 2022.
So what the hell happened? I wish I knew. With the extreme drops like what Robert has suffered, normally I’d jump right to a lingering injury being the cause but that’s a hard thing to pin on him considering he’s only had a minor groin strain in late April along with going on the COVID-IL in late-May. And it’s not like he hasn’t been hitting – Robert has a .283 AVG on the year and has multiple hits in five of his 14 games in June, and five stolen bases over that time don’t really speak to a groin issue still bothering him.
But while Robert has collected plenty of hits in June, a .281 wOBA and .634 OPS over that time is an eraser for potential value. And pulling back for the whole year, things don’t look much better:
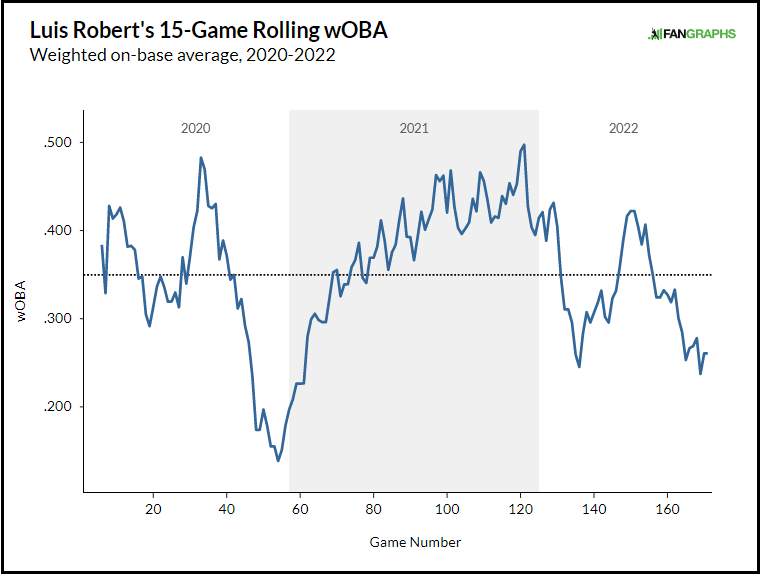
Honestly, it’s hard for me to pin down the cause of Robert’s home run doldrums. It’s not like he just woke up one day and decided to be a slap-hitter but without a previous injury to blame for the power-sap, we’re left grasping. The good news is that the fantasy impact of his current power outage is somewhat mitigated by Robert’s five-category profile, as his value isn’t overly dependent on the home runs that are currently lacking.
But you didn’t use one of your first picks on him to be an AVG/SB specialist, so he’ll need to quickly start sliding more dongs into fantasy DMs if he wants to keep his drafters satisfied.
Haha the BHEH made me laugh out loud. Thanks for the analysis with a side of fun.
Absolutely! I appreciate you checking it out.