Archive for Roto

Midseason 3B Rank Assessment

Jul 19, 2025; Phoenix, Arizona, USA; Arizona Diamondbacks third base Eugenio Suárez (28) reacts after hitting a solo home run against the St. Louis Cardinals in the third inning at Chase Field.
Credit: Rick Scuteri-Imagn Images

José Ramírez is the only third baseman so far in 2025 to post positive value in each traditional roto category. That’s incredible, and it’s the reason J-Ram is in the mix as the best third baseman in the league every single season. Manny Machado isn’t a base-stealer, but he’s returned positive value in every other category. Junior Caminero, Rafael Devers, Eugenio Suárez, and Isaac Paredes are the third basemen with three positive value categories:

Third Basemen With Highest Positive Category Value Count
Name mAVG mRBI mR mSB mHR Current Dollar Value Positive Category Count
José Ramírez $5.03 $0.45 $1.98 $12.87 $2.50 $37.35 5
Manny Machado $4.66 $2.61 $3.20 -$0.26 $1.78 $26.49 4
Junior Caminero -$3.45 $4.04 $2.39 -$2.13 $6.11 $21.47 3
Rafael Devers -$2.92 $6.91 $2.39 -$4.63 $1.78 $18.03 3
Eugenio Suárez -$3.77 $10.50 $3.60 -$4.63 $11.90 $32.10 3
Isaac Paredes -$2.34 $0.10 $0.77 -$5.26 $3.22 $11.00 3
According to the FanGraphs Auction Calculator

Each of these players had a great first half and has probably made the fantasy managers’ rostering them have great first halves as well. Swap Vladimir Guerrero Jr. in for Isaac Paredes, and you’re looking at the top six third basemen at the half. Which of these, if any, surprises you? In this article, I compare my third base preseason rank predictions with mid-year actuals.

NOTE: data reflects games played through Sunday, July 20th.
Read the rest of this entry »


Three Appearance Analysis with Tanner Houck: Part 2

Apr 14, 2025; Tampa, Florida, USA; Boston Red Sox starting pitcher Tanner Houck (89) leaves the game against the Tampa Bay Rays in the third inning at George M. Steinbrenner Field.
Credit: Nathan Ray Seebeck-Imagn Images

What happened!? That’s the question we ask the morning after a stinker performance by a starting pitcher when we’re looking over our fantasy results from the night before. It’s not an easy question to answer, and even when you come to a conclusion, someone else may have a completely different perspective. This article series serves as the starting point for answering that question in the context of three individual outings. Read the rest of this entry »


Three Appearance Analysis with Tanner Houck: Part 1

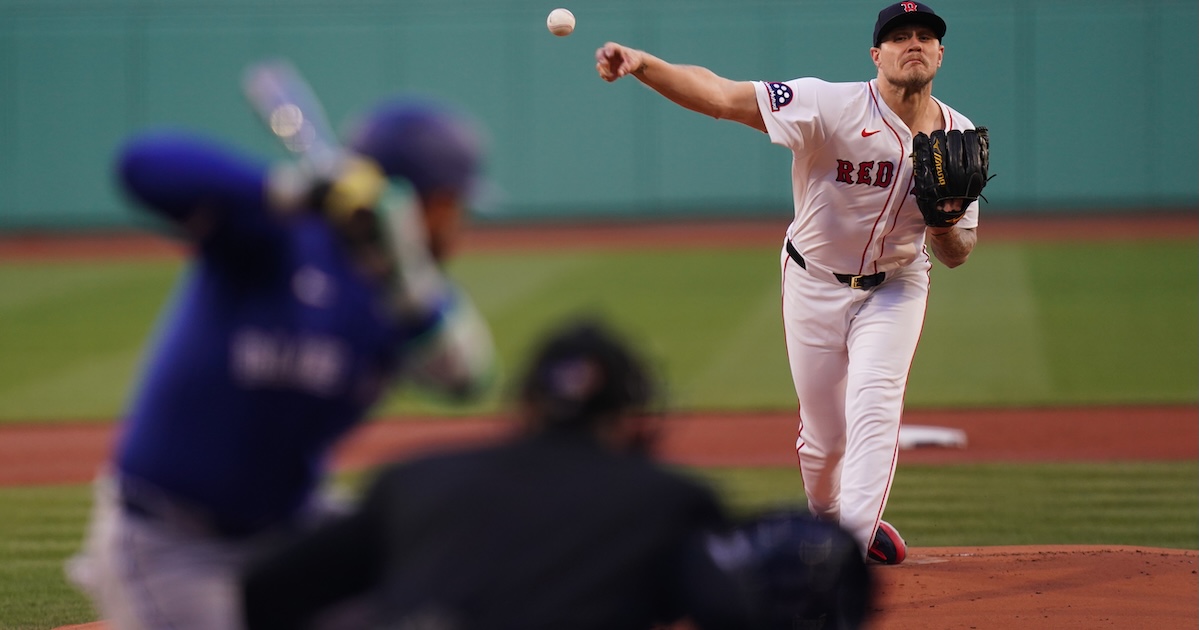
Apr 9, 2025; Boston, Massachusetts, USA; Boston Red Sox pitcher Tanner Houck (89) throws a pitch against the Toronto Blue Jays in the first inning at Fenway Park.
Credit: David Butler II-Imagn Images

Come with me, for a moment, down into the clubhouse of your favorite MLB team. Walk through the concrete halls and into the press room. Take a seat and wait for the manager to come in. Listen, you can hear it. Pencils, pens, iPad taps, all preparing to ask questions that press the manager, while also making the person asking them sound cool and trustworthy, like, “You can talk to me, it’s me! I’m cool. I’m not like these other press passers.” Here it comes, the classic question:

Press: What did you see out there with your starting pitcher today?

Read the rest of this entry »


Projections-Fueled Top 30 Pitching Prospects, Midseason 2025 Update

Syndication: The Enquirer

This article takes a look at baseball’s top 30 pitching prospects from a projections-based perspective now that half of the 2025 season is in the books. Jump to the bottom for the updated list!

The projections capture prospect performance across the minor and major leagues in recent years, making use of aging curves, major league equivalencies, league environment adjustments, park factors, and regression to project peak (late-20s) prospect performance. They also capture Stuff+ courtesy of Eno Sarris (only for arms with MLB experience), and, starting this season, velocity (for all minor and major leaguers). They do not capture scouting or amateur performance. For comparison and more methodological detail, you can find the preseason list here, last year’s midseason list here, and an introduction to the projections here.

Read the rest of this entry »


Projections-Fueled Top 30 Hitting Prospects, Midseason 2025 Update

Now that almost 50% of the season is in the books, it’s a good time to check in on baseball’s top hitting prospects from a projections-based perspective. You can see the preseason list here and last year’s midseason list here. Those articles also feature more methodological detail if you want to read more about the projections process. Briefly, the projections capture prospect performance across the (non-DSL) minor and major leagues in recent years, making use of aging curves, major league equivalencies, league environment adjustments, park factors, regression, and more, to project peak (late-20s) prospect performance in the majors. They do not capture scouting, defense, or amateur performance. Starting this offseason, they also capture bat speed, which was made available for a decent handful of prospects this spring training.

Read the rest of this entry »


The Minor League Reset: Did It Work?

May 25, 2025; Chicago, Illinois, USA; Texas Rangers first baseman Jake Burger (21) hits a two-run home run against the Chicago White Sox during the second inning at Rate Field.
Credit: Kamil Krzaczynski-Imagn Images

There are all kinds of reasons big leaguers get demoted to the minor leagues: roster crunches, injury rehab, and, of course, poor performance. Even for a weekly internet blogging fantasy baseball player, all these transactions are difficult to follow. Yet, many expert fantasy players follow them like a hawk follows a mouse running in an open field, and it gives them an edge. If there were a tool that could detect demotions, great performance during the demotion, and improved performance at the major league-level, we’d all have more time to do what we really care about: watch more baseball!

Read the rest of this entry »


Cutting to the Chase with Chad Patrick

May 26, 2025; Milwaukee, Wisconsin, USA; Milwaukee Brewers pitcher Chad Patrick (39) throws a pitch during the first inning against the Boston Red Sox at American Family Field.
Credit: Jeff Hanisch-Imagn Images

Studying the balance of plate discipline metrics on individual pitches can be fascinating. They tell a story, if you look closely enough. Read the rest of this entry »


Two Graphs, One Player: The Carson Kelly Conundrum

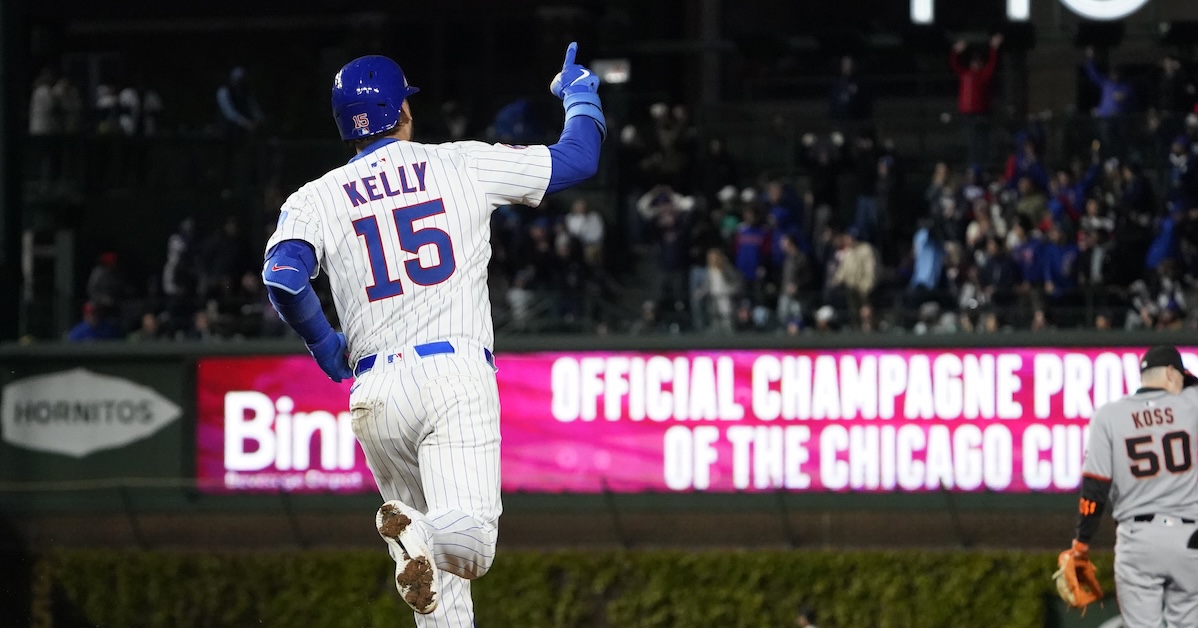
Cubs catcher Carson Kelly (15) reacts after hitting a home run against the San Francisco Giants during the sixth inning at Wrigley Field.
Credit: David Banks-Imagn Images

In the wild and crazy world of Ottoneu fantasy baseball, players can battle it out in a points-style format that is so true to modern hitting that batting averages are meaningless and home runs are more valuable than a 12-pack of eggs. Don’t worry, this article applies to all leagues, regardless of format. Has this ever happened to you?

Read the rest of this entry »


Noteworthy OOPSY ROS Projections for Arms: Early May Edition

Katie Stratman-USA TODAY Sports

With about 20% of the season in the books, I wanted to see which arms have altered their projections the most relative to the preseason, like I did a few weeks back for bats. To do this, I’ll refer to OOPSY rest of season (ROS) projections, a system I introduced at FanGraphs this offseason. So far this year, OOPSY has held its own with other top projection systems featured at FanGraphs. I have a great respect for each of those systems, and would be happy enough to not embarrass myself in comparison. For each player, I’ll also offer my best guess on where I’d draft them in a standard 15-team Main Event league that was starting today, informed by a healthy mix of the FanGraphs auction calculator using OOPSY ROS and vibes.

Bear in mind that, across all projection systems, pre-2025 data still weighs much more heavily than 2025 data as pre-2025 covers a much larger sample of data. Like for bats, a single season typically never comprises more than half of the weight in a projection for arms, as projection systems usually weigh at least three years of historical data. The quickest ways for a pitcher to improve their projections are to improve their stuff, rack up strikeouts and limit walks, and keep the ball on the ground. These are reliable indicators of pitching talent that weigh heavily in all projection systems, not just OOPSY. In contrast, BABIP, home run per fly ball rate, and left-on-base percentage are less reliable metrics that typically require a large sample of data to significantly alter projections. The numbers referenced in this piece were collected on May 6th.

Read the rest of this entry »


I Strike Out Opposite-Handed Batters Now. Does That Even Matter To You?

May 1, 2025; St. Petersburg, Florida, USA; Tampa Bay Rays starting pitcher Shane Baz (11) throws a pitch against the Kansas City Royals during the first inning at George M. Steinbrenner Field.
Credit: Kim Klement Neitzel-Imagn Images

In 2017, Gerrit Cole struck out opposite-handed batters, lefties, at a 22.8% rate. That mark was above the MLB average, 20.4%, among right-handed starters striking out left-handed hitters. In the first few months of the 2018 season, March, April, and May, Cole’s K% versus left-handed hitters rocketed up to 45.5%.

Here’s how he did it:

Read the rest of this entry »