The 2025 ATC Projections have arrived at FanGraphs!
The Average Total Cost projection system (ATC) gets its name from the fact that it “averages” many other projection systems together. ATC also happens to be my initials.
ATC is a “smart” projection aggregation model. While most other aggregation systems typically apply equal weight to all underlying data sources, ATC assigns weights based on historical performance. The method is similar to what Nate Silver does with his political forecasting at www.fivethirtyeight.com. Read more about how ATC works here.
ATC’s advanced methods have paid off. For the past five years, FantasyPros ranked ATC as the most accurate baseball projections, even more accurate than their own. Annually, I conduct my own projections review using a game theory method, which has consistently shown that ATC has outperformed other projections.
Prior to the 2021 season, ATC introduced three volatility metrics to accompany its player projections. Since ATC is the aggregation of other projection systems, these metrics serve to provide color on the shape / makeup of the underlying data.
What do I mean by providing color?
For certain players, projections are all largely in agreement with one another, while for others – projections may disagree widely. As for those disagreements – are they more concentrated above a player’s expectation, or do they appear below it? ATC’s volatility metrics serve to paint a picture of how underlying projections are situated about the ATC average.
The ATC volatility metrics serve us to help quantify a player’s parameter risk and profile risk. They also have a correlation with expected rotisserie earnings.
The previous terminology that I had used to quantify ATC’s volatility was overly mathematical in nature. To be frank, the nomenclature of InterSD, InterSK and IntraSD is far too nerdy – even for fantasy baseball and sabermetic lovers like you and me. In addition, the meaning and range of some of the metrics wasn’t as intuitive as it could have been.
Today, I will unveil ATC’s redesigned volatility statistics – Vol, Skew and Dim – short for Volatility, Skewness and Dimension.
Process & Parameter Risk
Let’s first discuss for a moment how player projections work.
Take the Steamer projection system for example. Steamer uses their proprietary methodology to project future player performance. According to MLB.com, Steamer incorporates past performance, aging trends and pitch-tracking data to help forecast players in the upcoming season.
When Steamer generates a 35 HR projection for the Mets new slugger, Juan Soto, Steamer is not guaranteeing that the New York slugger will hit exactly 35 homeruns.
Instead, Steamer projects many possibilities for what could happen in 2025. There is a range of outcomes that Soto can achieve, and Steamer quantifies them. 43 HRs might represent a 90th percentile outcome for him, and 24 HRs may depict a 30th percentile outcome, etc.
What is displayed in the commonly viewed projection line is either the average of all modeled scenarios, or often the median outcome itself. 35 HR is Steamer’s modeled measure of Soto’s true talent level for power.
Due to the 162-game season sample size, there will always be variations above and below a player’s true average/median expectation. A bit of good luck in one season could produce three more HRs, while extreme bad luck may take away seven.
The term for the inherent variance due to sample size is known as process risk.
If there were ten million games played in a season, with no external or unexpected factors – Steamer would expect that Juan Soto would average close to 35 HRs per 162 games (his true talent) in the long run. But in any standard 162-game stretch, there will always be higher and lower performances.
To give a real life application of this from my insurance/actuarial background – some [insurance] lines of business exhibit relatively small variations year to year, while some display large annual variations. For example, automobile physical damage insurance is one of the lines with relatively low process risk; results hardly vary from year to year. Earthquake insurance, however, is one of the more highly variable lines of insurance where insurers do not receive any large claims in most years.
The same can be also said regarding major league baseball players. There are some more consistent year-to-year performers, while many other player exhibit a wider range of outcomes.
But what if Steamer was wrong about a player’s projection? Perhaps OOPSY’s 37 homerun projection was the more accurate forecast of Soto’s true talent. What if FGDC’s 36-HR forecast was truly the better long-term bet?
The term for the uncertainty of the true expectation is referred to as parameter risk.
Process risk cannot be materially minimized, nor should it – but parameter risk has a chance to be reduced. One major strength of the ATC projections is its ability to reduce parameter risk. By utilizing and combining many sets of expectations, ATC reduces the risk of relying on any one single projection system.
Projection Volatility
How can we quantify player projection risk?
Most projection experts grapple with this difficult question. The ATC Projection system provides us with one way of looking at projection volatility resulting from parameter risk. It does this by looking at the distribution of all of its underlying projections.
To illustrate the concept, take a look at the following two player projections:
Mason Saunders
| Projection System |
HR |
SB |
| Steamer |
36.5 |
16.4 |
| Depth Charts |
30.5 |
15.8 |
| OOPSY |
23.4 |
16.1 |
| ZiPS |
30.2 |
16.9 |
| THE BAT |
25.2 |
19.5 |
| THE BAT X |
36.2 |
16.5 |
|
|
|
| Average |
30.3 |
16.9 |
| Standard Deviation |
5.4 |
1.3 |
| Skewness |
-0.1 |
+2.0 |
Charlie Hustle
| Projection System |
HR |
SB |
| Steamer |
44.5 |
25.7 |
| Depth Charts |
41.2 |
26.0 |
| OOPSY |
42.2 |
23.9 |
| ZiPS |
45.2 |
26.1 |
| THE BAT |
47.0 |
26.1 |
| THE BAT X |
44.1 |
25.9 |
|
|
|
| Average |
44.0 |
25.6 |
| Standard Deviation |
2.1 |
0.9 |
| Skewness |
-0.0 |
-2.3 |
For Charlie Hustle (a reference to the late Pete Rose), there is little difference between how the models project homeruns. Assuming that each of the six systems receive equal weight, the standard deviation of just 2.1 depicts a relatively tight range of projected outcomes. For Mason Saunders (a reference to danger seeking Madison Bumgarner), projections are scattered widely ranging from OOPSY’s 23.4 to Steamer’s 36.5. Accordingly, the standard deviation for Saunders’s underlying HR projections is 5.4.
Take a deeper look, particularly at the symmetry of Mason’s homerun projections. Though wide ranging, his projections are almost perfectly balanced about its HR mean of 30.3. For every outlier high projection, we get a low one – denoted by a near-zero skewness.
Turning now to stolen bases, both players’ range of predictions are rather small; their standard deviations are 1.3 and 0.9 respectively. There is little parameter uncertainty displayed by those underlying SB projections.
Digging into the details, we can see a bit more color as to how projections are situated about their average. For Mason, THE BAT does produce somewhat of an outlier 19.5 stolen base projection – a figure far higher than the other systems. Accordingly, the statistical skewness of his underlying projections is +2.0. In contrast for Charlie, OOPSY projects a low outlier of 23.9, which leads to a -2.3 statistical skewness.
If we only looked at a simple average of the six models, we would not know just how variable or symmetric the underlying data is. The extra information (of the standard deviation and skewness) paints a more vivid picture of the underlying projections.
Not only that – but from my research (that I will present later in the article), the ATC projected values can be further risk-adjusted, as there is a correlation between the spread and symmetry of ATC’s underlying projections and rotisserie earnings.
There is one other important detail to mention. Theoretically, we could calculate volatility metrics for every single projected statistical category. But that would be an extraordinary amount of information, and it would be rather difficult to digest. Instead, ATC presents volatility metrics on a total player-value basis and calculates the projection volatility surrounding it.
To start the process of generating the ATC Volatility metrics, auction values are first internally computed for each underlying system using standard NFBC league settings (15-team mixed, 5×5 roto scoring categories). The valuation method is a Z-Score type approach, similar to the FanGraphs’ auction calculator.
Next, using the total auction values produced by all of the underlying projections (and properly weighted by the overall contribution), the ATC volatility metrics are generated. Below are their definitions and uses.
ATC Volatility (Vol)
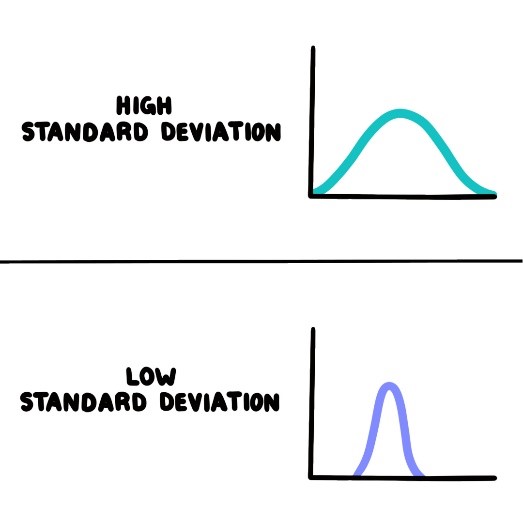
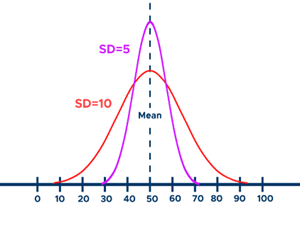
ATC Volatility (Vol) is the volatility surrounding the ATC average auction value. Vol describes how much the projections disagree about the value of a player. The larger the Vol, the more projections differ.
Vol is calculated by taking the standard deviation of the underlying projections surrounding the ATC average auction value. Vol is a 2nd order statistic. Assuming a normal distribution, approximately 68.2% of all projections will fall within Vol dollars of the ATC average auction value.
The ATC Volatility (Vol) is identical to the Inter-projection standard deviation (InterSD). It is the same statistic, just more plainly named.
Vol = InterSD
ATC Skewness (Skew)
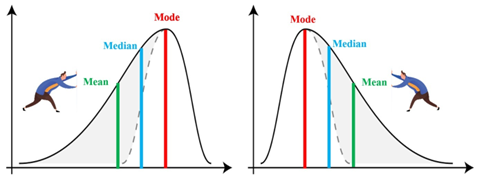
ATC Skewness (Skew) is a measure of the symmetry of the underlying projections surrounding the ATC auction value.
Skew is calculated by taking the negative of the statistical skewness of the underlying projections surrounding the ATC average auction value. Skew is a 3rd order statistic. Skew describes the symmetry of the underlying projections.
As I have flipped the sign of the skewness metric, it is important to understand why and what it represents.
A positive Skew means that a player’s mean is being pulled to the downside by outlier projections; the majority of projections are higher than the ATC average. A positive skew represents upside to the player’s projection.
A negative Skew means that a player’s mean is being pulled to the upside by outlier projections; the majority of projections are lower than the ATC average. A negative skew represents downside to the player’s projection.
A zero Skew means that a player’s mean is perfectly balanced with projection weights on either side.
The previous metric InterSK portrayed a negative statistic for a player with upside, and vice versa. This was confusing from a fantasy baseball context. I vastly prefer that the sign reflect the more likely direction of the risk. With the new ATC Skew, a positive Skew is now better!
The ATC Skewness (Skew) is still identical to the Inter-projection skewness (InterSK) in terms of magnitude. It is the same statistic, just more plainly named, with the sign reversed.
Skew = -1 * InterSK
Profile Risk
Above we have looked at the volatility arising from differences between the underlying systems, which helps us quantify the parameter risk of projections.
But there is also the notion of a player’s categorical or profile risk. That is the effect that any single component of a player’s profile has on his overall value.
The notion of profile risk is not necessarily fantasy baseball specific. To illustrate this point – take Daniel Vogelbach, for example. For the majority of Vogelbach’s recent baseball career, he had not played a defensive position. To put it mildly and colloquially – he is “super slow.” Daniel has never stolen a base in his major league career.
In 2019, Vogelbach batted .208 while hitting 30 home runs. He is the epitome of a one-dimensional player. Without his power, he has virtually no baseball value whatsoever.
On the other end of the baseball spectrum – but not dissimilar in principle, there are players such as Billy Hamilton and Jarrod Dyson. Their value in the sport was completely concentrated in their “wheels.” Their blazing speed is what earned them spots on major league rosters. If suddenly their stolen base success rate plummeted, so would all of their baseball value.
In contrast to the above, consider the great Willie Mays. The late “Say Hey Kid” was a true five-tool player. Should you take away just one of the great aspects from Willie Mays – be it his stolen bases, or his defense, etc. – he would still thrive at the highest level.
From a fantasy baseball standpoint, one-dimensional players pose a roster construction complication. If said player underperforms or is injured, there is a disproportionate effect on the category balance of one’s aggregated fantasy team. Those niche statistics become ever increasingly difficult to make up.
However, should a five-dimensional player be absent or underperform, the fantasy balance isn’t as greatly affected. Sure, you’ll still have to replace a large number of statistics, but because of their well spread nature, there are more ways to fill their void.
While the between projection volatility metrics above serve to quantify the parameter risk of projections, ATC has a volatility metric looking at a player’s categorical or profile risk. Again, the smaller the categorical risk of the player, the less effect that any single component of the player’s profile will have on his total rotisserie value.
ATC Dimension (Dim)
ATC Dimension (Dim) – The categorical dimension of a player’s underlying rotisserie contributions. Dim is a measure of the dimension of a player’s statistical profile. The larger the Dim, the more balanced the individual player’s category contributions are. The smaller the Dim, the more unbalanced the player’s category contributions are. Dim is based on the player’s component categorical Z-Scores and has a numeric range from 1 to 5.
Unlike the previous IntraSD, Dim is far more intuitive.
A Dim of 2.0 for example, means that a player is two-dimensional. Both Luis Arraez and Xavier Edwards exhibit Dims of about 2.2. They are essentially two-category players. Arraez is strong at BA and R, and Edwards excels at SB and BA.
A Dim of 4.7 on the other hand, means that a player is close to being a five-dimensional player. Cody Bellinger and Wilyer Abreu (Dim 4.7) are both well-spread categorically. While Bellinger might have more overall value, both players aren’t deficient in any one category. They help … everywhere.
The ATC Dimension (Dim) is a translated version of the Intra-projection standard deviation (IntraSD).
Dim = 5 – IntraSD * 4 / 3
Effect on Rotisserie Earnings
Aside from understanding the shape of the projections that feed ATC, let’s take a look at how the new ATC volatility metrics can affect future rotisserie value.
Observe the following plots compiled with data over the past six seasons:
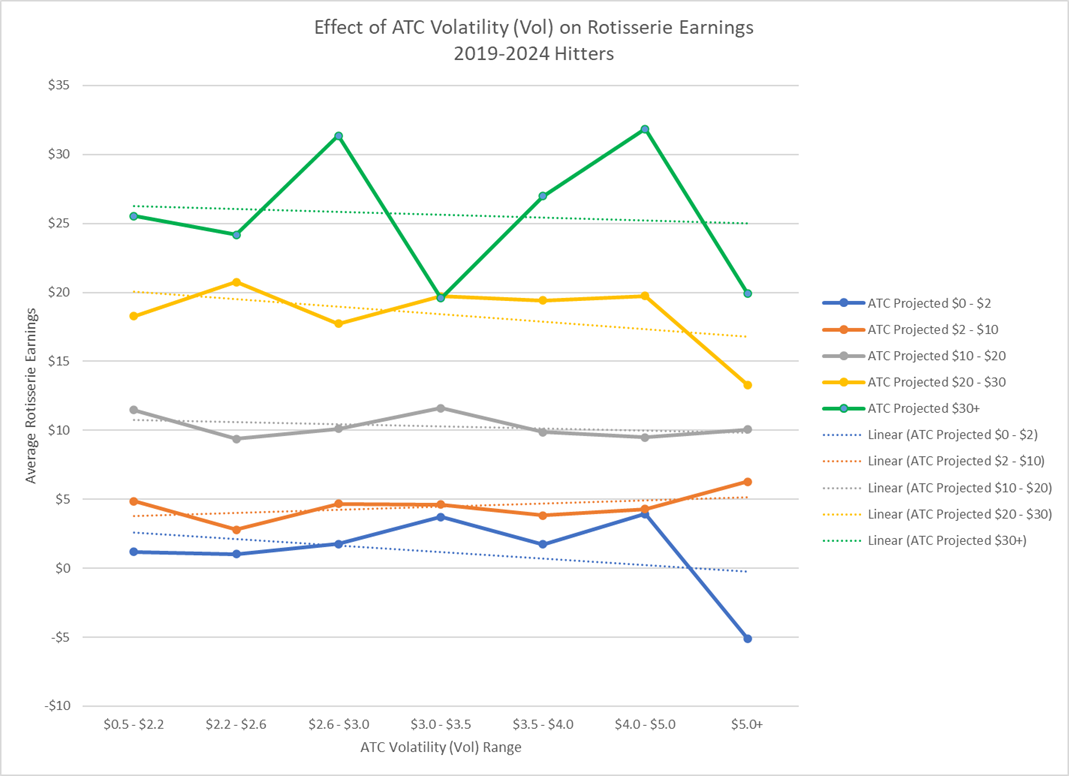
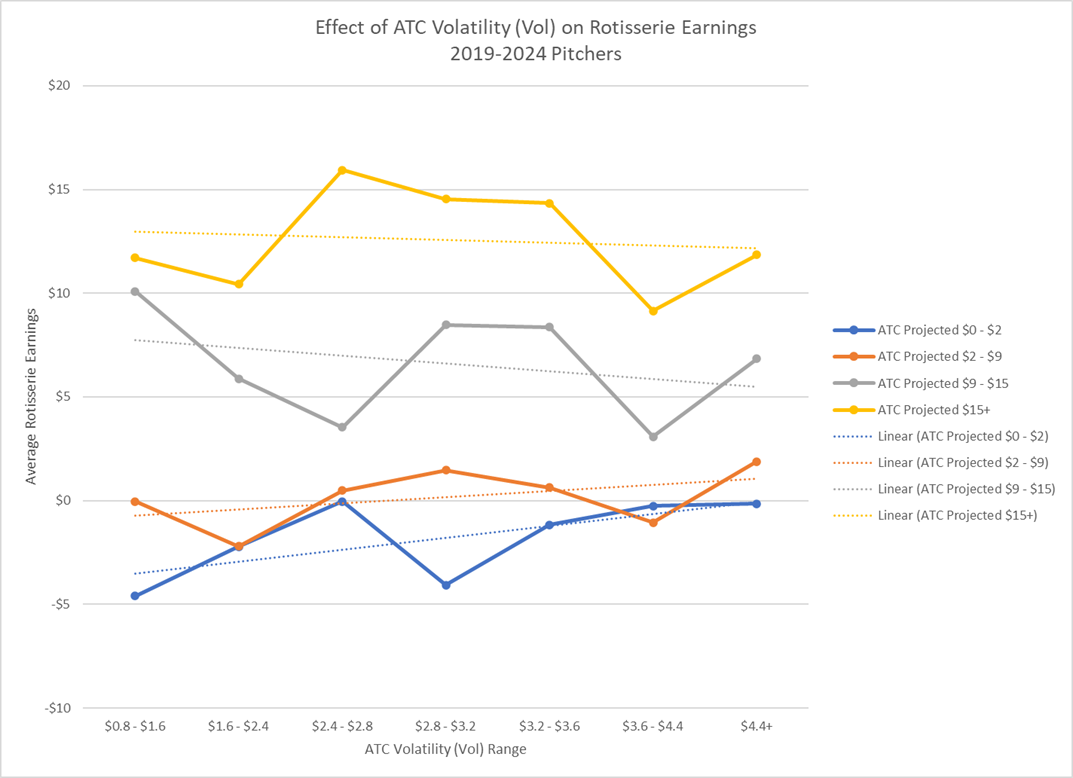
Each chart above (one for hitters and one for pitchers) plots the final accumulated player rotisserie earnings against various Vol ranges. The Vol figures are derived from the pre-season ATC projections from 2019-2024, with Vol ranges selected to break the player pool into groups of relatively equal number. As the effect of projection volatility might also differ depending upon a player’s level of value, players were additionally classified into different value groupings by ATC projected auction values.
A few technical notes:
- There were 1065 hitter-seasons and 751 pitcher-seasons in this study who were projected for more than $0 of future rotisserie value.
- Negative values were capped at -$10 for this exercise. Read here for a further description of the reasoning behind the capping of values.
For hitters, the overall linear trend is slight, but it suggests a small negative correlation between rotisserie earnings and ATC Volatility (parameter risk). The higher the Vol, the lower the expected earnings for the player in relation to his projected ATC auction value.
This is especially true at the endpoints (extreme high or low volatility) and true overall. The capping effect (at a -$10 threshold) serves to tone down this correlation; in reality it is even more pronounced.
When looking at the individual player value cohorts in the above graph, we see that the trendline slopes downwards for all player group values, other than ones projected to earn between $2-10 of roto value. For players near replacement value (and due to the capping effect), fantasy owners may choose to seek out high volatility players in the hopes for some untapped upside.
As an aside, it is a testament to ATC’s success that the projected $2-10 hitters have stable earnings, even at higher levels of projection volatility.
Everything said above is also true for pitching, although the earnings are less stable across Vol ranges. Additionally, the trendline for low-valued pitchers slopes upwards to suggest that fantasy teams should take chances on pitchers towards the end of their drafts.
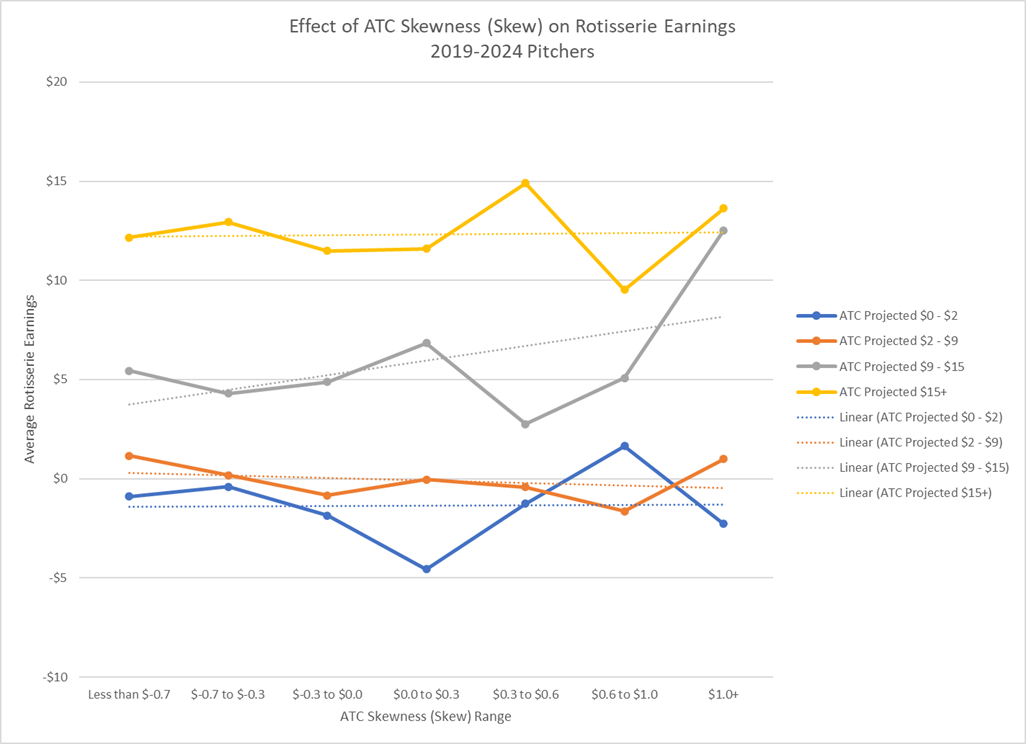
The next two graphs plot rotisserie earnings against various Skew ranges.
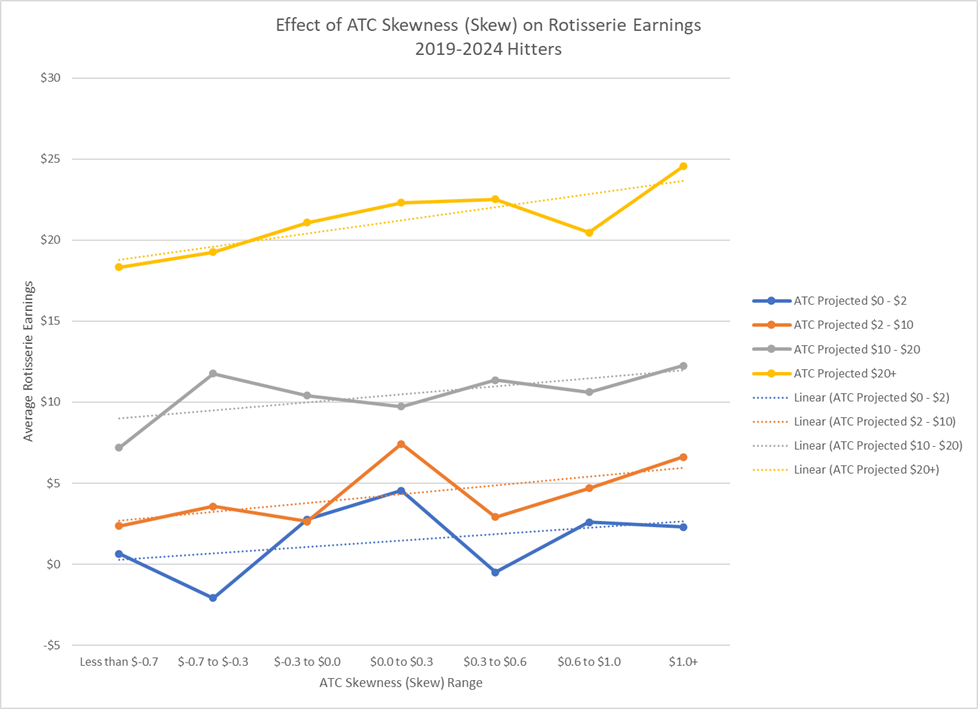
For hitters, we clearly see that historical results favor players with positive Skew. Especially at the high and low endpoints of the graphs (very negative or very positive Skew), the results are more dramatic. For Skews on the negative side, take heed of the player’s projection, and slightly downgrade. Give a boost to a player with a Skew of more than +0.6.
On the pitching side, there is still an overall strong correlation between expected earnings and Skew, but the strongest cohort to exhibit this contingency is the $9-15 pitchers. There is about an $8 gap in realized earnings between highly positively and highly negatively skewed pitchers in the mid-rounds of fantasy drafts.
From an ROI perspective, there is a potential difference of 50-100% on returns here, making ATC Skew an extremely valuable piece of information available to you.
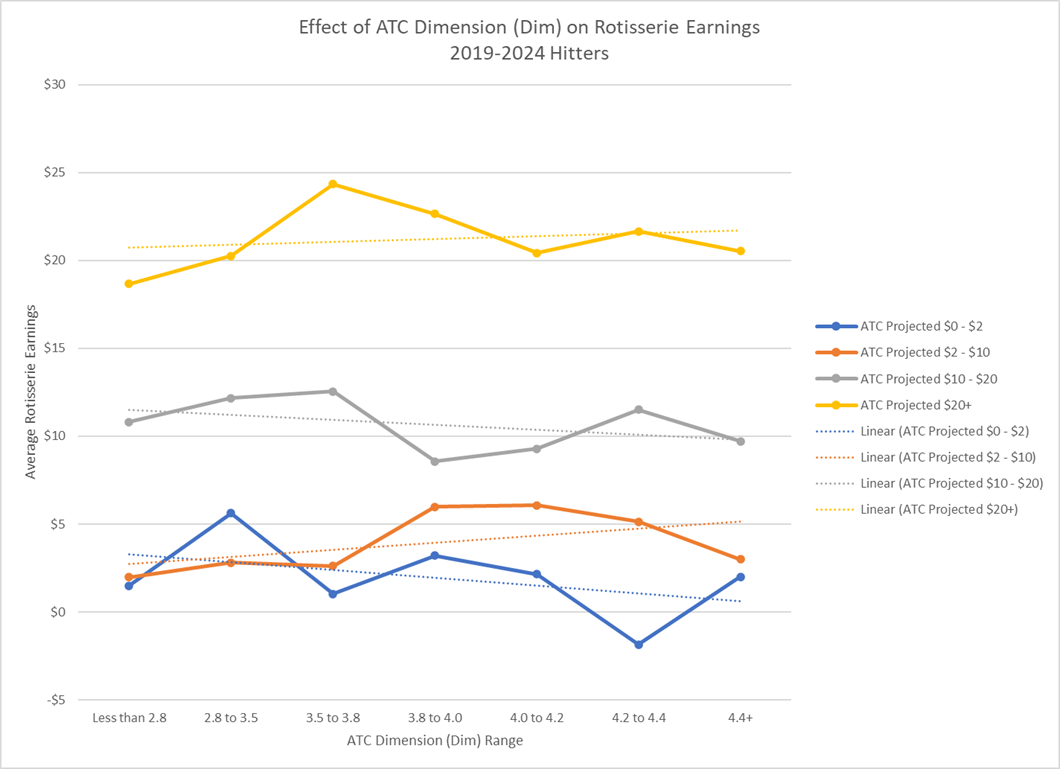
As for the ATC Dimension (Dim), for now, we will only analyze batters. Pitchers can at most be four-category contributors, with starters lacking saves and relievers lacking wins (for the most part).
For ATC Dimension, there is far less correlation with expected earnings. For hitters $10+ there is a small, but positive effect, particularly at the very top. The takeaway here is to avoid low dimensional players in the first few rounds of drafts. In the middle of the drafts, Dim isn’t all that helpful.
However, towards the end of drafts, we do see some greater effects. For players valued $2-10, Dim adds some $1.9 of expected earnings per dimension, which is not insignificant. Bump up players such as Gleyber Torres, who are multi-dimensional and available late in drafts.
At the very bottom – for players under $2 – low-dimensional players appear to be the better ROI play. More diversity in categorical makeup is potentially more desirable. In essence, if the investment is low – you want to increase your categorical risk, at least on an individual player basis. This effect is slight, but visible.
Conclusion
The next frontier of fantasy baseball will be to pursue a greater understanding of risk and volatility through its quantification. The goal is to define it, make it more measurable, and most importantly – to create actionable processes. The next steps will be to create a framework for risk-adjusted pricing and risk-adjusted drafting measures. We are just getting started.
ATC Volatility is not a be-all-end-all set of risk metrics. It is but a mere first step into this challenging journey of risk quantification in fantasy baseball. As both an actuary and baseball analyst, I look forward to the next steps of this voyage.