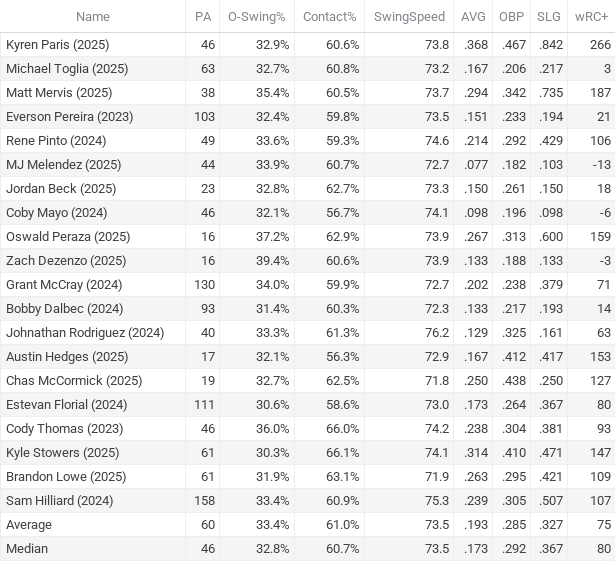
Last week, I unveiled new research that concludes looking at league-relative Statcast power metrics, such as HardHit%, maxEV, and Barrel% could help forecast the direction of both Barrel% and HR/FB rate the following season. The data was bucketed into two groups, A being those with high relative HardHit% and maxEV marks, but low Barrel%, while B included those with low relative HardHit% and maxEV marks, but high Barrel%. Let’s now identify and discuss the names that met each group’s criteria in 2025 as we look forward to 2026.
In my latest Mining the News, I referenced MLB.com’s Rookie of the Year Poll. MLB.com polled team executives to find who they think will win each league’s Rookie of the Year award. I figured it would be a prospect list for fantasy managers to become familiar with. The narrative would be that these inside sources would know the players who would be productive and play enough to win the award. Production and playing time are the two traits needed to be a solid fantasy option. Since this is the poll’s fourth year, I examined previous editions to determine how these executives performed.
The information in the polls is scarce, so all the small sample caveats apply. The results have been collected over the past three seasons (2023, 2024, 2025). In each one, a percentage of executive votes is included. The full list of previous players is at the end of the article.
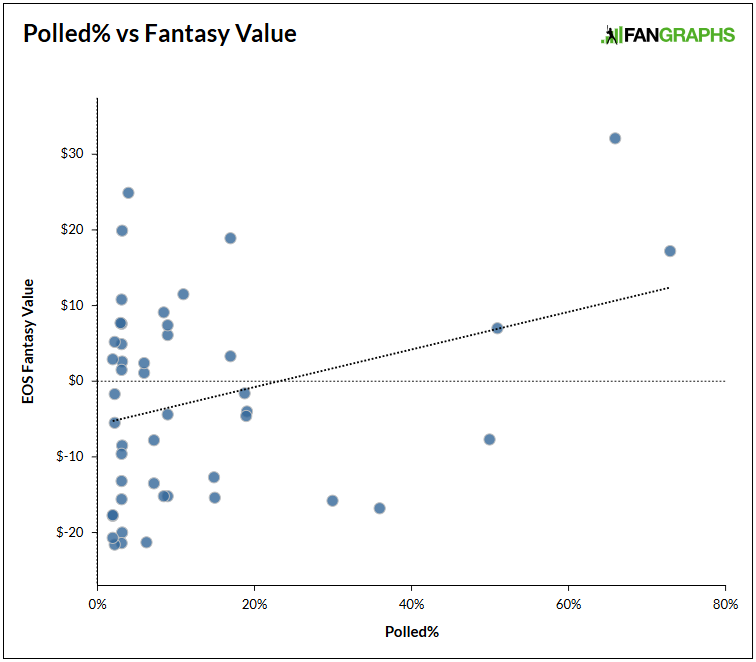
To each player, I included our Fantasy Player Rater 12-team end-of-season dollar value. Then, I began grouping away. First, here is a plot of all the values.
Besides the four players polled at 50% or higher, the values seem to be fairly random. I grouped the values into four groups based on their polled percentage. Also, I combined the three low-polled groups.
Fantasy Production Based on Polled%
Polled%
Avg EOS Fantasy Value
% over $0
% over $5
Count
>= 50%
$12
75%
75%
4
15% to 49%
-$5
11%
22%
9
5% to 15%
-$3
33%
50%
12
1% to 5%
-$4
27%
45%
22
1% to 49%
-$4
26%
42%
43
That top group (n=4) seems to be productive, with the rest of the values being a complete crap shoot. The final line is the most useful. There is a 25% chance of these players contributing more than $5 and a 40% chance of being positive.
With the historical results, here are this year’s lists.
None of the players meet the 50% threshold, so no one is on the must-target list.
Fantasy managers should spend a few minutes on each of those players and track their results. Who knows which one will stand out? Nick Kurtz received just one vote last year and was a league winner.
The 2026 edition of The Process is now available in PDF form. The appendix edition includes 148 pages and over 25 new studies from Jeff and other contributors! The research covers NFBC draft theory and strategy, hitter evaluation, and pitcher evaluation.
Considering the historic turnaround times (all out of our hands), the paper copy will be available on Amazon in about a month. Read the rest of this entry »
This past season was one of my worst ever. And about halfway through it, the outcome looked worse than the final results. I was able to focus on a few leagues and salvaged my bankroll. Here are some of the lessons I learned. Read the rest of this entry »
On Sunday, I read the following comment on Rotoworld about Chase Burns‘ start:
His fastball was located well, but, as has been true in his first two starts, he doesn’t get tons of whiffs on the pitch. He had eight whiffs on 55 total fastballs in this one, with a whopping 16 foul balls. His fastball has below average extension and simply isn’t as elite of a pitch against big league hitters who can handle high velocity.
Sure enough, his four-seamer has generated just a 7.6% SwStk% despite the pitch averaging a scintillating 98.2 MPH. So it got me thinking about perceived velocity, which extension affects. If a pitcher is throwing 95 MPH, but the batter perceives the pitch’s velocity to actually be 97 MPH, or perhaps 93 MPH, that should matter, right? I would therefore think the gap between perceived and actual velocity would influence the pitch’s whiff rate and the pitcher’s strikeout rate. So I decided to dive in and find out if that theory is true.
I follow a ton of different news sources besides baseball. An article titled “Q1 AI Benchmark Results: Pro Forecasters Crush Bots” caught my eye. I’m not at all surprised by the results, as stated in the title, but I did find one part fascinating. There are generally two parts to AI predicting: the AI itself (e.g. ChatGPT) and a news source. On the news sources, this quote caught my eye.
AskNews is better than other search providers: We have found that a bot using AskNews performs better than bots that use Exa or Perplexity. The template bot was used to test this. The difference between these bots is noticeable, but is not statistically significant.
As someone who mines the news all the time, I was wondering if AskNews.app could supplement my digging. Let’s find out.
Disclaimer: People seem to be on the extreme sides of AI, either they hate or think it’s the great invention of all time. I’m probably somewhere more in the middle. The one aspect I’ve used it for more than any other is coding. I feel I getting coding answers at least 10 times faster than if I did them on my own. I’ve written an app that lets me know if there are any updates to any of the MLB.com injury/transaction pages. I’ve never used it for writing (obviously), but it has it uses.
I decided to give AskNews a test drive yesterday, and the results were interesting, with Fernando Tatis Jr. now throwing 96 mph with a new changeup.
When analyzing players, I want more than a one-line projection, I want a range of possible outcomes. The problem with comps is that they are time-intensive. Once the worksheet is setup, a person can select and download the desired output in a few seconds. Here is the outputted table from the example procedure explained below.
Ask a few Orioles hitters for their immediate reactions to news that the club is moving in the left field wall, and their approval can be seen on their faces.
The above quote came from the Orioles caravan and got me thinking about how projections incorporate three new park changes.
I’ve seen the park changes referenced in articles and pods for reasons to fade or target certain players. I lean on projections and assume that they incorporate dimensions into account when they create their projections. If the changes are already accounted for, I don’t want to overrate affected players. After looking over various projections, most seem to take the changes into account, but some haven’t yet. Read the rest of this entry »
It’s time to dive into more hitter projection comparisons after examining playing time a while back. In this article, I’ll show which projections are best in the standard roto categories (R, RBI, HR, SB, and AVG) and at the end, look at ways playing time projections could be improved.
For all the background information on the test I used (RMSE) and data sample reference the first article. These tests take forever to run and at some point, I kept getting the same answers (smartly aggregating the projections), so I stopped running any new ones for hitters. Here are the results for the tests I ran.
Test 1: Batting Average
The only hitter rate stat, batting average, begins the analysis.
2024 Projection Showdown: Batting Average
Projection
RMSE
Average
0.0388
Paywall #1
0.0395
THE BAT X
0.0406
4 Free Projs
0.0406
ZiPS
0.0407
Depth Charts (FG)
0.0409
ATC
0.0409
DraftBuddy
0.0409
Zheile (FantasyPros)
0.0409
Median
0.0410
Paywall #7
0.0410
Paywall #4
0.0410
Paywall #8
0.0413
Steamer (FG)
0.0413
Razzball
0.0414
Davenport
0.0415
Paywall #2
0.0415
Marcels (BRef)
0.0420
Paywall #3
0.0422
Fantrax
0.0425
Paywall #6
0.0428
Razzball (Grey)
0.0439
While some individual projections are near the top, the averages and aggregators stay strong.
Test 2: Home Runs
Here is how the projections performed when looking at the raw number of home runs.
2024 Projection Showdown: Home Runs
Source
HR Raw
Paywall #7
11.9
Marcels (BRef)
12.0
Davenport
12.5
Average
12.7
4 Free Projs
12.9
Paywall #1
13.0
ZiPS
13.1
Razzball
13.3
THE BAT X
13.3
Median
13.4
ATC
13.5
Zheile (FantasyPros)
13.6
DraftBuddy
13.7
Paywall #6
13.9
Depth Charts (FG)
14.0
Paywall #4
14.1
Paywall #3
14.1
Steamer (FG)
14.1
Paywall #8
14.3
Fantrax
14.3
Razzball (Grey)
14.4
Paywall #2
14.6
With Paywall #7 and Marcels crushing the playing time estimates, it’s no surprise they are at the top. And here are the home projections prorated per plate appearance.
2024 Projection Showdown: Home Runs per PA
Source
HR/PA
Paywall #7
0.0184
Average
0.0186
Davenport
0.0188
Paywall #1
0.0191
4 Free Projs
0.0196
Marcels (BRef)
0.0198
Median
0.0199
Depth Charts (FG)
0.0199
ZiPS
0.0200
Steamer (FG)
0.0200
ATC
0.0202
THE BAT X
0.0202
Razzball
0.0202
DraftBuddy
0.0202
Paywall #3
0.0208
Paywall #2
0.0209
Paywall #8
0.0211
Paywall #4
0.0213
The big surprise was that Marcels remained near the top even when the home runs were turned into a rate stat. The aggregators held up but weren’t as strong as previous tests.
Test 3: Stolen Bases
Here are the stolen bases projections ranked by the raw number
2024 Projection Showdown: Stolen Bases
Projection
SB
Average
8.50
Razzball
8.61
4 Free Projs
8.73
Davenport
8.80
Paywall #7
8.87
Paywall #8
8.93
Median
8.95
Zheile (FantasyPros)
9.00
ZiPS
9.05
Steamer (FG)
9.05
THE BAT X
9.08
Marcels (BRef)
9.09
ATC
9.09
Depth Charts (FG)
9.10
DraftBuddy
9.11
Paywall #6
9.12
Fantrax
9.33
Paywall #2
9.40
Paywall #1
9.42
Paywall #3
9.56
Razzball (Grey)
9.73
Paywall #4
9.81
A new order of projections on this raw stat … well besides the averages performing near the top. Here they are as a rate stat.
2024 Projection Showdown: Stolen Bases Per Plate Appearance
Projection
SB/PA
4 Free Projs
0.0132
Median
0.0132
Average
0.0132
Depth Charts (FG)
0.0132
ATC
0.0133
Razzball
0.0133
DraftBuddy
0.0133
ZiPS
0.0133
Steamer (FG)
0.0133
THE BAT X
0.0134
Paywall #2
0.0134
Marcels (BRef)
0.0134
Davenport
0.0136
Paywall #1
0.0139
Paywall #3
0.0139
Paywall #7
0.0139
Paywall #4
0.0141
Paywall #8
0.0142
That’s some domination by the aggregators by taking the top five spots.
Test 4 Runs plus RBI (R+RBI)
I combined the two because the results were consistent (aggregators kicking ass) and I just wanted to see if any of the results stood out like with stolen bases.
2024 Projection Showdown: Run and Stolen Bases
Source
R+RBI
Marcels (BRef)
57.7
Paywall #7
57.7
Average
61.9
Davenport
62.6
4 Free Projs
63.8
THE BAT X
64.0
Razzball
64.8
ATC
64.8
Paywall #4
65.5
Median
65.8
DraftBuddy
66.2
ZiPS
66.5
Zheile (FantasyPros)
66.8
Paywall #6
67.4
Paywall #1
68.0
Paywall #3
68.0
Fantrax
68.3
Paywall #8
68.7
Steamer (FG)
69.2
Razzball (Grey)
69.5
Depth Charts (FG)
70.7
Paywall #2
71.5
Nothing changed. Correctly guessing playing time allows a projection to dominate these rankings. It’s time to move on.
Conclusions on Hitter Projections
The answer is simple, get an aggregation of projection. ATC and Zeile already do the combination. Or a person could use Tanner Bell’s projection aggregator to personally control the inputs and weighting.
Additionally, if combining projections, I would not pay up for any with Razzball, ZiPS, THE BAT X, and Davenport all performing great.
Test 5: Where Projections Miss
Note: I cut and diced the available information in what seemed a 100 different ways. The following are the two best examples I found for why projections miss. I’m sure there are better ways to improve projection playing but I haven’t havent figured them yet.
From some of my unpublished work, I have determined that projections miss based on age, previous playing time (proxy for health), and talent (projected OPS). I wanted to find out why Marcels performed better than the standard projections. In 2024, here are the players the 4 Big Projs projected for more playing time than Marcels.
2024 Projection Showdown: Playing Time Differences
Name
Position
4 Free Projs – Marcel
Evan Carter
OF
80.7
Oneil Cruz
SS
78.5
Rhys Hoskins
1B
75.0
Christian Encarnacion-Strand
1B
66.5
Vinnie Pasquantino
1B/DH
63.4
Ceddanne Rafaela
SS/OF
59.5
Parker Meadows
OF
53.2
Elly De La Cruz
SS
47.6
Royce Lewis
3B
44.7
Trevor Story
SS
44.5
Nolan Jones
OF
44.1
Sal Frelick
OF
42.7
Zack Gelof
2B
42.6
Logan O’Hoppe
C
37.4
Jordan Walker
OF
35.9
Riley Greene
OF
33.9
A table full of prospects (e.g. Carter, Cruz) or injured players (e.g. Lewis, Hoskins). This verifies some of my previous findings that players with checkered playing histories miss their playing time projections.
Dropping the playing time on hurt guys is not hard but it is tougher with guys like Elly. If he plays every day, he’s a steal.
For the next example, I grouped hitters by their Marcel playing time projection and combined plate appearances from the previous two seasons. Then I compared our 2021 to 2024 projected Steamer plate appearances to the actual number. Here are the results.
2024 Projection Showdown: Playing Time Overestimates
Marcels (.5 * Prev + .1 * Prev2 + 200)
PA
PA
Avg PA Diff
Avg OPS
525
650
38.3
0.797
350
525
45.9
0.749
200
350
22.0
0.719
Previous 2 seasons PA total
Min PA
Max PA
Avg PA Diff
Avg OPS
1100
1500
36.1
0.797
700
1100
56.7
0.765
0
700
24.2
0.724
Steamer’s plate appearance projections perform great for regulars or bench bats. The players between those two are the toughest to estimate with over 500 PA in each previous season needed for a solid playing time projection.
While I focused on our Steamer projections, all of the other projection systems over project playing time compared to Marcels. They likely had the same issues. A fantasy manager might need to some way take into previous playing time while making future estimates.
For right now, I don’t know the right answer. As a group, it is a little embarrassing that a simple formula kicked everyone’s collective ass in playing time. In the previous article, I mentioned adding in a computer projection (e.g. Marcels) to temper expectations. I stand by that observation. For now, that’s all I can recommend.