Archive for Hitters

Launch Angles, Release Points and Hit Predictability

Through games played on June 23rd, 2022, Luis Arraez held the highest batting average in the MLB at .349. He was just ahead of Paul Goldschmidt (.340), who was in the midst of putting together a career year, and Xander Bogaerts (.335), who was just being Xander Bogaerts. So, if you had chosen a player that you thought was most likely to get a hit the following day, June 24th, any of those three players would have been a safe bet. But, it’s just not that simple, is it? Goldschmidt played the next day but went 0-4. Arraez played and went 0-4. Bogaerts didn’t play. And that really is the challenge in trying to predict something like who will get a hit each day. That’s why there remains a $5.6 Million jackpot on the line.

I’ve written about my ventures in using analytics and a predictive model (Jolt) to help with daily batter hit predictions while playing in the Beat the Streak contest. You can learn more about the contest here, you can listen to a podcast about it during the season and you can sign up to the play game yourself! I won’t write much about the specifics of the contest, but it is the motivation for this research. The general idea is that you choose a player each day that you think will get a hit, if he does, you get a point, if he doesn’t, you go back down to zero. The goal is to reach 56. But, strip away the millions, strip away any contest or fantasy-style game, and what we’re left with is the question of how to best predict the next day’s hitters.

Jolt, the name of the model I’ve built to aid in making this prediction and a tribute to “Joltin” Joe DiMaggio, was built on the concept that the launch angle and launch speed of the hitter matter tremendously. Since we know that certain launch angles are more likely to lead to a hit and that balls hit hard also add to that likelihood, we can look for players who do that type of thing often. To show this in a visualization I randomly sampled a few days’ worth of savant batted ball data for each month of the 2022 season, sub-set that data down to only looking at batted balls from four-seam fastballs, and looked at the distribution of hits versus non-hits:
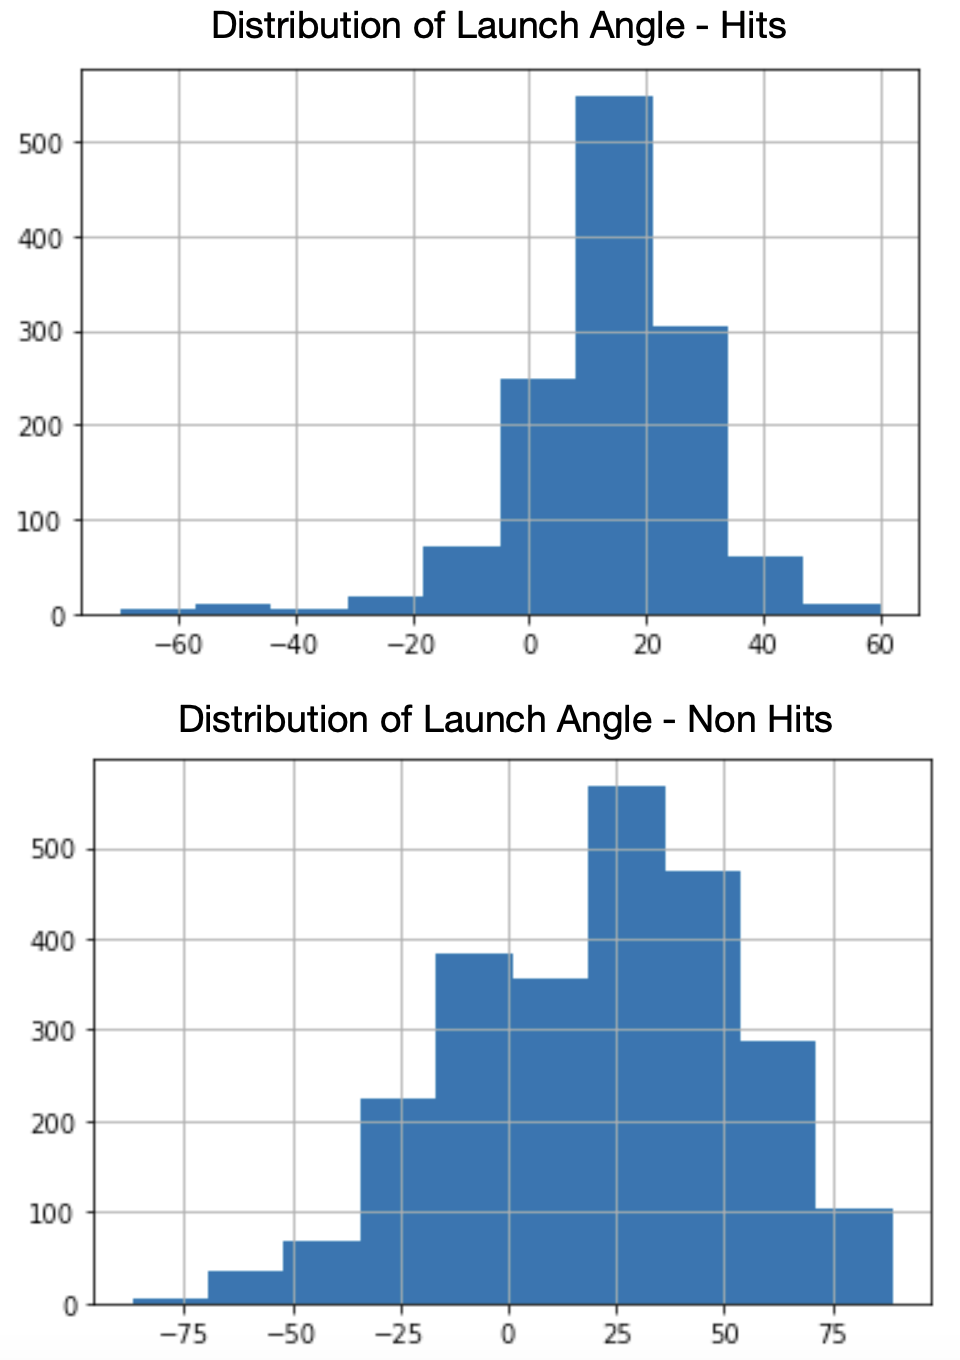
Launch Angle Distributions - Hits vs. Non-Hits

In this sample of data, batted balls (this does include home runs) ended in hits much more often with launch angles between, roughly, 10 and 20 degrees and that is something we have known for a while now. Balls launched at these angles have a much higher likelihood of being line drives and therefore, more difficult for fielders to get to. Let’s use this information and go back to June 24th. Through games played on the 23rd, there were eight hitters right in that solid average launch angle of 18 degrees bin. Here they are along with their up until that point batting average and June 24th results:

Hit Results 6/24/22, Mid Average LA
Name LA AVG 6/24/22
Mike Yastrzemski 18.8 0.250 1-4
Will Smith 18.8 0.256 2-5
Justin Turner 18.8 0.220 0-4
Ha-Seong Kim 18.8 0.226 1-3
Christian Walker 18.5 0.208 1-4
Cedric Mullins II 18.4 0.248 1-4
Marcus Semien 18.2 0.228 2-5
Mookie Betts 18.1 0.273 0-0
*Among qualified hitters with a 18 degree average launch angle through 6/23/22

Yahtzee! Is it really that easy? Just pick the hitter who has been to the plate a lot and has a level, hit-falling average launch angle? You might think this is basically the same as selecting line-drive hitters, but it’s not. At least, those two measurements aren’t showing the same hitters. Only Will Smith found himself in both the group of players above and in the top 20 qualified hitters by line-drive percentage. The funniest part about this sample of hitters is that the hitter with the highest batting average, Mookie Betts, is one of only two players to not get a hit the following day. This is random of course. But, just for kicks, let’s do it with hitters who had been putting the ball on the ground (5 degrees) too much through June 23rd and look at how they did on the 24th:

Hit Results 6/24/22, Low Average LA
Name LA AVG 6/24/22
Yandy Díaz 5.1 0.263 0-4
Nicky Lopez 5.1 0.217
Vladimir Guerrero Jr. 5.3 0.264 2-5
Miguel Cabrera 5.7 0.299 1-4
Juan Soto 5.8 0.214 1-4
*Among qualified hitters with a 5 degree average launch angle through 6/23/22

Ok, theory killed? Clearly you can see from the histograms that while a launch angle in the 10 to 20 range falls for a hit more often, there are a lot of other launch angles that fall for hits too. Those same launch angles don’t fall for hits as well. While finding players who have a tight launch angle, Alex Chamberlain style, would be a good strategy, you would likely find yourself choosing the same handful of hitters every day, thus limiting your player pool. Just look at Paul Goldschmidt’s 2022 cumulative average launch angle:
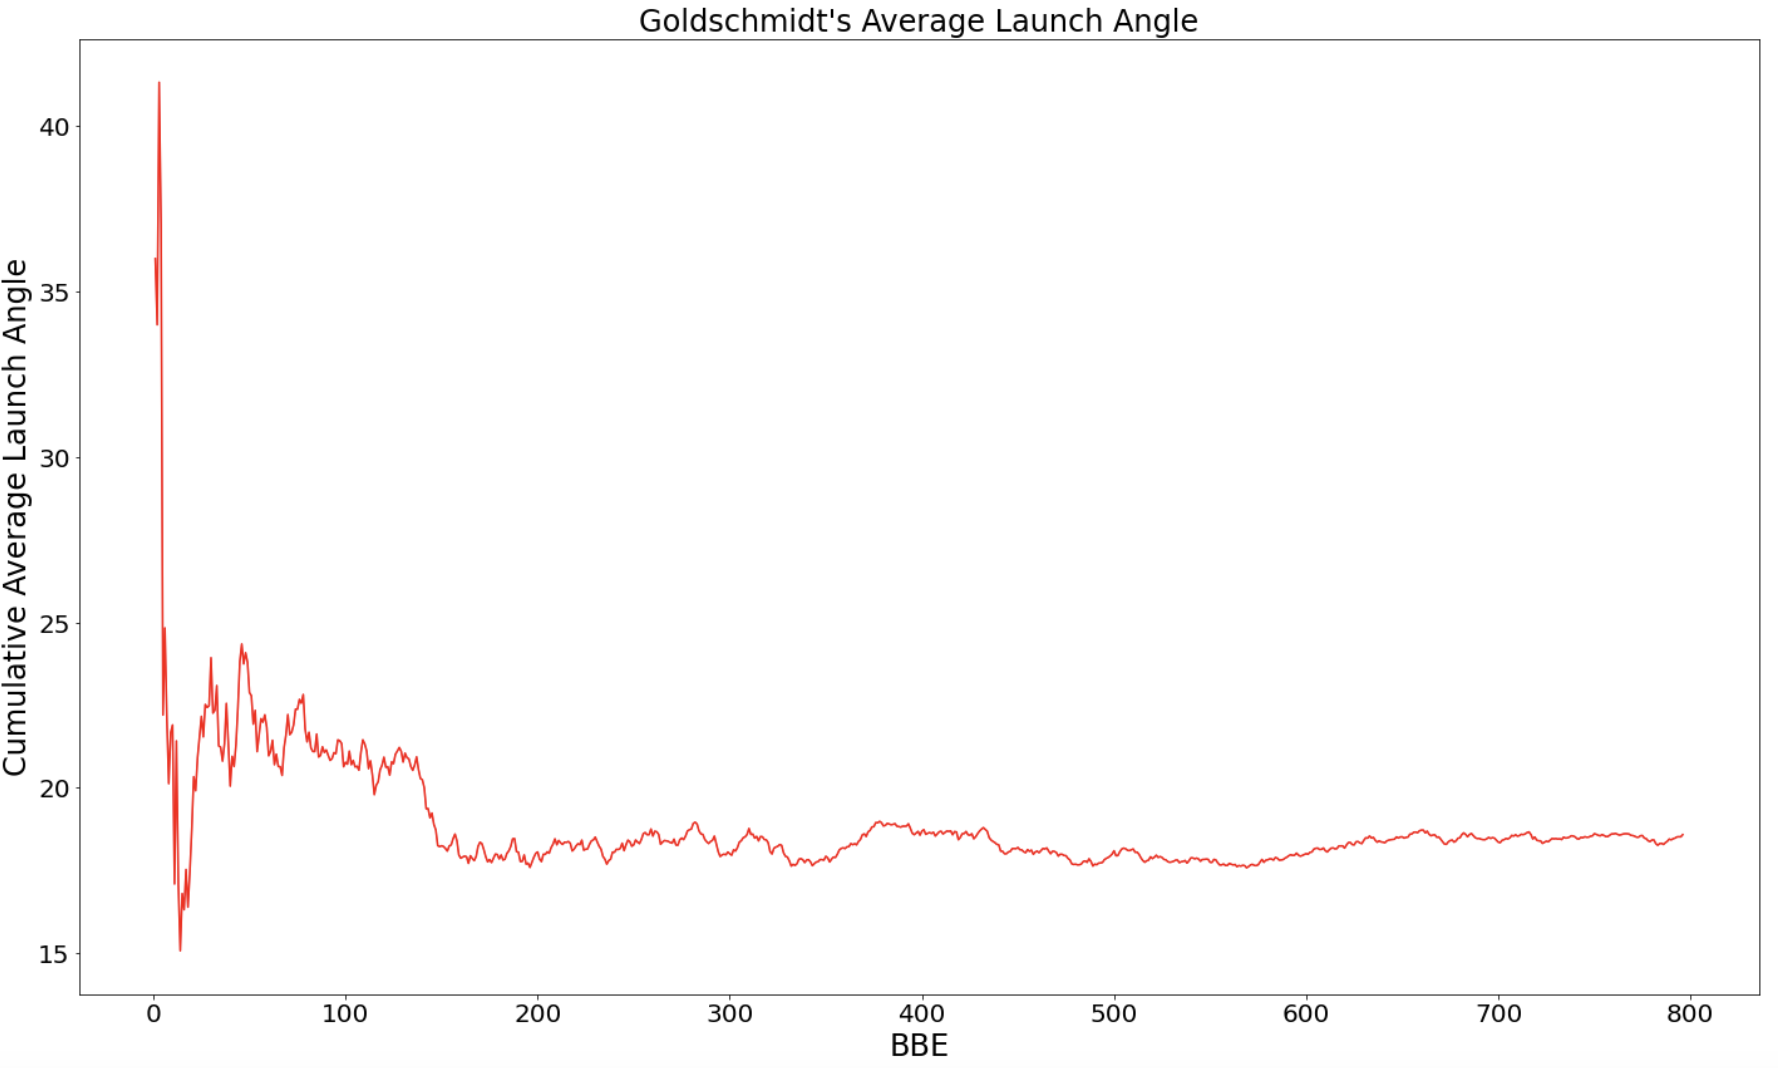
Goldschmidt Cumulative LA

It becomes fairly stable around BBE number 200. Choosing Goldy every day would have been a good strategy in 2022, but for obvious reasons wouldn’t allow you to string together 56 consecutive hits and that’s the name of the game. It would also fail to take into consideration who was throwing the ball, which is arguably 50% (but probably more) of the equation. Jolt’s first iteration sought to find players with good launch angles matching good release points. The thinking was that high release points translate to higher approach angles and that uppercut swings bring the bat through the zone on those particular pitches longer. It’s not a new concept in baseball. Ted Williams’ 1986 book, The Science of Hitting, detailed some of this thinking.

It was even backed up by the model’s validation. Jolt, iteration one, found ‘release_pos_z’, or the “vertical release position of the ball measured in feet from the catcher’s perspective” according to baseball savant, as the fifth most important variable in predicting a hit out of all of statcast’s outputs. Unfortunately, this is much, much more descriptive than it is predictive. A trained model will say that the launch angle of a batted ball and the release point of the pitch help “predict” whether the ball falls for a hit or not. While a release point, especially if you isolate to single pitch like just a fastball, can be predicted, you can’t really predict at which angle the ball will be hit before the batter swings. Here’s an example:
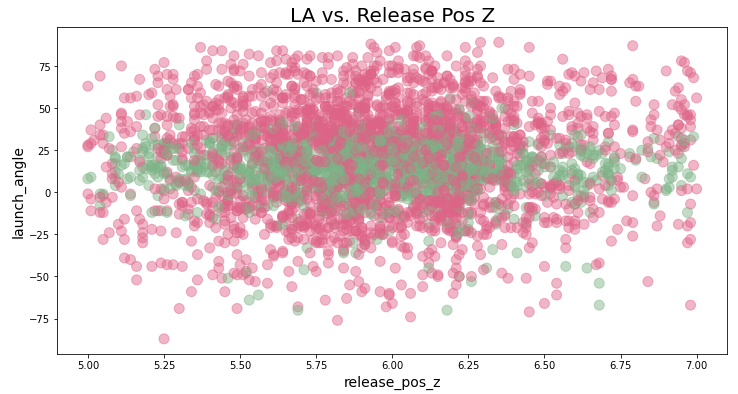
Release Pos Z vs. LA Scatter Plot

In this image, green represents hits in the data and red represents non-hits. The green band going across the chart tells us just how important the launch angle is, but it doesn’t have a relationship with the release point of the pitch. Any of these release points can match up with any of these launch angles and fall for a hit. It is uncommon for any launch angle above ~70 degrees to fall for a hit, but there may be a few outliers in there. Regardless, matching up a pitcher’s release point with a batter’s launch angle doesn’t seem to provide much detail when analyzing this data. Most of us would completely disagree with the data in this case, but it doesn’t mean that hitters are actively upper-cut swinging on high-released fastballs because I would imagine, that’s friggin’ impossible to do. But maybe it naturally happens? Maybe looking at it from a vertical approach angle (VAA), the angle of the ball as it crosses into the zone, is the better…um…approach? Let’s see:
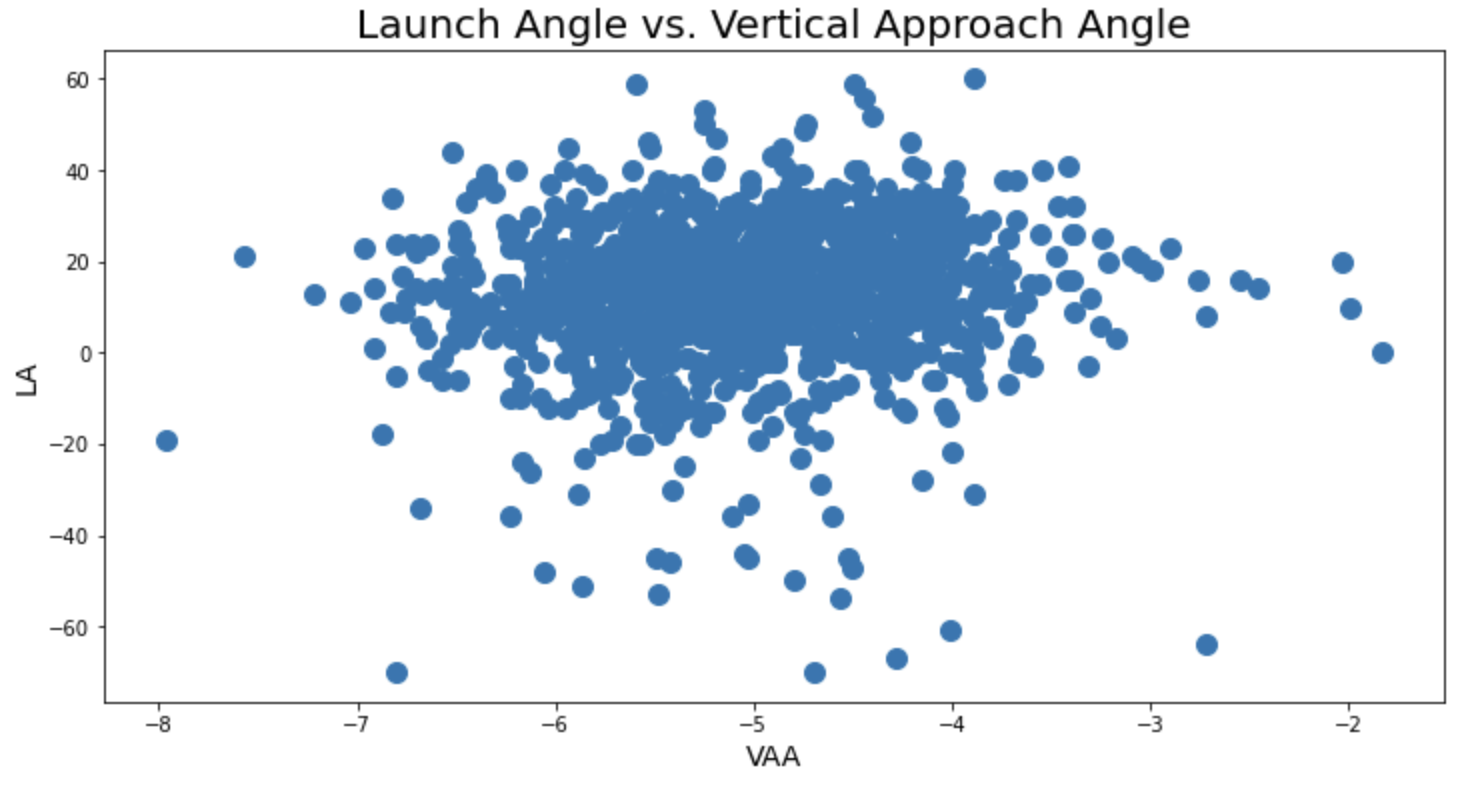
LA vs VAA (FA)

This graph would tell you that besides the outliers, all VAAs can be hit with all LAs. Again, there is a HUGE discrepency between what we computer baseball nerds see and read and think and what a hitter actually does. If there are any hitters out there who know that tomorrow’s starting pitcher has a very steep vertical approach angle, are they altering their swing or approach to match it? Um…I’ll guess…no. It’s hard enough for them to decide to swing or take. But there must be somethign I’m missing. The launch angle in which a ball that falls for a hit is struck may not necessarily relate to how high the pitcher is releasing the ball, but certainly, some swing types are better against those pitches than others. But what is measuring that? What is measuring the actual swing? There have been some attempts made like the data collected by Swing Graphs, but nothing that I’ve seen is freely available to the public.

A model, whether it has a good R-squared, average-squared error, misclassification rate, or get-a-lot-of-likes-on-twitter rate, doesn’t do a good job of telling us whether a certain launch angle will be more successful against a certain vertical approach angle because it’s just too random and there’s too much noise. It’s also too difficult to create that data before it happens in order to make predictions on it. But, Jolt simply won’t quit. Iterations continue and there remains work to be done to better model tomorrow’s hit likelihood. In fact, MLB does it for its Beat the Streak app. But, no one has found success in just picking the top-recommended hitter each day, have they? Of course, I’m not implying that a model will be the only way to win this contest, in fact, I don’t think one single person will ever be able to win this contest. However, sometimes a simple model coupled with logical thinking and sound judgment is best. Jolt’s next attempt will focus on that. Just look at the table of June 24th’s outcomes at the top of this page and you’ll see, there’s something to just choosing who is hot each day and who works well against the guy standing on the mound.
2023 Projection Showdown — THE BAT X vs Steamer wOBA Forecasts, Part 1

I’ve finished the fantasy stat comparisons of the 2023 projection showdown between THE BAT X and Steamer on the hitting side, so now let’s flip to wOBA. Why does wOBA matter if it’s typically not a fantasy category? Because it influences both playing time and lineup spot. It doesn’t matter if a hitter produces the nice mix of home runs and stolen bases that fantasy owners drool over if that same hitter is struggling to keep his wOBA over .300. A poor wOBA could result in a drop in the batting order, which would reduce the hitter’s counting stats, and/or a spot firmly on the bench or even a demotion to the minors. On the other hand, a strong wOBA, especially one that’s beating expectations, could trigger a move to a better lineup spot, increasing counting stats, or increase playing time if the players wasn’t a full-timer at the moment. So wOBA definitely matters…a lot! Let’s begin by identifying the hitters THE BAT X is more bullish on for wOBA than Steamer.

Read the rest of this entry »


2023 Projection Showdown — THE BAT X vs Steamer Runs Scored Forecasts, Part 2

Yesterday, I listed and discussed six hitters who THE BAT X was significantly more bullish on for runs scored than Steamer. Let’s now find out who Steamer’s runs scored favorites are compared to THE BAT X.

Read the rest of this entry »


2023 Projection Showdown — THE BAT X vs Steamer Runs Scored Forecasts, Part 1

Let’s continue rolling on with the 2023 projection showdown, pitting THE BAT X against Steamer in the various fantasy categories and discussing the players each system is more bullish on. Today, we shift over to runs scored (R) and follow the same 650 plate appearance pace calculation I’ve been using. Batting order position plays a huge role here, as the higher up in the lineup, the more plate appearances a hitter will receive, providing more opportunities to score runs. But of course, we’re keeping PAs constant, so batting order doesn’t play that role here. Instead, since all the best hitters are typically in the top five spots, being ahead of the stronger hitters makes it more likely you’ll be knocked in after reaching base. Obviously, home run power also increases runs scored as it’s a guaranteed run. So lineup spot and power are two major factors in runs scored, plus OBP, for obvious reasons. Let’s find out who THE BAT X is most bullish on in runs scored versus Steamer. You might see some familiar names THE BAT X has been bullish on in other categories too, which makes sense given that if a system is more bullish on overall performance, it’s likely that results in higher counting stats across the board.

Read the rest of this entry »


2023 Projection Showdown — THE BAT X vs Steamer RBI Forecasts, Part 2

Last Thursday, I listed and discussed the hitters who THE BAT X was more optimistic on for RBI than Steamer. Now let’s switch over to the batters Steamer is more bullish on for RBI than THE BAT X.

Read the rest of this entry »


Projected Category Distributions by Position

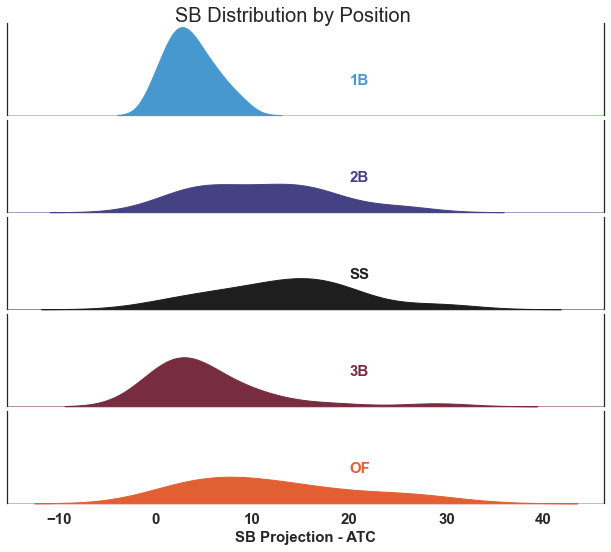
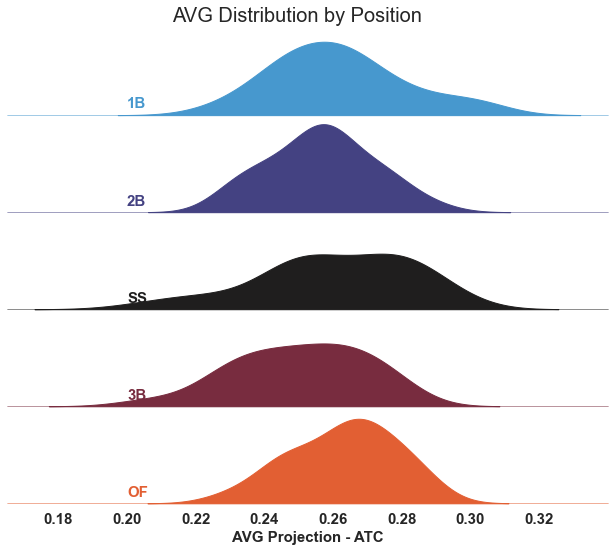
A ridgeline distribution plot allows you to easily compare distributions across multiple categories. For this post, I’ve created one plot for each classic 5×5 roto category and position. I used ATC projections to graph the distribution and I’ll point out a few interesting trends that we can gather from each visual. Let’s have some fun with visualizations!

Stolen Bases

Projected ATC SB Distribution by Position

First, you may notice the left tail of this visual goes below zero. Since the ridgeline creates a smooth curve over where the bars of a histogram would be, it smooths out into an area that may not be represented by data. However, if you take your cursor and move up the zero line, you can see that there are a lot of 1B and 3B players projected for one stolen base. The same happens on the right side of each plot. ATC projects only two outfielders for 30+ stolen bases, Ronald Acuña Jr. and Jake McCarthy.

The ridgeline essentially stops at 32 (Acuña’s projection) and tails off from there. So, it’s best not to focus too much on the tails of these graphs but instead on the peaks and to the left and right of the peaks. If you do that, you may notice that there’s a wide range of base-stealers in the SS, 2B, and OF positions, but you already knew that. Instead, look at the 1B peaks and notice that you can target players projected to accumulate six or more stolen bases. Here they are:

1B with 6+ Stolen Bases
Name Team G PA AB HR SB
Freddie Freeman LAD 155 675 582 25 10
Miguel Vargas LAD 122 472 423 14 8
Seth Brown OAK 126 494 447 22 8
Paul Goldschmidt STL 152 650 567 30 7
Vladimir Guerrero Jr. TOR 152 657 583 35 6
Anthony Rizzo NYY 135 571 492 26 6
Wil Myers CIN 122 488 439 17 6
*ATC Projections

This mostly goes to show why players like Freeman, Goldschmidt, and Guerrero Jr. are all elite picks. However, you can pick up a few SBs in Rizzo and Myers without spending too much. That could be valuable on the bench. Miguel Vargas is penciled in as the second base nine-hole hitter on the Dodgers’ Roster Resource, but if he has 1B eligibility in your league, he may be a nice late-round flier.

Batting Average

Projected ATC Average Distribution by Position

Different from stolen bases, we see that there are players all over the field who can provide high averages. However, take your cursor and move it from top to bottom along the .300 line. You’ll notice that the 1B and SS lines keep going whereas the OF, 2B, and 3B lines stop. There are a few 1B and SS players skewing the distribution to the right. Who are they?

Top 1B by Projected AVG
Name Team G PA AB HR R RBI AVG
Luis Arraez MIA 136 573 515 6 75 54 0.302
Freddie Freeman LAD 155 675 582 25 106 93 0.301
Vladimir Guerrero Jr. TOR 152 657 583 35 96 102 0.289
Harold Castro COL 40 154 145 2 16 17 0.285
Paul Goldschmidt STL 152 650 567 30 95 97 0.281
Vinnie Pasquantino KCR 139 581 509 22 68 77 0.279
Harold Ramírez TBR 110 442 411 8 46 52 0.278
Donovan Solano 73 287 262 5 29 30 0.274
DJ LeMahieu NYY 110 473 417 9 59 44 0.273
Nathaniel Lowe TEX 146 613 546 22 75 75 0.273
José Abreu HOU 147 626 555 21 78 83 0.272
*ATC Projections

If you don’t think Freeman, Goldschmidt, and Guerrero Jr. are worth the spend (roto or salary) then what will it take? These three show up as top targets in both stolen bases and batting averages among first basemen. I wonder if they hit home runs too? But, if you want to zip when everyone else zags, look no further than Pasquantino, Lowe, and Abreu. Yes, you’re faced with a big drop-off in runs, but you still have a power/average combo at a more modest price. How about the shortstops?

Top SS by Projected AVG
Name Team G PA AB HR R RBI AVG
Trea Turner PHI 152 663 607 22 101 81 0.292
Tim Anderson CHW 131 576 544 14 82 55 0.291
Wander Franco TBR 140 602 546 13 82 69 0.286
Bo Bichette TOR 150 652 603 25 93 88 0.285
Corey Seager TEX 143 617 546 28 84 83 0.278
Nico Hoerner CHC 137 560 511 9 68 55 0.278
Amed Rosario CLE 145 618 582 11 78 65 0.277
Fernando Tatis Jr. SDP 116 497 437 31 82 81 0.277
*ATC Projections

While it’s a smaller list, there’s a lot to like. We can deduce shortstops are more likely to provide an average/speed combination and that first basemen are likely to provide a power/average combination when targeted appropriately.

Home Runs

Projected ATC HR Distribution by Position

This time, take your cursor and drag it from the top of the visual to the bottom at the 35 mark. What I find interesting here is the power drop off at 3B. Many fantasy analysts have been writing and talking about the major drop off at the 3B position, and this visual reinforces it. First base shows up yet again as such a critical spot and OF positional players hold a lot of power beyond that 35 mark. Here are the OF and 1B players projected to hit 30 or more homeruns by ATC:

OF and 1B 30+ HR Projections
Name Team G PA AB HR
Aaron Judge NYY 149 645 545 43
Mike Trout LAA 139 601 509 40
Kyle Schwarber PHI 144 616 527 39
Pete Alonso NYM 154 656 572 38
Yordan Alvarez HOU 144 611 526 38
Vladimir Guerrero Jr. TOR 152 657 583 35
Matt Olson ATL 154 657 569 35
Kyle Tucker HOU 152 630 564 33
Mookie Betts LAD 146 643 563 31
Byron Buxton MIN 120 507 458 31
Paul Goldschmidt STL 152 650 567 30
Rowdy Tellez MIL 137 558 494 30
Juan Soto SDP 151 664 521 30
Teoscar Hernández SEA 139 589 540 30
Anthony Santander BAL 141 605 548 30
Giancarlo Stanton NYY 122 514 454 30
*ATC Projections

Runs

Projected ATC R Distribution by Position

RBI

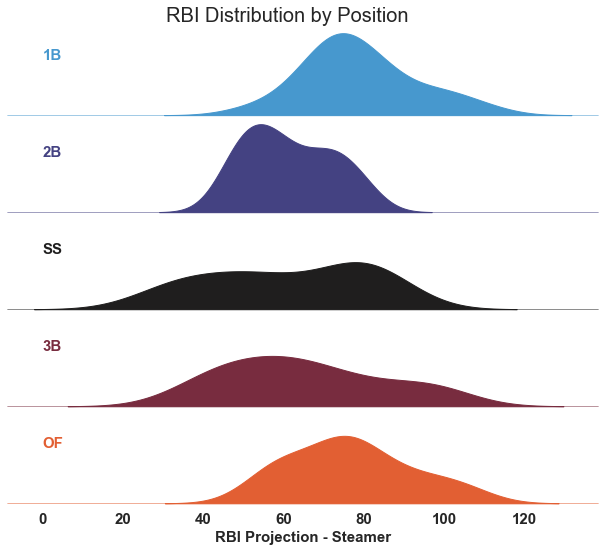
Projected ATC RBI Distribution by Position


Runs and RBI come from offensively productive players and it helps when they are on good teams. These visualizations reinforce the importance of drafting top-tier 1B and 3B players. But, the distributions are a little more even. Certainly OF players are holding higher run totals, but projected RBI totals are shared fairly evenly among OF, 3B, and 1B players.

If you want a larger summary of what to glean from these distributions it’s that waiting on corner infielders is not recommended, that you can double up on speed and batting average from shortstops, and power doesn’t have to come with empty stolen base potential and that there is simply more production in total to be found in the OF position.


2023 Projection Showdown — THE BAT X vs Steamer RBI Forecasts, Part 1

Let’s continue rolling on with the 2023 projection showdown, pitting THE BAT X against Steamer in the various fantasy categories and discussing the players each system is more bullish on. Today, we shift over to runs batted in (RBI) and follow the same 650 plate appearance pace calculation I did when reviewing stolen base forecasts. RBI are driven by a couple of factors — the batter’s own offense, particularly his power/extra-base hit ability, his spot in the lineup (middle of the order, spots 3-5, are best), and the performance of the hitters ahead of him in the lineup (ideally, they are high OBP, but lower in power so they drive in other runners or themselves via the home run less frequently and leave more for the batter in question). Since one of those factors is power, driven significantly by home runs, there will be some similar names here to what made THE BAT X home run favorites list. That makes sense! So let’s get to it.

Read the rest of this entry »


2023 Projection Showdown — THE BAT X vs Steamer Batting Average Forecasts, Part 2

Yesterday, I pivoted the 2023 projection showdown pitting THE BAT X against Steamer to batting average. These were the hitters THE BAT X was more bullish on for batting average than Steamer. Now let’s find out who Steamer is more bullish on than THE BAT X for batting average and what’s driving the difference in forecast.

Read the rest of this entry »


2023 Projection Showdown — THE BAT X vs Steamer Batting Average Forecasts, Part 1

Let’s continue the 2023 projection showdown, pitting THE BAT X against Steamer in the various fantasy categories. Today, I’ll shift over to batting average, and identify and discuss the hitters that THE BAT X is more bullish on than Steamer. Unlike the counting stat showdowns, there’s no need to perform extra calculations to account for different PA forecasts, making it a whole lot easier! Batting average differences are primarily driven by disagreements over projected BABIP and/or strikeout rate, so let’s find out what’s fueling THE BAT X’s optimism.

Read the rest of this entry »


2022 Projection Accuracy: Hitter Rate Stats

It’s time for another examination of projection accuracies while I finish up hitters. I will focus on rate stats along with a different look at the RBI and Runs totals. The results are just slightly different than last year and now the aggregators take the top

From last season, here was my conclusion on the rate stats.

Hitter Rate/Counting Stats

For the stand-alone projections, THE BAT’s stand out (I’d use THE BAT X). Just below THE BAT are all four aggregators.

As for the background on how I’m comparing the projections, it can be found in this article. Additionally, I examined the counting stat accuracy in another article. Read the rest of this entry »