Ottoneu: Jake’s 2026 Keep or Cut Decisions at OF

The Ottoneu keeper deadline is quickly approaching. There’s less than a month left to make your roster decisions before the January 31 cut deadline. I’m going through a handful of difficult keep or cut decisions at every position group to give you a transparent look at my decision making process and hopefully help you with theses specific cases for these specific players. I started with the corner infielders and middle infielders before the holidays and will wrap up with pitchers later this week.
–
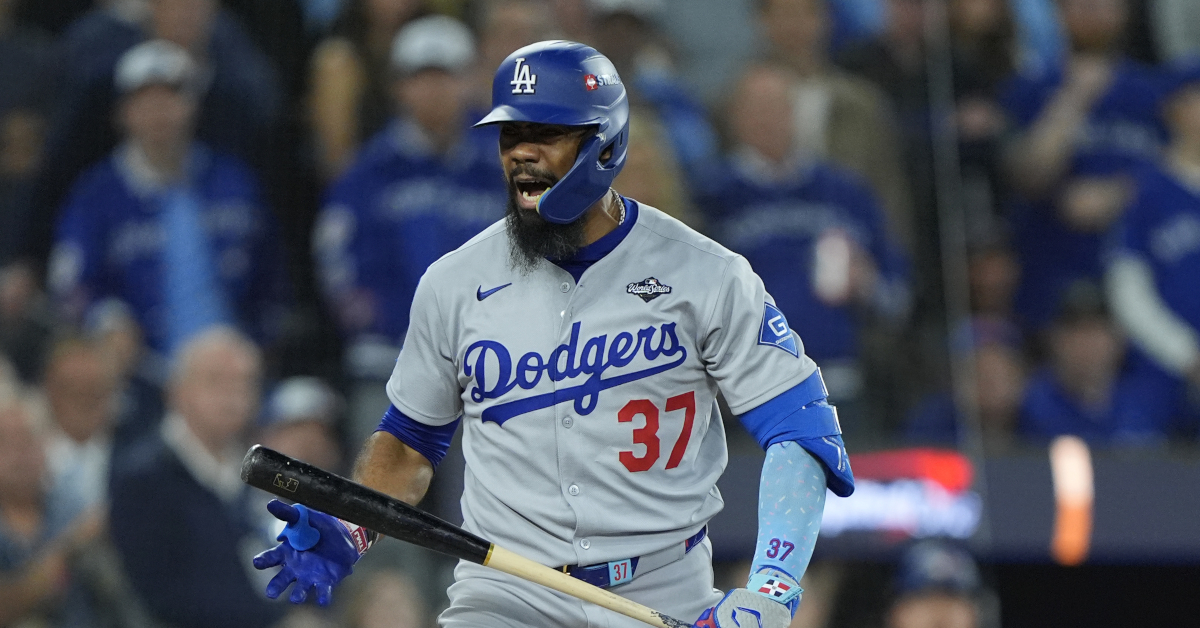
Teoscar Hernández, OF
Salary: $18, $19, $20
Average Salary: $21
2025 P/G: 4.55
Projected 2026 P/G: 5.04
A big bounce back season during his first year in Los Angeles had me hopeful that Teoscar Hernández’s down year in Seattle in 2023 was a one year blip. A year later, it kind of seems like the bounce back was the blip after Hernández posted a 102 wRC+ in ‘25, slightly worse than the 107 he posted with the Mariners a few years ago. Entering his age-33 season this year, which Hernández should we expect to see in 2026?
Let’s get the good news out of the way first: Hernández’s contact quality looked pretty good despite the underwhelming results. His hard hit rate was still well above average, and even though his barrel rate fell by more than three points, it was still barely outside the top quartile among qualified batters. That drop in barrel rate might have had an outsized effect on his bottom line results however. His expected wOBA on contact fell from .457 in 2024 to .403 in ‘25 despite no significant change to his batted ball mix. He wasn’t pounding the ball into the ground more often, he was simply less productive on the contact he was making. His average bat speed was down a little, but not dramatically which does provide some hope that he can rediscover his knack for barrelling up pitches.
The other concerning trend last year was a walk rate that fell to the lowest it’s been in his career. Hernández has never really been a patient hitter, but his walk rate usually fell right around league average when he was a middle-of-the-order run producer in Toronto. In 2025, it dropped to 4.8%. There were no dramatic changes to his underlying plate discipline metrics which makes his walk rate even more of a mystery. His swing rate in three-ball counts was 72.7%, much higher than his norm and the second highest three-ball swing rate in baseball. That tells me he was trying to swing his way out of his struggles rather than maintaining his measured aggression that served him so well in the past.
Steamer is essentially splitting the difference between Hernández’s down seasons in 2023 and ‘25 and the rest of his productive history. That’s probably a pretty reasonable expectation — he’s getting to the age where power output starts to slide and he doesn’t have the kind of approach that would allow him to thrive once his bat speed falls off a cliff. I think he’s probably got one or two more productive seasons left in his bat and there’s always the possibility he bounces all the way back to his ‘24 level.
Keep or cut?
I think I’m cutting all three of my shares of Hernández. His projection isn’t terrible but two out of the last three years have been extremely disappointing. I’m just not comfortable paying that much salary to see if he can figure things out in 2026 as he enters the decline phase of his career.
–
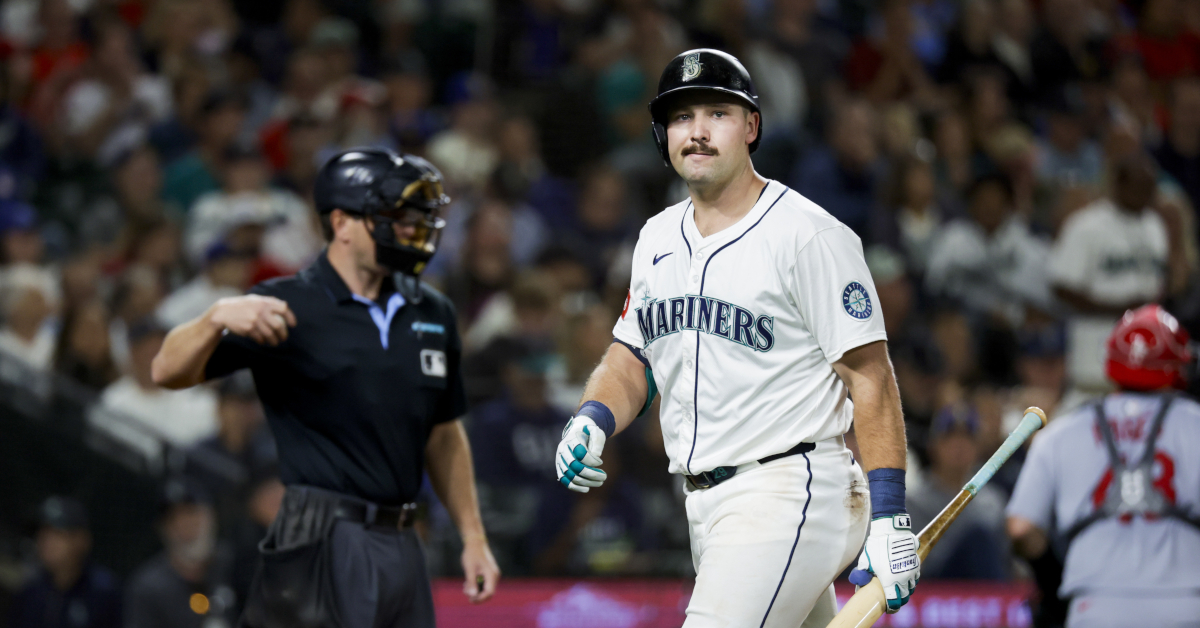
Kerry Carpenter, OF
Salary: $15
Average Salary: $10
2025 P/G: 4.44
Projected 2026 P/G: 5.37
How do you evaluate a part-time player who absolutely scorches the ball as the strong side of a platoon but useless when facing same-handed pitching. And what if that part-time player was coming off a down season where many of his offensive metrics took significant steps backwards. That’s the dilemma posed by Kerry Carpenter.
Because he’s the strong side of a platoon, Carpenter’s fantasy performance needs all sorts of context to fully understand. He’s primarily used against right-handed pitching and often pinch hits late in games if he isn’t starting. Those extra appearances off the bench artificially depress his overall points per game, though we can use points per game started, or more simply, points per plate appearance, to cut through some of that noise. Here’s a look at the various lenses we can use to clear up our evaluation of his production:
| Year | Overall P/G | vR P/G | Starting P/G | Overall P/PA | vR P/PA | Starting P/PA |
|---|---|---|---|---|---|---|
| 2023 | 5.18 | 4.61 | 5.41 | 1.33 | 1.39 | 1.33 |
| 2024 | 5.43 | 5.61 | 6.07 | 1.60 | 1.78 | 1.59 |
| 2025 | 4.44 | 4.07 | 5.08 | 1.24 | 1.31 | 1.27 |
When looking at points earned in games he started, Carpenter wasn’t too far off his production from his breakout two years ago and he looks a lot better from a points per plate appearance stand point as well.
The source of his struggles in 2025 seem to stem from a 54 point drop in BABIP and a 3.5 drop in walk rate. All of his underlying batted ball and plate discipline metrics look in line with his established norms and he even posted a career-best 22.8% strikeout rate last year.
Keep or cut?
I’m having a hard time justifying keeping a platoon outfielder for $15, even if he absolutely crushes right-handed pitching. The highs of 2024 are probably a high-water mark for him and Steamer isn’t predicting a big step forward for him in 2026. $10 is a more reasonable value for a really good part-time player like Carpenter, but a $15 salary gets squeezed off the roster.
–
Trent Grisham, OF
Salary: $7, $5, $4
Average Salary: $5
2025 P/G: 5.35
Projected 2026 P/G: 5.19
After settling in as a defense-first center fielder in San Diego, Trent Grisham enjoyed a huge breakout in New York in 2025. He’s shown he’s capable of producing at the plate in the distant past — he posted a 110 wRC+ across his first two seasons in San Diego in 2020 and ‘21 — but hasn’t hit very well until last year. All of a sudden, he started mashing the ball and wound up blasting a career-high 34 home runs in 2025.
Grisham has always had a patient approach at the plate and his batted ball quality significantly improved after joining the Yankees in 2024. The biggest difference was turning his sometimes overly patient approach into selective aggression on pitches in the zone early in the count. Ambushing pitchers when they tried to steal strikes worked wonders for Grisham and represents a real change in approach for him.
Surprisingly, Steamer believes in the changes Grisham made. It would have been easy to write off his breakout as a one-year blip, but the projections are calling for a solid follow-up season, though not necessarily up to the heights of his breakout.
Keep or cut?
I see the improvements in Grisham’s approach and batted ball quality and I’m willing to bet that they stick around in 2026. I’m keeping all three of my shares.