It’s always good to remind yourself of your league’s scoring system before you start a re-draft for the season. If you’re like me and you play in multiple fantasy baseball leagues with multiple scoring systems, things can get a little blended together. Here are some really important points to remember when comparing Ottoneu points and standard roto Read the rest of this entry »
2023’s PitcherList PitchCon was a great time. If you are unfamiliar with the event I highly recommend going back and watching any of the videos from any one of the four day’s recordings. FanGraphs’ own Ariel Cohen presented a few aspects of his ATC projections that I had never been aware of and think could be very useful in draft preparation. I encourage you to go back and watch Cohen’s talk on The Value of ATC Volatility Charts. In this post, I’ll take a look ATC’s InterSD, InterSK, and IntraSD metrics. Join me by opening a new tab, clicking on over to the ATC projections page, shuffling to the “Fantasy” tab and noticing three columns all the way to the right of the spreadsheet.
It is always odd to me how fantasy drafters come up with their auction values. “Oh, he’s a $10 SS at least!”. Ok, but, where did you come up with that number? If you load up the FanGraphs auction calculator with your league settings and Steamer projections, you will see exact dollar values that you can use to aid you in auction drafts. I write the word, “aid” because you will very rarely get the player you want for the price the auction calculator spits out. Sometimes you are lucky and get the player for under what the auction calculator thinks he’s worth, and sometimes you push the “Outbid By $1” button a little too much.
Regardless of whether your bid falls below the mark, above it, or right on the mark, the amount you paid cannot be evaluated until the end of the season. But, looking back at last season’s projections versus last season’s actuals can teach us a few things and if we were operating our fantasy team like we were operating a business, we’d all be sitting in the conference room drinking bad coffee and going over the fiscal year. Hopefully, someone brought in donut holes. In this post, I’ll look at 2022 steamer preseason projection values (hitters only) versus 2022 end-of-season values and make comparisons.
How would you define Jeff McNeil as a hitter in just a few words? If you had to place him in his own “group” of hitters, who else would you place him with? Last week, I used a cluster analysis to find a player that might compare to Luis Arraez and in turn, help provide some approach recommendations for increasing his power. This week, I’ll use that same cluster analysis, with just a few tweaks, to determine what combination of Statcast and plate discipline metrics increases roto value on average. Let’s start with a refresher on my process.
The 2022 American League batting title was won with .316. It was the lowest batting average to earn the award in the American League since Carl Yastrzemski hit .301 in 1968. Rod Carew earned the best AL batting average in 1972 with .318 and Tony Gwynn hit .313 in 1988 to earn the NL award. But typically, the batting title is awarded for a higher average. The average batting average of players winning the batting title in both the AL and NL over the past 50 seasons has been .345. Arraez’s .316 average was impressive, but it probably won’t benefit your fantasy team when quite enough when it brings only 8 home runs along with it.
Is there room for more power in Arraez’s approach? Don’t tinker with a good thing is what I immediately think, but then again, will .316 and probably slightly below (Arraez steamer 2022: avg .305), continue to top leaderboards? Furthermore, Arraez is up for arbitration prior to the 2023 season and won’t be a free agent until 2026. He has plenty of room to work for a few extra dollars in the power department. Shoot, he even said he wanted to add power himself when speaking with two of the most powerful in Giancarlo Stanton and Aaron Judge at the All-Star game (0:36):
So, what can he do? How can Luis Arraez add a little more power without changing who he is? I’m not a swing expert, but I did stay at a Holiday Inn last night and I know how to run a clustering model on high-dimensional data. But we’ll get to that in a minute.
Let’s start with who he is. First, he’s a man who does not strike out. He had the lowest K% at 7.1% among qualified hitters in 2022. He also never swings and misses. His 2.5% SwStr% was also the lowest among qualified hitters and lower than the new kid on the block Steven Kwan’s second place 3.1%. Second, he doesn’t steal bases. Four bags in 2022 and two bags in 2021 didn’t accentuate Arraez’s ability to get on base. Lastly, he doesn’t hit for power. His .104 ISO ranked 12th from the bottom among qualified hitters in 2022. From a fantasy perspective, Arraez is not necessarily a one-sided player, but he’s close. He got on base enough times to be driven in to score enough times and both his mR and mAVG returned positive value according to our auction calculator:
Luis Arraez, 2022 YTD Value
Name
PA
mAVG
mRBI
mR
mSB
mHR
PTS
aPOS
Dollars
Luis Arraez
603
$6.93
-$2.79
$3.07
-$1.53
-$3.61
$2.07
$9.51
$12.59
So where does this profile place him amongst his peers? Well, looking at a lot of columns in a spreadsheet can make it difficult to put a single label on a player. There’s just too much to sway your opinion. In order to combat this and help us create a more summarized view of many metrics, I’ll use a Principal Component Analysis (PCA) to “increas[e] the interpretability of data while preserving the maximum amount of information, and enabling the visualization of multidimensional data”. I created two sets of variables, one mostly batted ball, and plate discipline and the other Statcast metrics with a few non-Statcast metrics that more or less define power. Here they are:
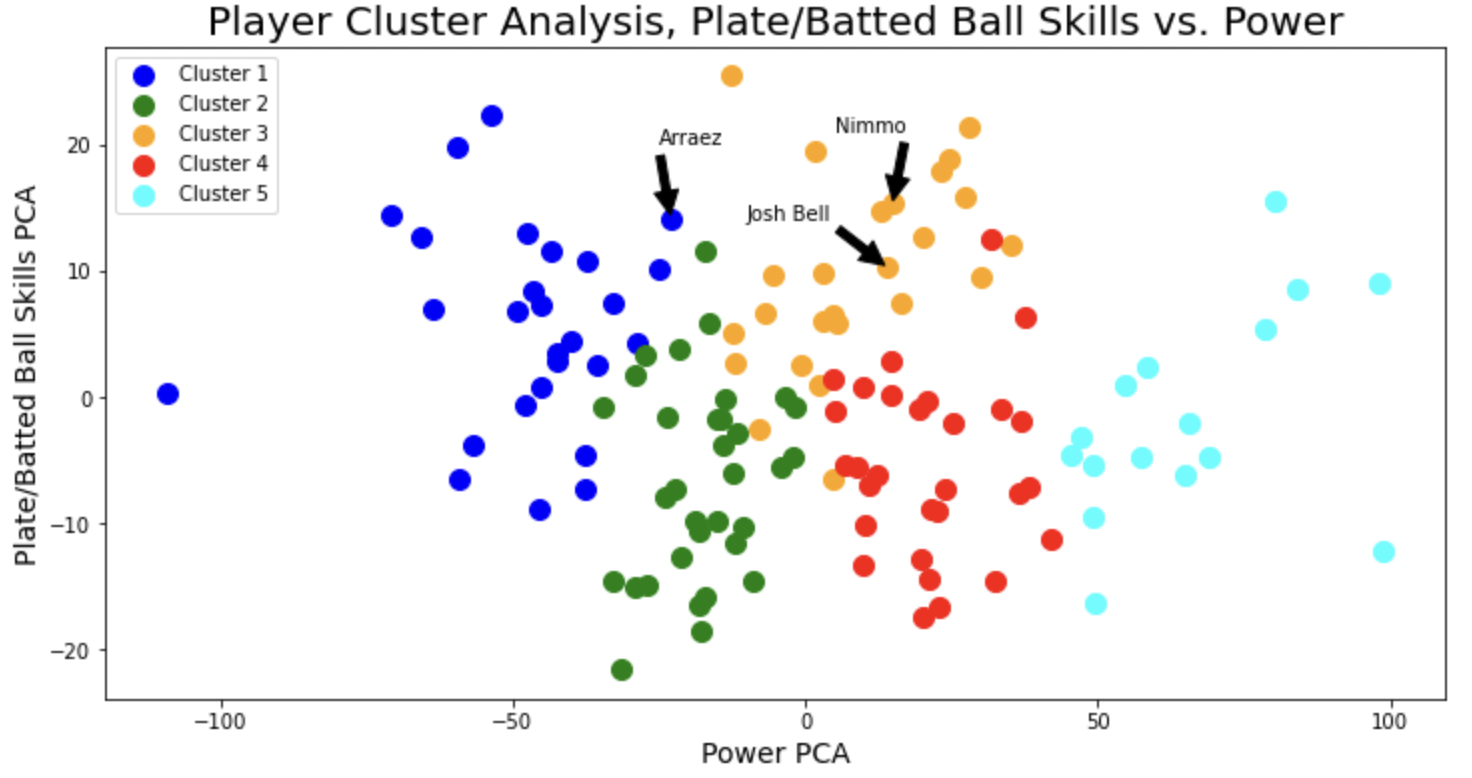
With a PCA I’m able to reduce these lists to two numbers which can then be passed through a k-means cluster analysis, grouping players into nice segments for visualization. Typically, a cluster analysis is used to gather insights on unlabeled data and it is a type of unsupervised learning. In this case, we’re using it to make comparisons we otherwise wouldn’t have:
Arraez finds himself, surprisingly, in the high-power end of cluster 1. To better understand why that is, we can compare his Statcast/power metrics with the averages from cluster 1. In addition, I’ll throw in that player all the way to the left, Tony Kemp, to help us compare Arraez with his cluster-mates:
Cluster 1 Metrics
Name
HR/FB
EV
maxEV
LA
Barrels
Barrel%
HardHit
SLG
xSLG
Tony Kemp
4.3
84.4
103.2
15.0
7
1.6
65
0.334
0.291
Luis Arraez
4.8
88.9
107.3
12.9
18
3.6
153
0.420
0.408
Cluster 1 Average
7.7
86.7
108.8
12.2
17
4.2
126
0.383
0.365
SOURCE: Statcast
Now we have a group for Arraez that makes sense. Next, let’s look at a few players who are higher up on the power scale, but aren’t changing too much in the batted ball/plate discipline area. Here’s our cluster image from before but with two new names identified that might be able to help Arraez inch over to the next cluster:
I am not saying that Luis Arraez should just go up there and try to be more like Josh. But I am using him as an example to determine what makes his profile more powerful. Josh Bell, 6′ 4″ / 255, and Luis Arraez, 5′ 10″ / 175, are different. While I don’t expect Luis Arraez to just suddenly increase his exit velocity, I am certain he has the skills to change his approach. One place to start would be adding more pull.
Shifting into Cluster 3
Name
LD%
GB%
FB%
Pull%
Cent%
Oppo%
Swing%
Contact%
SwStr%
Josh Bell
18.6
50.4
30.9
38.4
36.0
25.7
45.3
80.6
8.8
Brandon Nimmo
17.7
50.5
31.7
32.1
38.5
29.4
43.7
82.6
7.6
Luis Arraez
25.8
41.2
32.9
31.6
37.9
30.6
42.7
94.1
2.5
SOURCE: Statcast
Josh pulls the ball more. Josh also swings and misses more often. But while not swinging and missing is really impressive in this day and age, how valuable is it from both a fantasy perspective and a real-life perspective? Increasing his swinging-strike percentage while also increasing his slugging percentage would benefit everyone involved. Arraez is already hitting the ball with decent slugging results when it’s put inside, though he could improve on high-inside pitches, and all of his 2022 home runs came off pulled balls:
–
–
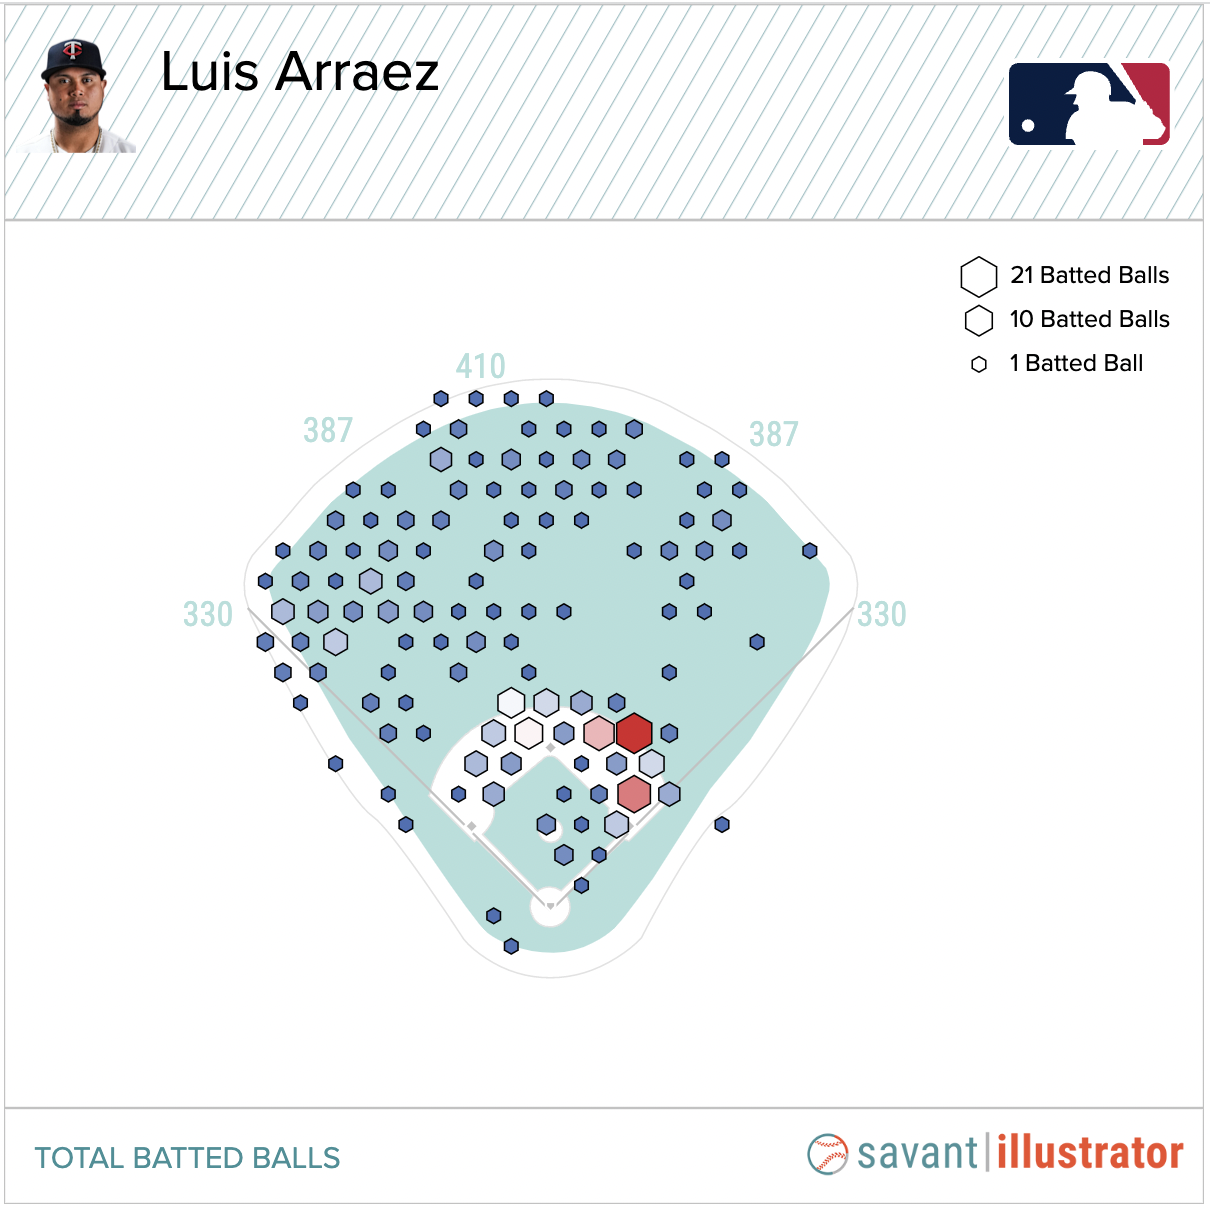
While watching a player who can spray the ball all over the field is fun, Arraez’s numbers aren’t great when going oppo. He slugged .638 when pulling the ball but when he slapped the ball the other way in 2022, he had mediocre results and his slugging percentage was brought down to .364. Just look at how many outs he hit into the opposite direction:
In 2022, Arraez’s HardHit% increased from 27.8% to 30.6% when he pulled the ball. When he was ahead in the count and pulled the ball, it jumped to 32.5%. Given a little more freedom from the worry of striking out, he added more power. But, here’s where things get a little odd. Arraez put the ball in the air more often than Bell and Nimmo in 2022 and his average launch angle was higher as well. If we look at his baseball savant radial chart isolated to singles, doubles and home runs (he only hit one triple in 2022), he clearly knows how to elevate the ball to hit for power:
But, without the exit velocity to take the ball out, he ends up with a lot of fly ball outs. Looking at the table above, he’s putting the ball in the air more often than Nimmo and Bell but with a significantly lower HR/FB rate.
Let’s summarize. Luis Arraez could be more valuable if he hit with a little more power. One way he might add power is to start pulling the ball more and leveling out his swing ever-so-slightly. This may cause him to swing and miss more often, but he can afford it. Arraez earned nearly $13 in 2022 and we should expect that to increase if he can adjust. It may seem nuts, but Luis Arraez needs to start swinging and missing more often.
Here are two players who accumulated over 450 PAs in 2022 and a few stats to accompany them, choose one for your fantasy team:
Player A, DH
128 wRC+
18 HR
0 SB FanGraphs Auction Calculator YTD 2022 Value (Default settings): $1.5
Player B, DH
119 wRC+
16 HR
0 SB FanGraphs Auction Calculator YTD 2022 Value (Default settings): $9.6
Surely, you wouldn’t just choose player A without wanting to know more but if you had to choose, you absolutely had to, you would choose player A, right? You would do this because Player A’s wRC+ is higher and he hit more home runs. But now look at the rest of the roto stats each player accumulated in 2022:
Player A, DH
128 wRC+
18 HR
0 SB
.238 AVG
47 R
59 RBI FanGraphs Auction Calculator YTD 2022 Value (Default settings): $1.5
Player B, DH
119 wRC+
16 HR
0 SB
.274 AVG
76 R
62 RBI FanGraphs Auction Calculator YTD 2022 Value (Default settings): $9.6
With this new information, you would have to choose Player B. You would surrender two home runs for 29 more runs and three more RBI. But, is it fair to say those runs and RBI minus two home runs are worth $8? And why is Player A’s wRC+ 9 points better? Let’s start digging and then we’ll see if we can find our way back out.
—
wRC+ is by our definition, “the most comprehensive rate statistic used to measure hitting performance”, but it places heavy emphasis on runs. Here are the correlations between wRC+ and fantasy stats from the 2022 season (over 200 PAs):
wRC+ Correlations, 2022
wRC+
wOBA
0.99
OBP
0.87
Dollars
0.75
AVG
0.72
HR
0.69
RBI
0.67
R
0.66
PA
0.50
SB
0.13
Among hitters with over 200 PAs
Player A wOBA: .349
Player B wOBA: .343
Intuitively that makes sense. The statistic is called weighted runs created plus. But, it can be confusing if we consider our two examples above. Player A literally scored less runs himself and drove in less runs than Player B, yet he has a larger wRC+.
Let’s do some nitty-gritty mathematics and calculate each players wRC+ manually to see if we can surmise what’s going on:
wRC+ = (((wRAA/PA + League R/PA) + (League R/PA – Park Factor* League R/PA))/ (AL or NL wRC/PA excluding pitchers))*100
Player A wRC+ = (((14.4/461 + .114) + (.114 – .975 * .114))/ (10,600/91,118))*100 = ~128
*Played in the NL
Player B wRC+ = (((15.7/596+ .114) + (.114 – 1.06 * .114))/ (10,227/90,850))*100 = ~119
*Played in the AL
Even if we changed this calculation and placed player A in Player B’s league, creating the same denominator for both players, Player A would actually increase in wRC+. No, the issue is not league-specific or even park-specific, it is in the plate appearances. Player A was simply more productive in wRAA because he didn’t get enough plate appearances to maybe go through a few additional slumps. So, Player A has a better wRC+ because he was more productive with the plate appearances he was given, even though Player B was able to accumulate more statistics. That’s really the essence of what’s going on here. Player B accumulated more raw stats for your fantasy team than did Player A.
But, does it mean that if a player finished the season with an above average (over 100) wRC+ they have returned positive value? Well, it depends on how much you’ve paid as the fantasy manager, but in general, no.
There can be plenty of situations, most plate appearance based, where a player may post above average wRC+, but does not bring positive value or is no better than a replacement-level player. Take, for example, Lars Nootbaar who posted a 125 wRC+ in 347 plate appearances with an 8.9 wRAA. That’s above average. But over the course of an entire season, there were plenty of other outfielders who would have been better for your fantasy team. If you had an injury and were able to replace that injured player with Nootbaar for those 347 plate appearances, swell! But, when compared to the player pool given by the auction calculator, Nootbaar’s 2022 season cost fantasy managers $0.50. On the flip-side of this argument is Jose Trevino. Though significantly hurt by his poor production (-4.7 wRAA/91 wRC+) he still generated $4 in value because of the large positional adjustment he receives for being a catcher. This just goes to show how important using the right statistic is when it applies to your fantasy team. Had you looked at Trevino’s wRC+ and thought, “Oh, he’s below average”, you would have missed out on a $4 catcher.
The main rule of thumb for when you find yourself down in a hole and looking to get out is to stop digging. Have we found something in the shovels full of dirt? Fantasy managers should not blindly use wRC+ as a metric for selecting fantasy value. Plate appearance accumulation is still king. But, if you’re the type to zig while everyone else zags, you may be able to use wRC+ to find fringe-level players who others have looked over. If you look at the 0 line in the scatter plot above, just above it are players who were worth $1. In addition, there are a number of players who returned negative value but were very productive at the season’s end. While wRC+ has become more and more common as a one stop shop type of offensive production metric, perhaps it is falsely molding your competitor’s impression of a player and therefore can be used to your advantage.
With drafts going and projections being released it is time to look at what they say about each other. This week I am going to look at what Steamer says about who is undervalued and overvalued at their current ADP. I took the FanGraphs Auction Calculator Values for Steamer and compared them to the current NFBC ADP to see which names jumped out at me within the top 50 starting pitchers according to Steamer’s projections. Read the rest of this entry »
With drafts going and projections being released it is time to look at what they say about each other. This week I am going to look at what Steamer says about who is undervalued and overvalued at their current ADP. I took the Fangraphs Auction Calculator Values for Steamer and compared them to the current NFBC ADP to see which names jumped out at me within the top 50 starting pitchers according to Steamer’s projections. Read the rest of this entry »
With drafts going and projections being released it is time to look at what they say about each other. This week I am going to look at what Steamer says about who is undervalued and overvalued at their current ADP. I took the FanGraphs Auction Calculator Values for Steamer and compared them to the current NFBC ADP to see which names jumped out at me within the top 100 projected hitters.
Francisco Lindor Steamer Projection: PAs 666 24 HR, 81 R, 86 RBI, 13 SBs, .250/.322/.430
Steamer “Fades” vs ADP: Top 100 Hitters
Player
Team
Position(s)
Auction Calculator Rank
Auction Calculator Dollars
NFBC ADP Rank
NFBC ADP
Difference
Francisco Lindor
NYM
SS
54
$17.30
24
32.39
30
Lindor finally looked like the vintage version of himself in 2022, putting up a top 10 fantasy season so I am a little surprised he made this list. There isn’t a ton in the profile that says he is going to take a step back as long as he is healthy and after playing 161 games in 2022, there isn’t much reason to believe he won’t be again. He could definitely regress a bit in the batting average department as he had an xAVG of .254, but batting average is fluky and I am not overthinking that too much. I think he is a pretty safe bet as a third round pick and if he drops in a draft, I’ll be snagging him most times.
Albies has the largest gap between his ADP and Auction value of any hitter in the top 100. This one is all about health. Albies only played in 64 games which was the second time in three seasons in which he missed a larger portion of the season. When healthy, Albies is a five category stud, but last year he was a massive bust for those of us taking him in the first or second round. I don’t want to dismiss the other concerns for Albies however. Albies was struggling before his initial injury, hitting .244/.289/.405 with eight home runs and three stolen bases and was dropping in the lineup. Lineup spot will be very important to his value as he loses a lot of value if he is not hitting in the top half. I tend to believe he will be hitting in the top five and should be healthy heading into 2023, so I am willing to take a gamble on a player I was willing to take as a first round pick last year that I can get in the fourth round like I did in my first draft of the year.
Trevor Story Steamer Projection: PAs 642, 23 HR, 77 R 82 RBI, 17 SBs, .238/.311/.425
Steamer “Fades” vs ADP: Top 100 Hitters
Player
Team
Position(s)
Auction Calculator Rank
Auction Calculator Dollars
NFBC ADP Rank
NFBC ADP
Difference
Trevor Story
BOS
2B
74
$15.10
41
66.83
33
Story is coming off of a disaster season in his first year in Boston where he played just 94 games and struggled massively when healthy. I can chalk up a lot to learning to hit outside of Coors, learning a new position, and injury. That being said, I think some of his ADP is still based on his name value which was boosted by his former home park. There are some concerns with the underlying skills. He had his highest strikeout rate, hostess o-swing, and lowest contact rate since 2017. He did still hit the ball with authority and was fantastic on the bases, not getting caught once. I think he is one of the hardest players to project due to his first season out of Coors being so injury riddled, but the stretch of 202 plate appearances between June 1 and ending his season on September 11 where he hit seven home runs and stole seven bases with a .254 average feels about right and when you project that over the 575 plate appearances that FanGraphs Depth Charts gives him, you get a 20/20 season with a .254 average and that would put him right around where steamer has him which confirms for me that he is probably being over-drafted.
Gunnar Henderson Steamer Projection: PAs 619, 22 HR, 76 R, 78 RBI, 10 SBs, .254/.344/.443
Steamer “Fades” vs ADP: Top 100 Hitters
Player
Team
Position(s)
Auction Calculator Rank
Auction Calculator Dollars
NFBC ADP Rank
NFBC ADP
Difference
Gunnar Henderson
BAL
3B
84
$14.10
58
97.94
26
Man, I want to love Henderson for this year, but I am afraid of the hype. He is already going in the top 100 and I just am having a hard time believing he is worth that. On the plus side, he should have an everyday role right off the bat and there is a ton of talent in the bat. On the negative side, Henderson had a two degree launch angle in the Majors and that led to a 60% ground ball rate and a 24.4% flyball percentage which was even worse than his high ground ball and low flyball rates we saw him post in AAA. He was also oddly passive at the plate, sporting a 41% swing percentage which led to a 18.6% called strike rate and below average z-contact rate. The power is there but he will have a hard time tapping into it right away unless there is a change in the approach and swing path. I think he is a fade for me this season especially as the price inevitably climbs due to his youth and upside.
Adolis was everyone’s favorite fade last year to the point that he became a huge bargain on draft day. However, I am still fading the underlying skills. He had the third worst zone contact rate, ninth worst o-swing, and fourth worst swinging strike rate of any qualified hitter in baseball last year. There is a ton of power and speed and his defense will keep him on the field through cold stretches, so even when the awful plate skills catch up with him, he can still have value especially if you have strong batting average players offsetting what could be a huge anchor. Right now, I can’t pay the price, but as more and more people write and talk about the bad underlying numbers, he could end up being another good value once again.
Tyler O’Neill Steamer Projection: PAs 559, 26 HR, 68 R. 75 RBI, 14 SBs, .243/.315/.447
This is an interesting one for me. At first glance O’Neill’s line doesn’t look that bad. He made some really good changes to his approach and underlying skills. He became more patient and selective which led to a career best zone contact, walk rate and strikeout rate. I think a lot of it comes down to how many games he plays. Steamer projects 134 a year after he played only 96 due to injury and two years after playing 138. He is projected to be healthy this season and his defense should keep him on the field when healthy, but there are rumors he could be dealt to a different team. Where he ends up will determine a lot of his value. Staying in St. Louis is a bit of a double edged sword. It is a fantastic lineup which is good and bad as he has no chance at being one of the top four hitters, but you want players in good lineups. The Cardinals also have multiple prospects knocking on the door of the Majors and while they aren’t naturally outfielders, it seems likely that Jordan Walker will move to the outfield and Masyn Winn could push Tommy Edman to the outfield. If O’Neill gets traded, he likely bats higher in the lineup and is in a better park, but that could raise his price. Right now, I am not overly scared of the current price because of how bad the outfield position is, but his price is important to keep watching.
Bryant is coming off of a lost season in his first with the Rockies in which he only played 42 games. He was great in the games he played, hitting .306/.376/.475 with five home runs, though 26 of his 42 games were in Coors. One of the main issues is that he has struggled to stay healthy. Bryant has lost major parts of three of the last five seasons and has not played in 150 games since 2017. I think Bryant has been overrated for a few years now, but the fact he is in Coors now will continue that trend. I am fading him at the current price and do not expect his price to drop moving forward.