Behind in the Count and High Fastball Rates
I’ve started my 2020 draft prep (i.e. writing player previews) and thought I had all the information I needed. I was missing some useful pitcher information, a pitcher’s high fastball rate and how often they are behind in the count. The two measures aren’t publicly available, but they are useful to help see why a pitcher’s overall profile is off. I’m going to rehash each stat and go over some leaders and laggards.
Ahead and Behind in the Count
Being ahead or behind in the count means more than strikeouts and walks. In the original research article at BaseballHQ ($$), I found that pitchers who are consistently ahead in the count limit hard contact. The theory goes that if ahead in the count, all a pitcher’s pitches are can be thrown. If behind, the pitcher may only have one or two pitches he can throw over the plate for strikes and the batter can wait and crush them.
First, I found being ahead or behind is sticky from season to season (i.e. predictable). It has about the same year-to-year correlation as strikeouts and groundballs. The key threshold I found was being ahead 50% of the time more than being behind. On average, these pitchers post a lower than average home run rate and have an ERA lower than their FIP and xFIP. For those pitchers constantly behind, their production drop doesn’t warrant any action.
The ahead-and-behind rate isn’t the first, second, or third stat to examine, but helps to explain some pitchers consistently produce weak contact. Clayton Kershaw and Justin Verlander have been near the top of this leaderboard. Both have a career ERA about 0.3 lower than their ERA estimators. Here are the starters (min 800 pitches) from 2020 with the highest and lowest ahead/behind ratio (full list, 2018 to 2020, min 100 pitches).
| Name | Behind% | Even% | Ahead% | Ahead%/Behind% | Count |
|---|---|---|---|---|---|
| Clayton Kershaw | 19.6% | 45.4% | 35.0% | 1.79 | 888 |
| Kyle Hendricks | 20.3% | 45.6% | 34.1% | 1.68 | 1162 |
| Yu Darvish | 21.2% | 43.6% | 35.2% | 1.66 | 1153 |
| Brandon Woodruff | 22.8% | 42.1% | 35.1% | 1.54 | 1211 |
| Andrew Heaney | 22.2% | 44.1% | 33.7% | 1.52 | 1085 |
| Max Scherzer | 22.8% | 43.2% | 34.0% | 1.49 | 1213 |
| Marco Gonzales | 22.4% | 44.5% | 33.1% | 1.48 | 1057 |
| Ryan Yarbrough | 22.9% | 45.3% | 31.8% | 1.39 | 834 |
| Gerrit Cole | 24.0% | 42.9% | 33.1% | 1.38 | 1203 |
| Dinelson Lamet | 24.0% | 43.0% | 33.0% | 1.37 | 1046 |
| Tyler Anderson | 23.7% | 44.1% | 32.2% | 1.36 | 954 |
| Rick Porcello | 23.7% | 44.4% | 31.9% | 1.35 | 983 |
| Sean Manaea | 23.0% | 45.9% | 31.0% | 1.35 | 812 |
| Lucas Giolito | 23.6% | 44.7% | 31.7% | 1.35 | 1214 |
| Dustin May | 24.1% | 43.4% | 32.4% | 1.34 | 866 |
| Zach Eflin | 23.9% | 44.0% | 32.1% | 1.34 | 913 |
| German Marquez | 23.7% | 44.4% | 31.9% | 1.34 | 1226 |
| Kevin Gausman | 24.3% | 43.2% | 32.5% | 1.34 | 975 |
| Chris Paddack | 23.6% | 45.2% | 31.3% | 1.33 | 963 |
| Jacob deGrom | 25.4% | 41.4% | 33.2% | 1.31 | 1135 |
| Aaron Nola | 24.0% | 44.8% | 31.2% | 1.30 | 1148 |
| Kenta Maeda | 24.4% | 44.0% | 31.5% | 1.29 | 986 |
| Lance Lynn | 24.4% | 45.1% | 30.5% | 1.25 | 1408 |
| Jesus Luzardo | 29.47% | 44.04% | 26.49% | 0.90 | 940 |
| Sonny Gray | 29.86% | 43.60% | 26.55% | 0.89 | 968 |
| Taijuan Walker | 30.09% | 43.21% | 26.70% | 0.89 | 884 |
| Dylan Cease | 30.78% | 42.49% | 26.73% | 0.87 | 1085 |
| Kyle Freeland | 29.47% | 45.50% | 25.02% | 0.85 | 1123 |
| Erick Fedde | 29.76% | 45.76% | 24.47% | 0.82 | 850 |
| Corbin Burnes | 31.29% | 43.66% | 25.05% | 0.80 | 1010 |
| Zach Davies | 30.90% | 44.74% | 24.36% | 0.79 | 1055 |
| Griffin Canning | 31.50% | 43.83% | 24.66% | 0.78 | 965 |
| David Peterson | 33.50% | 40.39% | 26.11% | 0.78 | 812 |
| Jon Lester | 31.15% | 44.74% | 24.11% | 0.77 | 1008 |
| Dallas Keuchel | 31.15% | 44.90% | 23.96% | 0.77 | 960 |
| Spencer Turnbull | 30.84% | 45.48% | 23.68% | 0.77 | 963 |
| Kris Bubic | 32.30% | 43.67% | 24.03% | 0.74 | 932 |
| Robbie Ray | 33.08% | 42.48% | 24.44% | 0.74 | 1064 |
| Cristian Javier | 33.41% | 43.19% | 23.40% | 0.70 | 889 |
| Tanner Roark | 34.41% | 43.29% | 22.31% | 0.65 | 901 |
The top names don’t have many breakouts. These pitchers throw a ton of strikes and have great walk rates. The three names might seem out of place are Tyler Anderson, Zach Eflin, and Rick Porcello.
- Rick Porcello is a perfect example of why this metric needs to down on the list of evaluation criteria. He just can’t miss bats. His 6.4% SwStr% was the third lowest behind (min 50 IP) behind Erick Fedde and Mike Fiers.
- I targetted Anderson coming into 2020 based on him keeping up the 10 K/9 from playing with the Rockies. The strikeouts disappeared after he lost over 1 mph on his fastball. While he did post an ERA (4.37) under his xFIP (5.93), he was a disappointment.
- I’ve pointed to Eflin as a sleeper candidate and this rate just further increases his value for me. Eflin has historically posted good ahead-to-behind ratios. His 2020 .344 BABIP is an outlier and his ERA could end up in the low 3.00’s next season.
High fastballs
A pitcher’s four-seam fastball becomes harder to hit the higher it is on the strike zone. Here is my conclusion from the original article along with a reference chart.
A four-seamer’s swing-and-miss ability is all about location, location, location. The swinging strike rate can change by a factor of three-to-four times depending on the pitch’s vertical location in the strike zone. A 90 mph fastball at the top of the zone has a better swing-and-miss rate than a 98 mph bullet right down the middle (14% SwStr% vs 11% SwStr%).
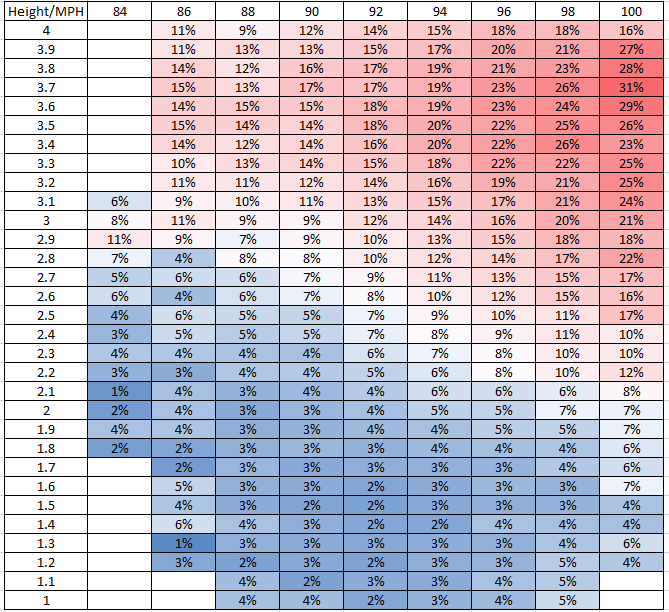
Basically, look here to see if a pitcher’s fastball is performing better or worse than expected. If a pitcher just changes the location of their fastballs, they’ll generate more swings-and-misses. A lot more. I did take into account that a lower fastball generates more groundballs and still found it’s best to live up in the zone with a four-seam fastball. With the background info out of the way, here are the leaders and laggards (full list, 2018 to 2020, min 50 four-seamers).
| Name | High FB Cnt | Overall Cnt | High% |
|---|---|---|---|
| Blake Snell | 78 | 397 | 19.6% |
| Freddy Peralta | 57 | 292 | 19.5% |
| Daniel Ponce de Leon | 64 | 335 | 19.1% |
| Johnny Cueto | 56 | 304 | 18.4% |
| Tyler Mahle | 66 | 367 | 18.0% |
| Jordan Lyles | 63 | 353 | 17.8% |
| Max Fried | 53 | 302 | 17.5% |
| Trevor Richards | 44 | 260 | 16.9% |
| Brent Suter | 55 | 330 | 16.7% |
| Matthew Boyd | 67 | 406 | 16.5% |
| Austin Voth | 36 | 444 | 8.1% |
| Taylor Clarke | 20 | 251 | 8.0% |
| Justin Dunn | 23 | 298 | 7.7% |
| Vince Velasquez | 21 | 276 | 7.6% |
| Jake McGee | 19 | 260 | 7.3% |
| Luke Weaver | 29 | 422 | 6.9% |
| Alex Cobb | 20 | 293 | 6.8% |
| Sean Manaea | 23 | 343 | 6.7% |
| Zack Greinke | 18 | 339 | 5.3% |
| Jack Flaherty | 14 | 277 | 5.1% |
The name who immediately sticks out is Jack Flaherty. His rate dropped from 11% in 2019 to 5% this season. His results were all a step back with his K% dropping (30% to 29%), walk rate up (7% to 9%) and he posted three-year highs in BABIP (.281) and homers (1.3 HR/9). He was just throwing his fastball right down the middle of the plate last year.
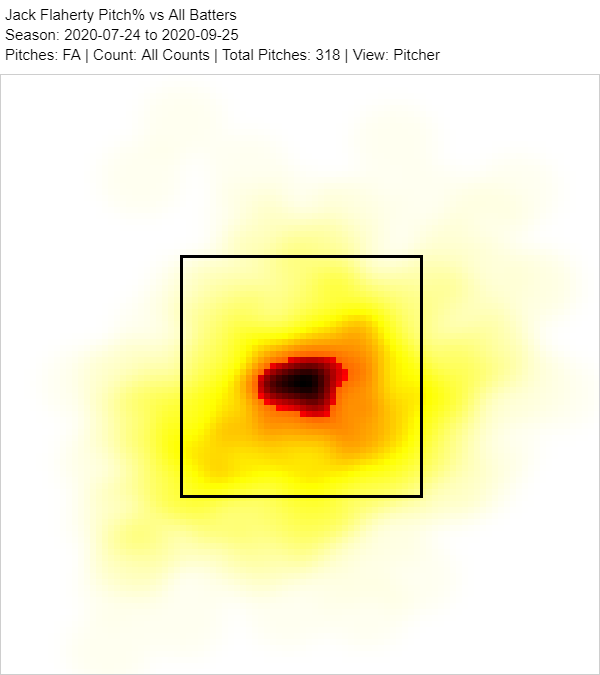
Hopefully, he can right the ship.
Max Fried is another interesting name. He’s known for his high groundball rate, but he does throw a 93 mph rising fastball 41% of the time. Since he keeps it high in the strike zone, it has a 10% swinging-strike rate. While the pitch doesn’t go against his groundball persona, it helps to get hitters out.
Jeff, one of the authors of the fantasy baseball guide,The Process, writes for RotoGraphs, The Hardball Times, Rotowire, Baseball America, and BaseballHQ. He has been nominated for two SABR Analytics Research Award for Contemporary Analysis and won it in 2013 in tandem with Bill Petti. He has won four FSWA Awards including on for his Mining the News series. He's won Tout Wars three times, LABR twice, and got his first NFBC Main Event win in 2021. Follow him on Twitter @jeffwzimmerman.