Author Archive

Highfalutin pVals

If you had to choose, right now, who will finish the 2022 season with the highest FB pVal, who would you choose? How would you make your choice? Maybe you would start by looking at last year’s top FB pVal finishers. Read the rest of this entry »


Projected Counting Stat Distributions by Position

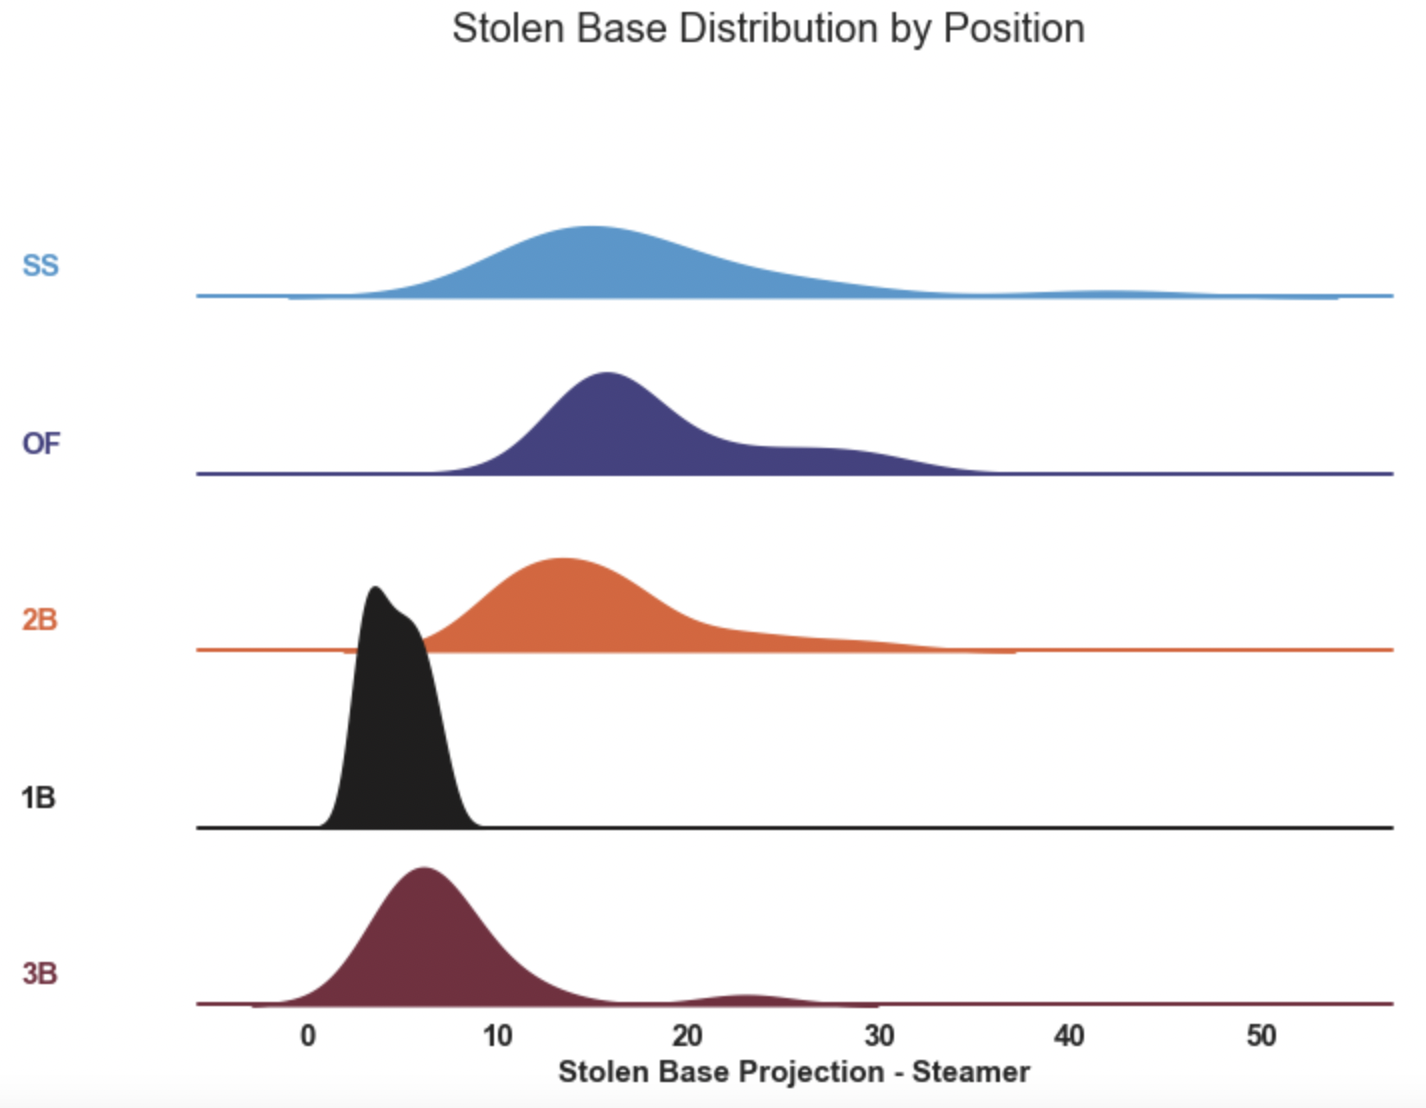
In last week’s post, I included a visualization that showed the distribution of projected counting stats by position so that fantasy managers can prepare for drafts. Here’s the example of stolen bases I presented last week:


Read the rest of this entry »


Using the Auction Calculator in 2022: A Beginner’s Guide

I’ll admit that the first time I looked at the auction calculator I was overwhelmed and confused. What do all those numbers mean? How come some of them have parentheses around them? What’s an aPOS? I use a snake draft in my league, not an auction. Why do I need dollar values? Well my friend, if you have asked yourself those questions I hope to answer some of them in this post and prove to you that our auction calculator is a very valuable tool whether you play in a 10-team ESPN home league or you’re an NFBC regular.

Read the rest of this entry »


Fun with Visualizations: Choose Your Shortstop

Let’s play a game. Here are the instructions:

Step 1: Don’t scroll down to the table!

That would be like reading the answers in the back of the textbook before you read the question. You did it in fifth grade, don’t do it now.

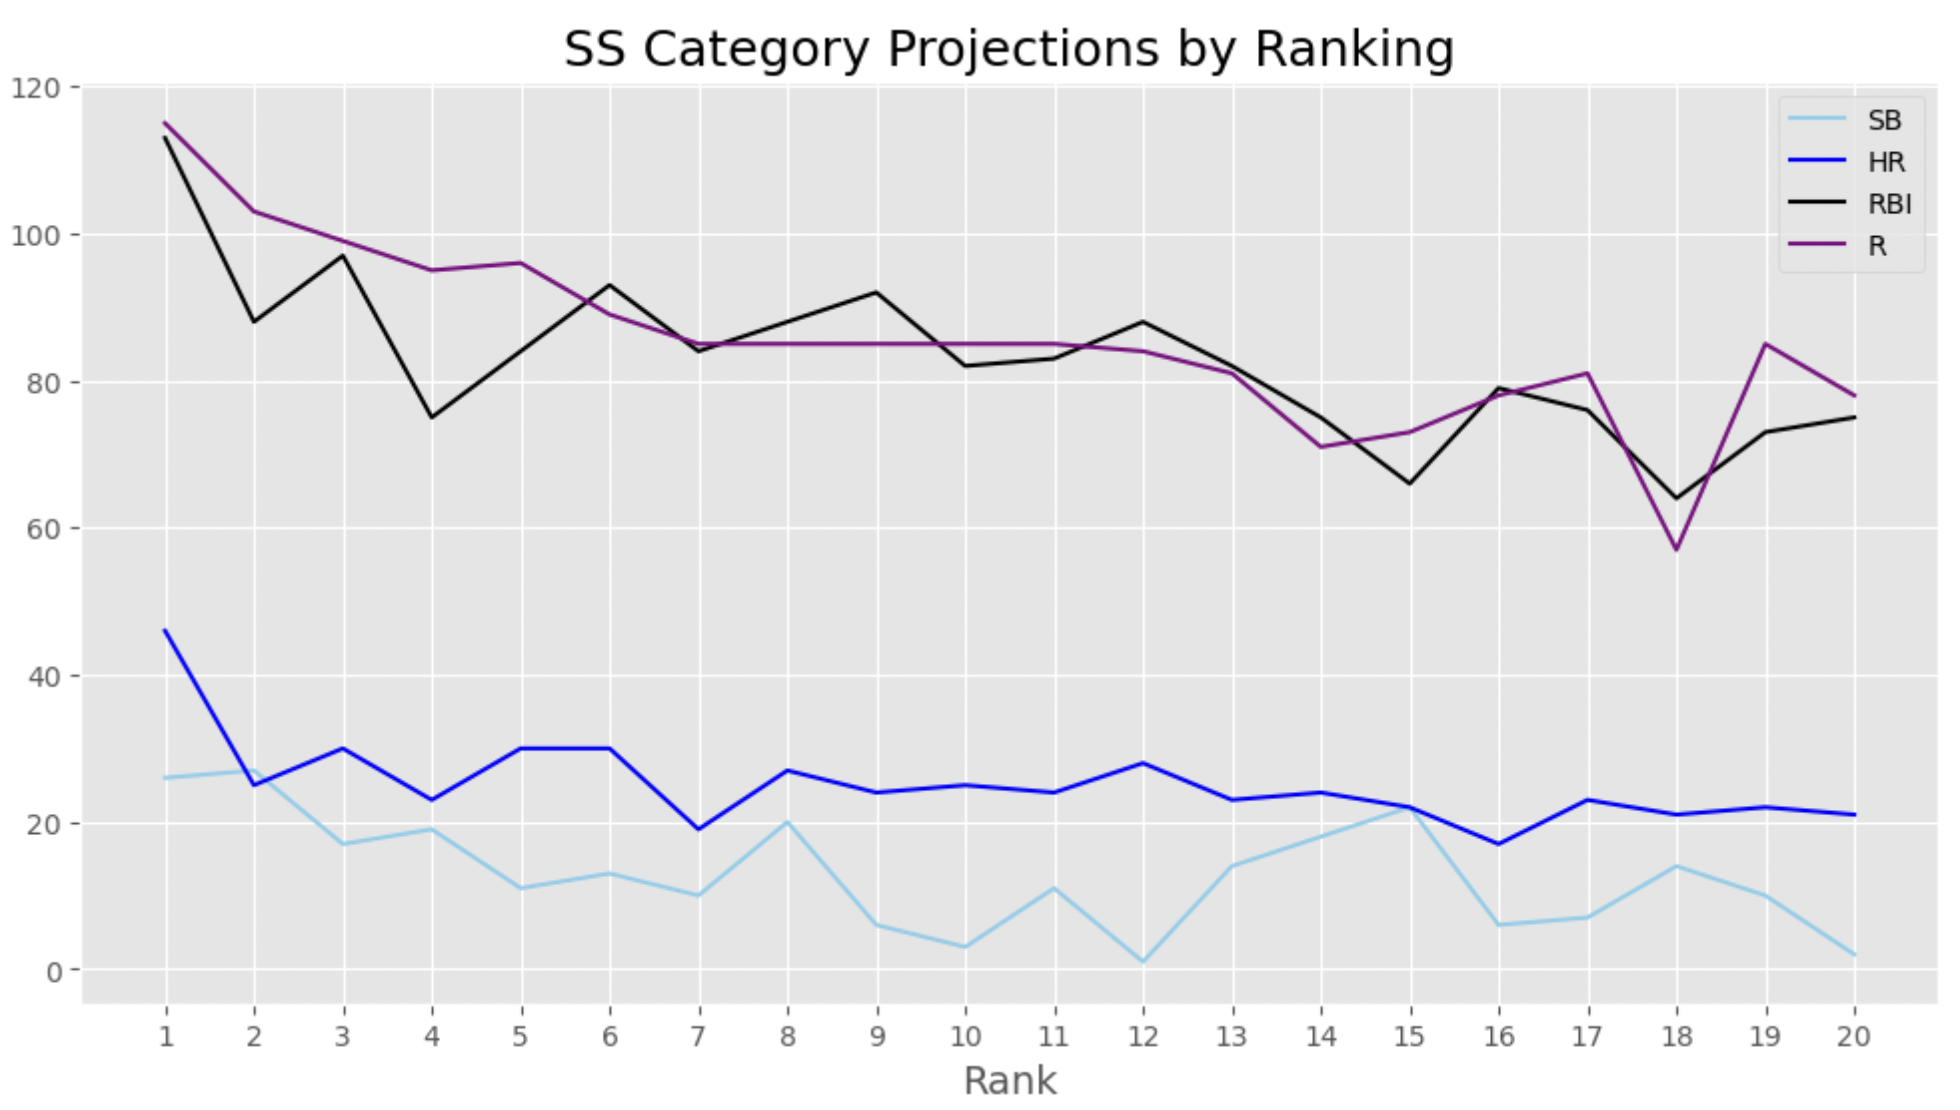
Step 2: Imagine drawing a vertical line in the visual below that does a good job of maximizing the four roto counting stats, SB, HR, RBI, and R. Try not to pick rank one, two, or three.

Step 3: Note your player rank. Now you can scroll down to the table to see who you have chosen.


I created these ranks using the default settings of the auction calculator with steamer projections to sort by dollar value. Note that if you wish to do something similar, you should input the parameters of your league accordingly. The point of this exercise is to try to identify players who could be good pickups later in the draft. We so often see tables and spreadsheets and mark single statistics. But, it’s difficult for the human eye to take in all that information and process it. This visual is helpful because it shows us not how single stats like stolen bases decline across the ranks, but how all the counting stats vary across the ranks. For example, if you chose rank 8, you would get a nice little bump in projected (steamer) stolen bases with close to average HR, R, and maybe a little more RBI than some of the lower ranks. Who is this mysterious rank eight? Scroll down to the table to find out.

You, like me, may think, “I can wait for stolen bases. Shortstops seem to have a lot of them.” This visual proves that theory somewhat:

That long tail moving to the right of the shortstop (light blue) distribution shows us that we could potentially pick up a decent amount of steals with a late shortstop pick. However, rank 15 in the first visual shows how much you would sacrifice in projected runs and RBI if you were to employ that strategy. Who is this mysterious rank 15? Scroll down to the table to find out.

I’ve done some mock drafting this offseason using the Fantasy Pros draft simulator and I’ve found that if I don’t get stolen bases early because there are so many good hitters and pitchers that I take instead, I come out very SB-lite. I’ve also noticed that the simulator reaches for base stealers like Tommy Edman, Jazz Chisholm Jr., Akil Baddoo, and Tim Anderson much earlier than I would expect. That’s likely to happen in my actual draft as well. There’s nothing worse than finishing a draft and being really excited about your team and then realizing that you are depleted in a single category, especially if you don’t want to employ a punt strategy. Hopefully, these visuals and a few mock drafts will help you identify optimal draft positions for certain categories. I’m happy to do this same exercise for another position, but only if you’re nice to me in the comments section.

Shortstop Ranks
Rank PlayerName POS ADP PA HR RBI R SB Dollars
1 Fernando Tatis Jr. SS/OF 1.8 677 46 113 115 26 $43.80
2 Trea Turner 2B/SS 2.0 681 25 88 103 27 $31.10
3 Bo Bichette SS 5.4 668 30 97 99 17 $29.70
4 Tim Anderson SS 34.9 692 23 75 95 19 $21.50
5 Marcus Semien 2B/SS 31.8 681 30 84 96 11 $17.10
6 Francisco Lindor SS 48.7 667 30 93 89 13 $16.90
7 Wander Franco SS 53.5 651 19 84 85 10 $16.20
8 Trevor Story SS 41.0 655 27 88 85 20 $16.10
9 Xander Bogaerts SS 42.8 649 24 92 85 6 $15.50
10 Corey Seager SS 72.1 596 25 82 85 3 $14.80
11 Jorge Polanco 2B/SS 79.3 654 24 83 85 11 $14.30
12 Carlos Correa SS 91.8 621 28 88 84 1 $14.20
13 Gleyber Torres SS 149.6 632 23 82 81 14 $14.10
14 Robert Witt SS 90.9 545 24 75 71 18 $12.80
15 Jazz Chisholm Jr. 2B/SS 79.2 568 22 66 73 22 $8.20
16 Jake Cronenworth 1B/2B/SS 111.9 644 17 79 78 6 $7.60
17 Willy Adames SS 133.8 628 23 76 81 7 $7.40
18 Oneil Cruz SS 224.2 457 21 64 57 14 $7.00
19 Dansby Swanson SS 123.1 665 22 73 85 10 $6.60
20 Brendan Rodgers 2B/SS 152.1 586 21 75 78 2 $5.00
*Values from auction calculator (default settings)

2022 Positive BABIP Regression Candidates

Last week I pointed to the great research done before me that shows that a player’s BABIP is likely to regress to their previous 3-year average. What’s the point of doing this before drafting? Well, it allows you to see players who may be over or undervalued. In the case of last week’s post, you can find players who may have gotten lucky and will likely do a little worse, hit-wise, in 2022. For example, last week’s analysis showed that Starling Marte, Brandon Crawford, and Kevin Kiermaier topped the list, in that order, of hitters who outperformed their 3-year (2017-2019) BABIP in 2021. Furthermore, I performed a cluster analysis that tried to explain just how these players overperformed. That allowed us to figure out if there was a skill change or not. Let’s do the same thing for players who underperformed in 2021.

Read the rest of this entry »


2022 Negative BABIP Regression Candidates

Work done by Voros McCracken has shown that a batter’s previous 3-year BABIP is a good predictor for next year’s BABIP, it is known. Here’s a quote from our own glossary:

..changes in BABIP are to be met with caution. If a batter has consistently produced a .310 BABIP and all of a sudden starts a season with a .370 BABIP, you can likely identify this as an instance in which the batter has been lucky unless there has been a significant change in their style of play.


Read the rest of this entry »


K% Gains: Trend, Outlier, Or To Be Expected?

Those who have been smart enough to pick up a copy of the 2021 Baseball HQ Forecaster (and likely posted a picture of it to their Twitter) have already read through the “Other Diamonds” portion of the text. It’s my favorite part. In it, there is a section called Paradoxes and Conundrums and it states that a player’s year to year improvements can be labeled as, “a point in a growth trend, an isolated outlier or a complete anomaly…” I loved that line when I read it. But, so much strange happened in 2020 and I think it should have some say. In this post, I’ll go over three pitchers who increased their K% from 2020 to 2021 but whose gains might be skewed by the 2020 season. Two of these pitchers really just rose back up to where they were in 2019. An increase in K% is wonderful but is it a trend, an outlier, or, to incorporate my own twist, to be expected?

Read the rest of this entry »


Creating Your Rankings? Start with Z-Scores

One of the greatest fantasy tutorials I’ve ever received came in Jeff Zimmerman and Tanner Bell’s, The Process. In the book, there is a breakdown of two very important valuation systems; standing gains points and z-scores. Our auction calculator, for example, is built around z-scores. For a further dive into both, I highly suggest purchasing a copy of the book. In general, z-scores help us understand how good player A is compared to the rest of the draftable player pool and it can be used as a great jumping-off point for your rankings. I use the word “rankings” because they are not projections and that’s the beauty in z-scores. You are not trying to outsmart projections. Instead, you are using a projection system of your choice to create your rankings. In this post, I’ll be creating z-scores for shortstops in 2022 using Steamer projections.

Read the rest of this entry »


Linear Modeling for BB%

The experiment from last week’s post on modeling for strikeout rate continues this week with a look at walk rate:

  1. I’ve limited to players with at least 120 PAs because it is a good point of stabilization for hitter BB%.
  2. I’m using 2017-2019 as a training set and then deploying my model on 2021 data to look for differences between model predictions and actuals.
  3. My model only tells us what should be expected from a hitter who accumulates at least 120 plate appearances in a season based on what other players have done in the same situation from 2017-2019. 2020 is excluded. The predictions of this model should not be confused with expectations.

Read the rest of this entry »


Linear Modeling for Hitter K%

Experiment alert! Prepare yourself to digest a very simple linear model that looks at plate discipline data. I’ll do some explaining of the model along the way, but here are a few points to cleanse your already superb palate before sampling the charcuterie:

  1. I’ve limited to players with at least 60 PAs because it is a good point of stabilization for hitter K%.
  2. I’m using 2017-2019 as a training set and then deploying my model on 2021 data to look for differences between model predictions and actuals.
  3. My model only tells us what should be expected from a hitter who accumulates at least 60 plate appearances in a season based on what other players have done in the same situation from 2017-2019. 2020 is excluded. The predictions of this model should not be confused with expectations.
  4. Hasn’t this been done before? Probably.

Read the rest of this entry »