Highfalutin pVals
If you had to choose, right now, who will finish the 2022 season with the highest FB pVal, who would you choose? How would you make your choice? Maybe you would start by looking at last year’s top FB pVal finishers. Here they are:
- Zack Wheeler, 26.0
- Walker Buehler, 22.9
- Brandon Woodruff, 22.7
But, maybe you would want to look at three-year totals?
- Walker Buehler, 56.8
- Gerrit Cole, 54.3
- Zack Wheeler, 47.0
Perhaps I’m being foolish, and you’d prefer a three-year (2019-2021) average?
- Gerrit Cole, 18.1
- Zack Wheeler, 15.7
- Max Scherzer, 12.5
These are all qualified pitchers. Pitch values (wFB, wCB, wSL, etc.,) generally accumulate with innings. That’s not to say that a pitcher with low IPs can’t compete. Change the threshold to a minimum of 40IP and you’ll see that Josh Hader, Liam Hendriks, and Andrew Chafin enter the top 20. Change that threshold to a steeper 100IP and you’ll see Ranger Suárez takes over second place with a 23.8 wFB. But still, no one caught Wheeler, who led the league in IPs in 2021.
If it’s me, the first thing I’m doing is looking at 2022’s projections of innings pitched. If we click on over to ATC projections we see that Zack Wheeler (198), Gerrit Cole (192), and Walker Buehler (191) are the top three starters when it comes to racking up innings. We could do some dirty math by multiplying projected IP by 15 to take a guess at how many pitches we can expect a pitcher to throw over the course of the season. To take this seriously back of napkin calculation even further, we could multiply that number by 2021’s FB% to consider how many fastballs the pitcher might throw if they were to repeat last year’s usage. Here’s what you would see on the back of that coffee-stained napkin:
| Name | IP | FB% | Pitches | Estimated Fastballs |
|---|---|---|---|---|
| Zack Wheeler | 198 | 62.2 | 2970 | 1847 |
| Framber Valdez | 173 | 70.8 | 2595 | 1837 |
| Walker Buehler | 191 | 60.0 | 2865 | 1719 |
| Brandon Woodruff | 179 | 63.2 | 2685 | 1697 |
| Frankie Montas | 178 | 63.0 | 2670 | 1682 |
| Kyle Hendricks | 180 | 57.8 | 2700 | 1561 |
| Lance Lynn | 180 | 55.9 | 2700 | 1509 |
| Antonio Senzatela | 164 | 61.0 | 2460 | 1501 |
| Sean Manaea | 169 | 58.7 | 2535 | 1488 |
| Patrick Corbin | 174 | 56.9 | 2610 | 1485 |
**Pitches uses 15 P/IP
Kyle Hendricks may be likely to throw a lot of fastballs in 2022, but his -8.6 wFB score in 2021 doesn’t make him a likely candidate to finish 2022 as king of the wFB. So if it’s not just about throwing lots of fastballs, what is it all about? Well, because a pitcher’s final wFB will be a total of the changes in run value created by the fastball, limiting hits is really good. If a pitcher throws three fastballs in a row for strikes, the run value for the hitter will go down, down, down and the wFB for the pitcher will go up, up up! But that doesn’t tell us how wFB totals apply to an entire season. We could also look at how end-of-season wFB correlates with other advanced end-of-season stats (100IP cutoff). Here’s a big, ugly correlation matrix for your squinting pleasure:
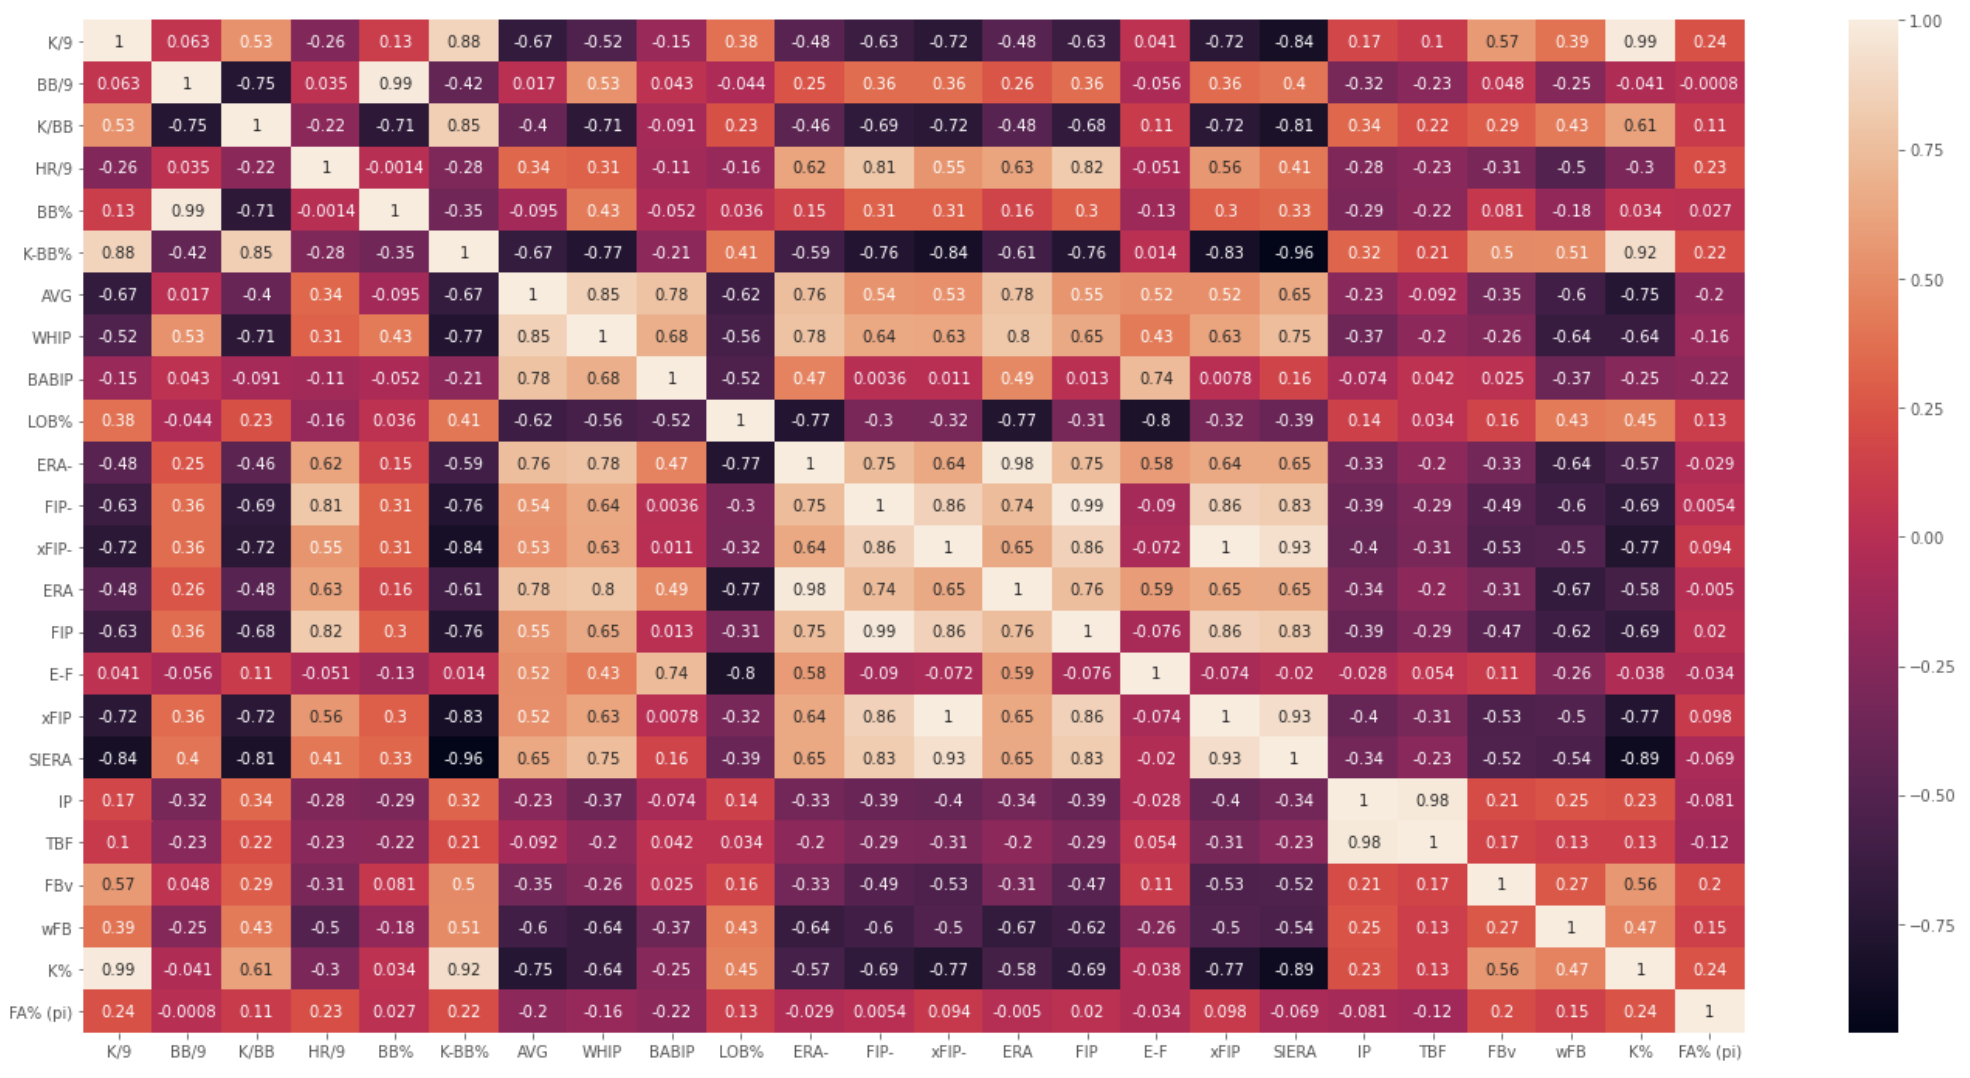
No, correlation is not causation, but it is cool to see that wFB has a somewhat sizeable negative correlation with WHIP and ERA. If you squint hard enough you can also see a decent relationship between wFB and K%, K-BB%, and K/BB…maybe. But if we go back to the original question of, “Who will finish 2022 with the highest wFB pVal?” then we may be able to use all of these things to our advantage. While I’m almost certain some of you are screaming, “Pitching linear weights are NOT predictive!”, we can still benefit from looking at what happened last year to inform our guess. Here’s a look at pitchers who finished qualified in both 2020 and 2021 (which limits the playing field significantly) and their wFB values in both seasons:
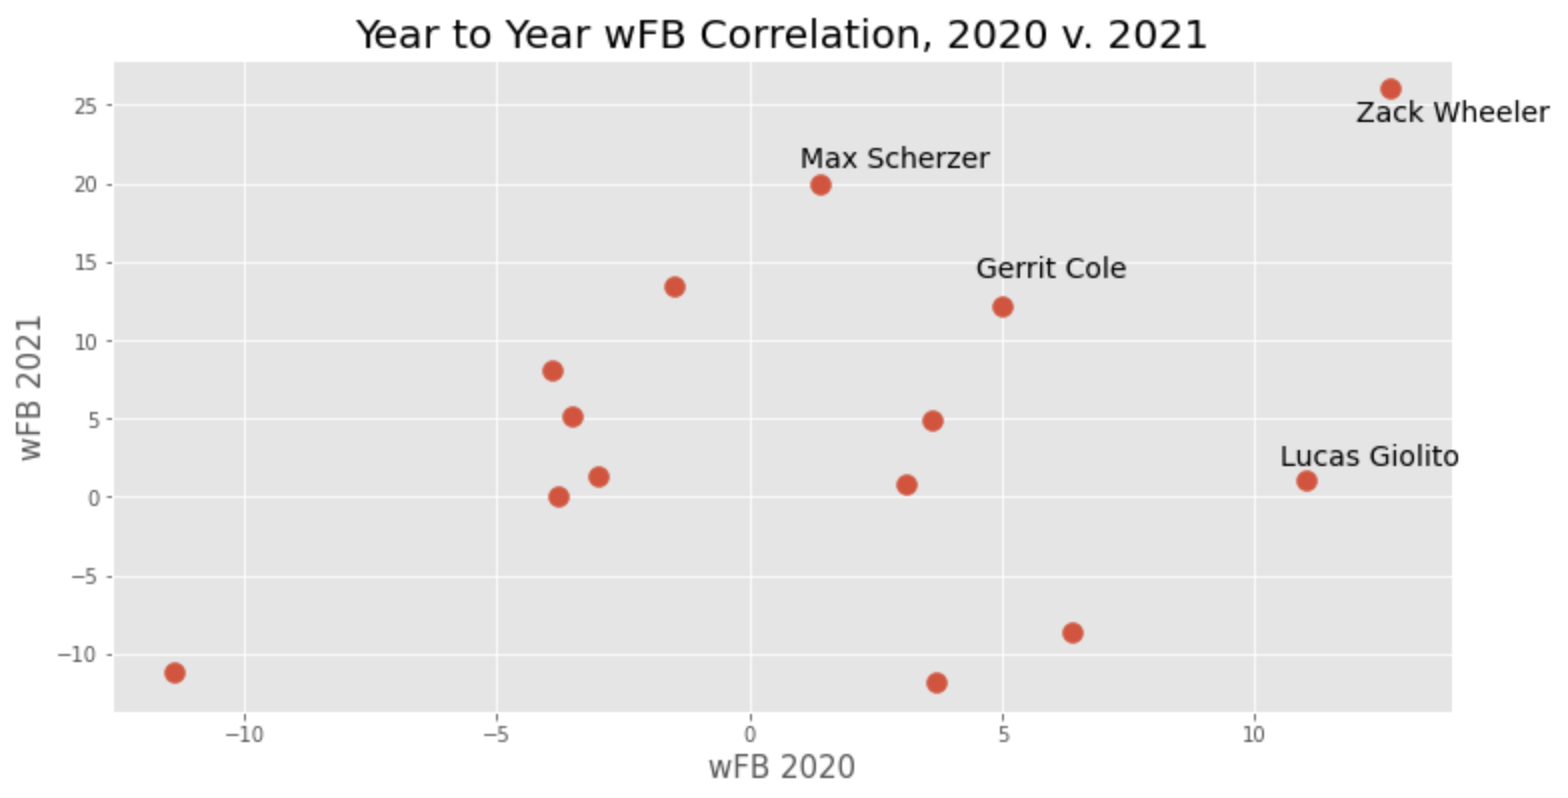
It’s not out of the realm of possibility that Zack Wheeler could repeat. He certainly throws the fastball a lot, throws the fastball well a lot, and has other metrics that correlated well with his wFB values. But, what happens if we open this up to all starters with no IP limit in 202o and 2021?
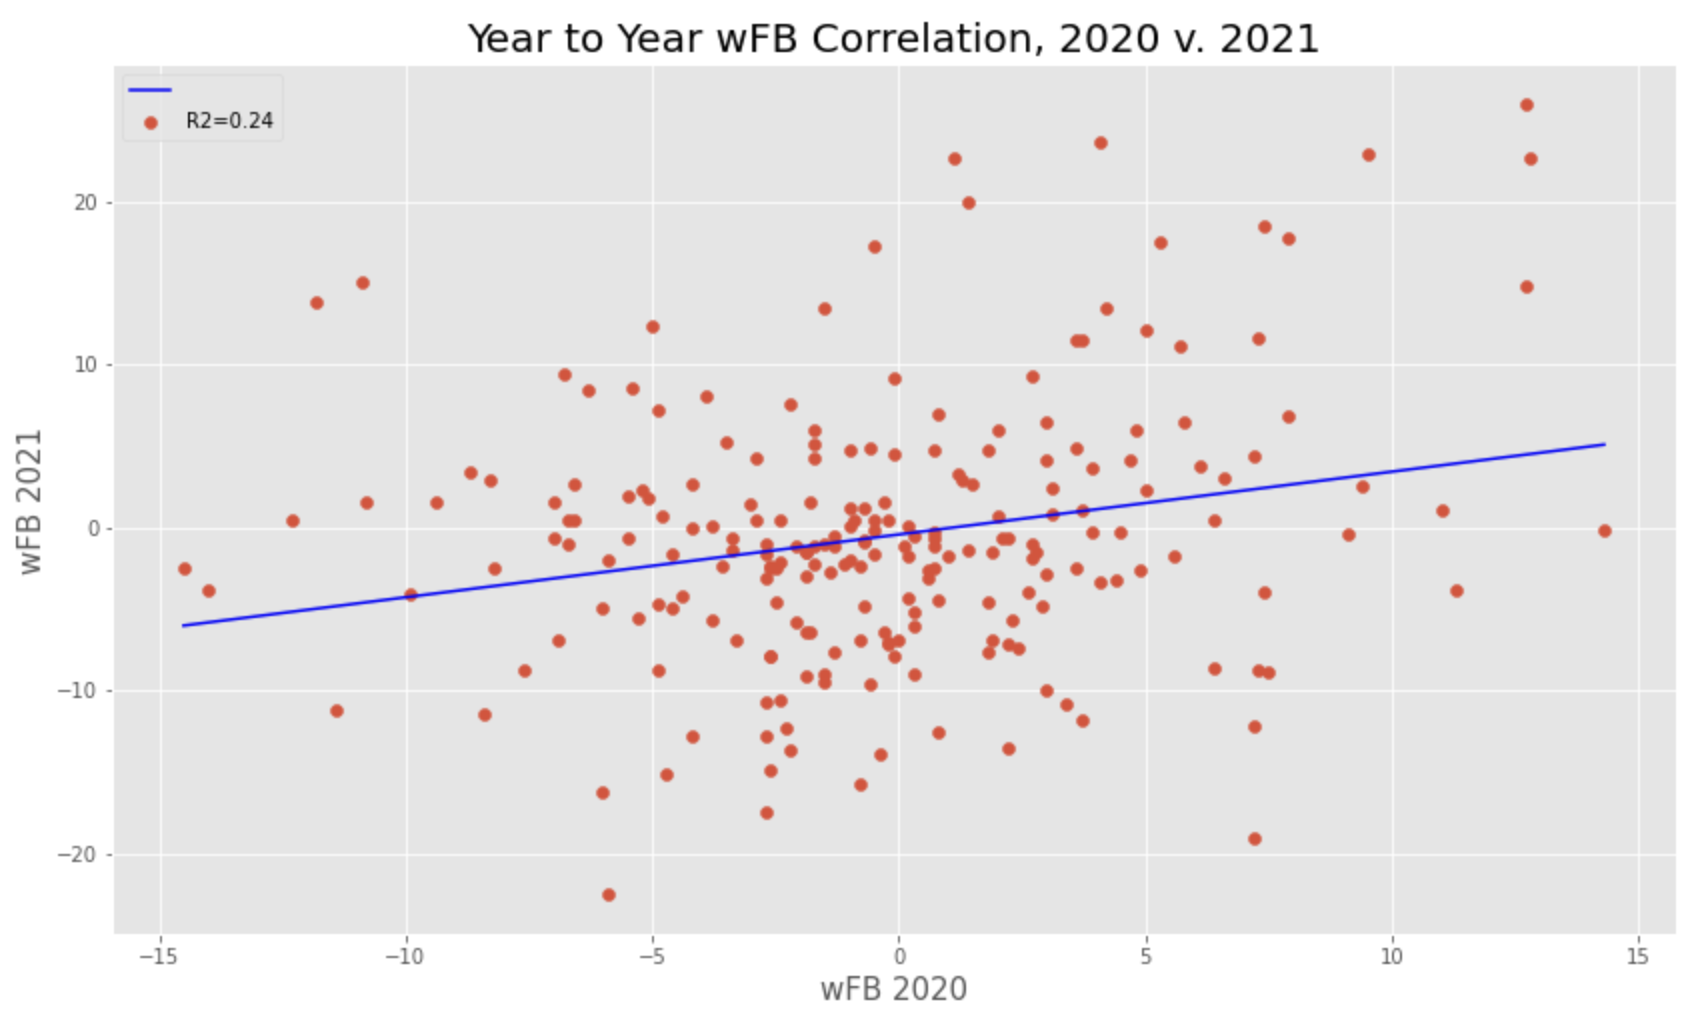
Not predictive you say? Ok, you’re right. It makes sense really, there’s just too much noise. Really good pitchers are likely to have really good fastballs in back-t0-back years. But, it’s hard to be a really good pitcher and all those random red dots in the scatter plot above are just trying so hard to inch their way into the top right corner. They may never make it.
Have we gotten closer to making a guess? I think so. While pVals are not predictive of what can happen in the future, looking at pitchers who posted good pVals is still helpful. There is a relationship between pVals and K/9, K-BB%, and pitchers who throw good fastballs. I’ve heard of ultra pitcher fans such as Nick Pollack and the Pitcher List team conducting pVal drafts and it’s something that I thought was really cool. Credit goes to PL. This year, I’d like to do the same. Zack Wheeler will be first on my short-list for wFB. But, what about wCB? wSL?! wCT?! The fun continues and in my next post, I’ll look into pitchers who finished 2021 with solid wFB pVals and solid secondary pVals. Do pitchers who have an above-average wFB and an above-average wSL end the season better off than pitchers with just a strong wFB? I have more questions than answers. In the meantime, head on over to our leaderboards and click around the pVal section and consider adding this dimension to your fantasy baseball habit. It seems like it could be a lot of fun.
The pVal draft we hold is incredibly fun. Here’s the draft board from the 2021 draft: https://docs.google.com/spreadsheets/d/1jBiWWM8zlHARAVxNXwv7N0A4Ie_Eicr9-IBAOJD2TNo/edit?usp=sharing
3x Fastballs (Sinkers (SI), Cutters (FC), Splitters (FS), Four-Seamers (FA) all allowed)
2x Sliders (SL)
1x Curveballs (CB)
1x Changeups (CH)
1x Secondary Pitches (Everything BUT FA or SI)
1x Pitch that held a negative pVAL in 2019 (if they didn’t pitch in 2019, then negative in 2018)
1x Pitch that you’re expecting negative regression (You get inverse points. Negative = positive. Previous year pitch must be a positive pVal)
2x UTIL (Any pitch)
2x Reserve spots (Any pitch, if they perform better than any other slot, you get that instead)
It’s an absolute blast.