2022 Positive BABIP Regression Candidates
Last week I pointed to the great research done before me that shows that a player’s BABIP is likely to regress to their previous 3-year average. What’s the point of doing this before drafting? Well, it allows you to see players who may be over or undervalued. In the case of last week’s post, you can find players who may have gotten lucky and will likely do a little worse, hit-wise, in 2022. For example, last week’s analysis showed that Starling Marte, Brandon Crawford, and Kevin Kiermaier topped the list, in that order, of hitters who outperformed their 3-year (2017-2019) BABIP in 2021. Furthermore, I performed a cluster analysis that tried to explain just how these players overperformed. That allowed us to figure out if there was a skill change or not. Let’s do the same thing for players who underperformed in 2021.
| Name | 3 Year BABIP | 1 Year BABIP | Diff |
|---|---|---|---|
| Cody Bellinger | 0.305 | 0.196 | 0.109 |
| Paul DeJong | 0.292 | 0.216 | 0.076 |
| Nolan Arenado | 0.315 | 0.249 | 0.066 |
| Jackie Bradley Jr. | 0.292 | 0.226 | 0.066 |
| Jose Altuve | 0.344 | 0.280 | 0.064 |
| Marwin Gonzalez | 0.318 | 0.258 | 0.060 |
| Tommy Pham | 0.339 | 0.280 | 0.059 |
| Trevor Story | 0.347 | 0.293 | 0.054 |
| Didi Gregorius | 0.265 | 0.217 | 0.048 |
| Austin Hedges | 0.257 | 0.214 | 0.043 |
| Jason Heyward | 0.287 | 0.247 | 0.040 |
| Charlie Blackmon | 0.345 | 0.305 | 0.040 |
| Carlos Santana | 0.266 | 0.227 | 0.039 |
| Yasmani Grandal | 0.284 | 0.246 | 0.038 |
| Joey Votto | 0.322 | 0.287 | 0.035 |
| Mookie Betts | 0.310 | 0.276 | 0.034 |
| Andrelton Simmons | 0.290 | 0.256 | 0.034 |
| Francisco Lindor | 0.281 | 0.248 | 0.033 |
| Freddy Galvis | 0.302 | 0.269 | 0.033 |
| DJ LeMahieu | 0.334 | 0.301 | 0.033 |
| Christian Yelich | 0.354 | 0.321 | 0.033 |
| Jorge Polanco | 0.314 | 0.282 | 0.032 |
| Anthony Rizzo | 0.288 | 0.258 | 0.030 |
1 Year BABIP – 21′
Just like .380 is unsustainably high, .230 is unsustainably low and a few of the players above hit that mark in 2021. Skills declines with age are certainly apparent in a few players (Blackmon, but maybe not?), while a few are three-true outcome types (Grandal), while others seem to still struggle with injury (Yelich). But mostly we see players that had a down year. There’s just no way LeMahieu, Bellinger, and Betts don’t rebound in my opinion and if people in your league are fading them, you should take advantage of that.
A player like Joey Votto, on the other hand, literally said he was going to change his approach and saw tremendous gains as a result. It’s pretty cool to see it happen in his stat line, but he’s not likely a bounce-back candidate when it comes to average or BABIP because of the nature of his change. The next table shows each player categorized and explained by their statcast “hp_to_1b” (measured in seconds and correlative with BABIP) and their batted ball profile (HardHit%, EV, LA, Barrel%) explained by one number by way of principal component analysis. I realized after writing last week’s article that I should have inverted this number, but for consistency’s sake, I kept it the same. Just keep in mind that a more negative number reflects a more attractive batted ball profile (see Votto).
| Name | Statcast HP_to_1B | HardHit% | EV | LA | Barrel% | Batted Ball PCA | Cluster |
|---|---|---|---|---|---|---|---|
| Yasmani Grandal | 5.08 | 53.2 | 93.1 | 14.2 | 13.3 | -15.9 | 4 |
| Joey Votto | 4.76 | 53.2 | 92.9 | 18.2 | 17.2 | -17.0 | 4 |
| Mookie Betts | 4.46 | 41.3 | 90.3 | 18.9 | 7.8 | -2.3 | 2 |
| Jose Altuve | 4.22 | 34.4 | 87.7 | 15.6 | 6.4 | 4.9 | 0 |
| Jorge Polanco | 4.23 | 36.8 | 89.4 | 19.3 | 10.1 | 1.2 | 0 |
| Trevor Story | 4.31 | 42.6 | 90.6 | 17.5 | 9.9 | -4.3 | 2 |
| Anthony Rizzo | 4.66 | 40.8 | 90.1 | 14.8 | 7.7 | -2.0 | 2 |
| Nolan Arenado | 4.77 | 37.1 | 89.0 | 20.0 | 6.7 | 2.2 | 0 |
| Charlie Blackmon | 4.33 | 38.3 | 87.6 | 10.2 | 7.0 | 0.9 | 0 |
| Christian Yelich | 4.35 | 48.4 | 91.0 | 2.8 | 7.6 | -9.6 | 1 |
| Tommy Pham | 4.54 | 46.7 | 90.8 | 7.6 | 10.0 | -8.6 | 1 |
| Francisco Lindor | 4.37 | 44.1 | 90.7 | 14.4 | 8.2 | -5.3 | 2 |
| DJ LeMahieu | 4.63 | 43.1 | 90.6 | 5.0 | 3.7 | -3.3 | 2 |
| Freddy Galvis | 4.54 | 31.6 | 86.8 | 14.1 | 4.9 | 8.1 | 0 |
| Carlos Santana | 4.7 | 41.9 | 89.9 | 12.9 | 6.8 | -2.7 | 2 |
| Paul DeJong | 4.5 | 35.3 | 86.3 | 16.4 | 10.6 | 3.0 | 0 |
| Didi Gregorius | 4.38 | 26.3 | 86.1 | 18.3 | 2.3 | 14.2 | 3 |
| Jason Heyward | 4.46 | 42.4 | 88.2 | 7.5 | 4.7 | -2.3 | 2 |
| Marwin Gonzalez | 4.5 | 34.5 | 87.9 | 8.9 | 4.5 | 5.1 | 0 |
| Andrelton Simmons | 4.68 | 21.5 | 84.1 | 3.9 | 0.6 | 18.9 | 3 |
| Cody Bellinger | 4.24 | 34.4 | 89.3 | 22.2 | 7.1 | 4.6 | 0 |
| Austin Hedges | 4.97 | 29.7 | 85.7 | 18.9 | 3.8 | 10.7 | 3 |
| Jackie Bradley Jr. | 4.42 | 40.3 | 89.7 | 9.6 | 5.0 | -0.7 | 2 |
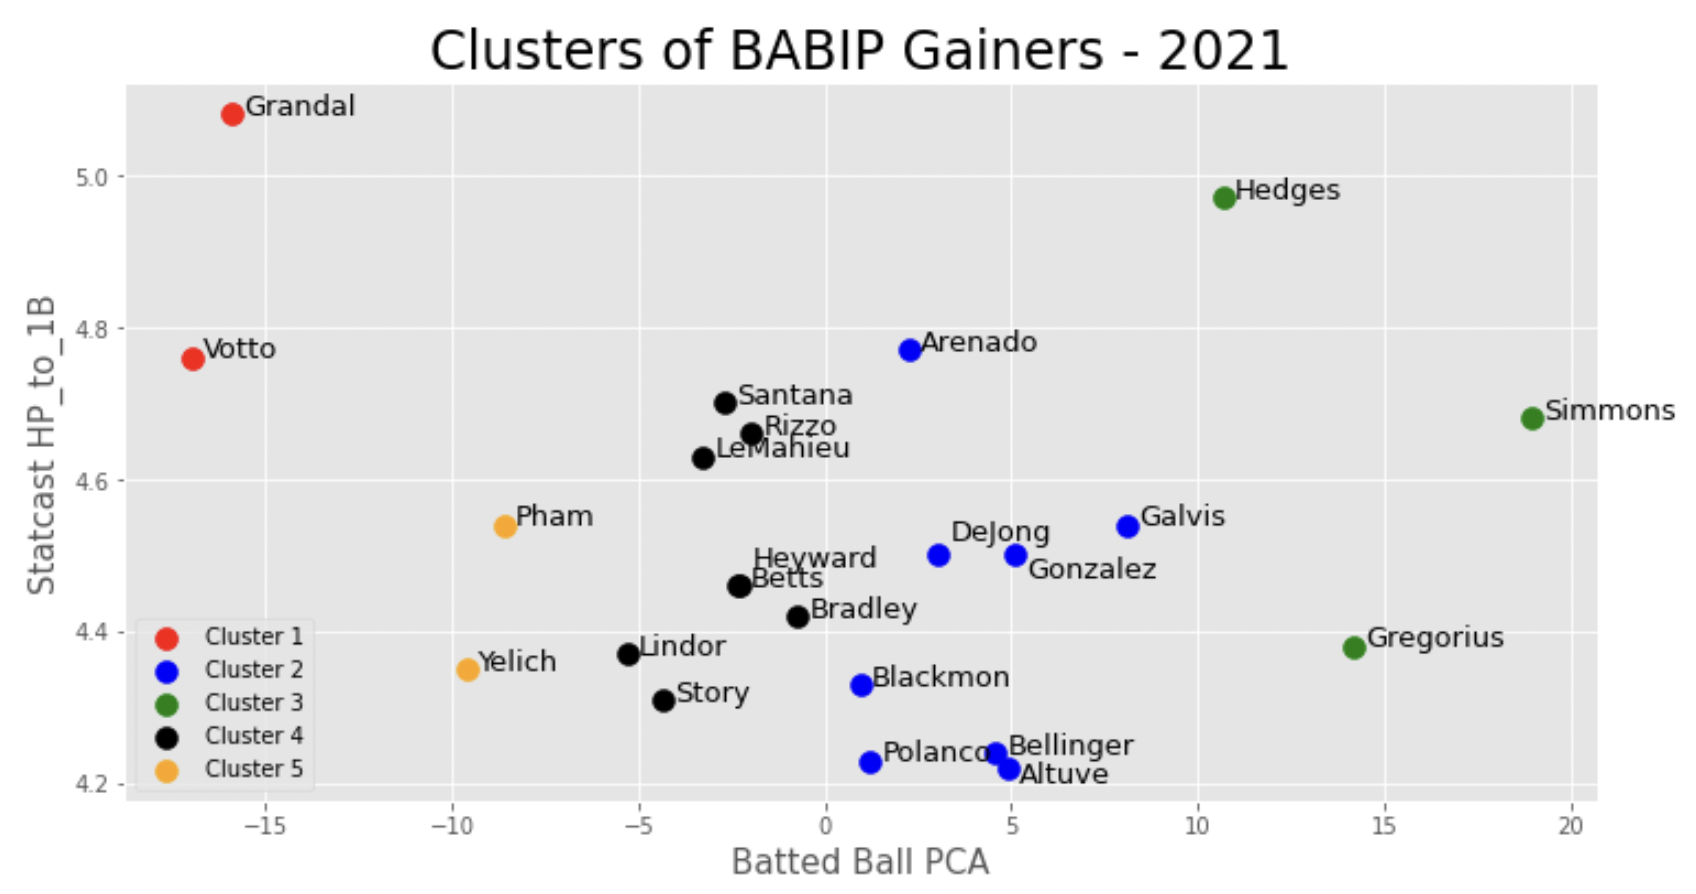
Grandal was such a standout in 2021 because he just decided to stop swinging at bad pitches. His O-Swing% went to a career-low 18.7% and the league average was 31.3% in 2021. His patience earned him a 23.2% BB%, a career-high. But when it comes to BABIP, he qualifies for cluster one (red) because he had excellent batted ball skills and very low speed. He and Joey Votto are two peas in a pod in that regard. Moving to cluster five (yellow) we see Pham and Yelich as two players who got on base because they coupled speed and batted ball skills. Cluster four (black) and cluster two (blue) seem to be the most interesting because these are the players who are harder to figure out. Take Charlie Blackmon for example. I think he’s being unfairly written off as a player declining with age. Yes, he’s getting older, but his EV, MaxEV, Barrel%, and HardHit% all increased from 2020 to 2021 and he still plays in Colorado. Jason Heyward’s line drive percent decreased by 14%, Paul DeJong by 12.5%, and Francisco Lindor and Mookie Betts by 11% from 2020 to 2021. Perhaps I should have included line drive percent in the batted ball PCA, but the inclusion of launch angle should pick up on some of that. Lastly, cluster three isn’t hard to figure out. Maybe you could point to injury, but I wouldn’t expect the gains to be too big from these players in 2022.
Breaking down and analyzing BABIP can be a challenge given its fickle nature. But, the 3-year skills regression gives you a pool of players to put your money on. The cluster analysis breaks down that pool even further and allows to you distribute that money in a more intelligent way. Whenever you start your offseason digging, positive and negative regression is a good place to start. Consider it one of the first shovels full of dirt on your way to the bedrock of your draft date.
Altuve’s come with an easy explanation: He’s taken his power to a primary skill, and has began to pull the ball in the air
Whats crazy is if you look at his 2019 hits versus 2021 hits on Savant. Very clearly selling out for pull power. https://baseballsavant.mlb.com/savant-player/jose-altuve-514888?stats=career-r-histograms-mlb
Exactly. Defenses will continue to increase their shift% against him continuing to depress his BABIP. He’ll also continue to slow down as he ages. If his current approach continues, I not only expect his BABIP to remain low but decrease.
Arenado’s BABIP drop can be tied to the home park change. His approach is extremely pull heavy in a pitcher’s park. He’s slow as well, so I don’t expect a large bump in BABIP. .265 seems about right. Betts’ BABIP drop is also park related but to a lesser extent. He pulls a lot of fly balls but also hits a few too many popups. Plus he dealt w/ an injury.
Altuve & Votto have new approaches which has suppressed their BABIP. Pulling fly balls at a higher frequency, selling out for power. Don’t expect a round from either unless they change their pull-heavy approach.
“Skills declines with age are certainly apparent in a few players (Blackmon, but maybe not?), while a few are three-true outcome types (Grandal), while others seem to still struggle with injury (Yelich).”
What’s the average age of this list? Sure seems to be above average.