
Fun with Visualizations: Choose Your First Baseman
While many expert fantasy players have been drafting and posting their rosters and drafting and posting their rosters and… you get the point…, you may be waiting out the lockout before you schedule your draft. If that’s the case, you’re probably exhausted from all the fantasy content that has been pumped out into the meta-verse and at this point, probably have your mind made up on a few players. Let’s put that theory to the test and let’s see if you can guess who’s who based on only their counting stat projections. This is my second installment of the choose your player game and here are the rules:
Step 1: Don’t scroll down to the table!
Step 2: Imagine drawing a vertical line in the visual below that does a good job of maximizing the four roto counting stats; SB, HR, RBI, and R. Try not to pick rank one, two, or three.
Step 3: Note your player rank, then scroll down to the table to see who you have chosen.
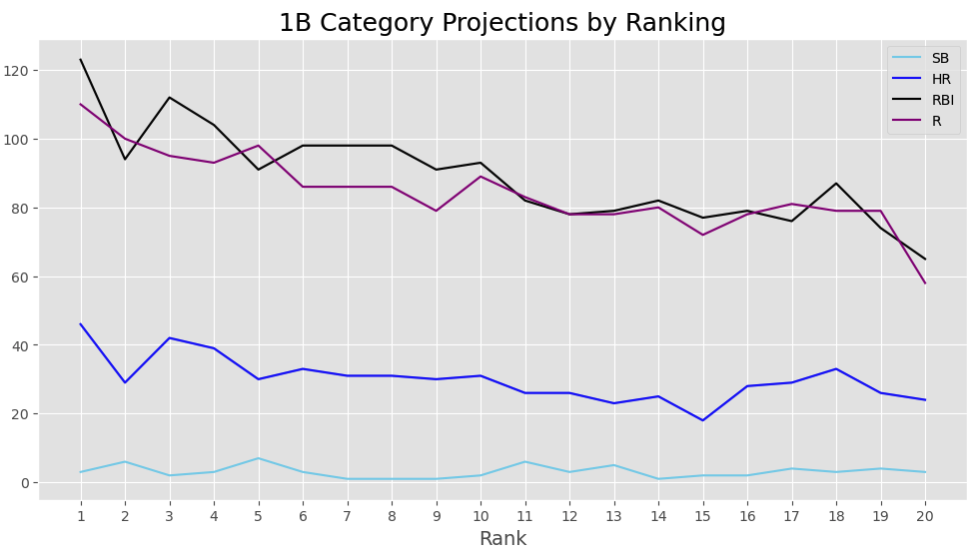
I created these ranks using the default settings of the auction calculator with steamer projections to sort by dollar value and limited the pool to players who were given a first base aPOS based on the default positional priority settings. Note that if you wish to do something similar, you should input the parameters of your league accordingly. The purpose of the visual above is to see that while a dollar value (based on z-score calculations) totals out all of a players’ category projections, you can still find some category by category bargains as you move down in overall value. A roster constructed accordingly could take advantage of this. It also allows you to strip away all that you have heard, about individual players and just focus on the projections. In this visual, player 18 is just that, player 18. If you didn’t cheat and scroll down, you don’t know who he is. When comparing his projections to the rest of the group, we see that his home run value is better than any player ranked greater than 11, his RBI projection is better than any player in the same group and his run projection is similar to the entire second half of rankings. Who is mystery player number 18? Scroll down to find out.
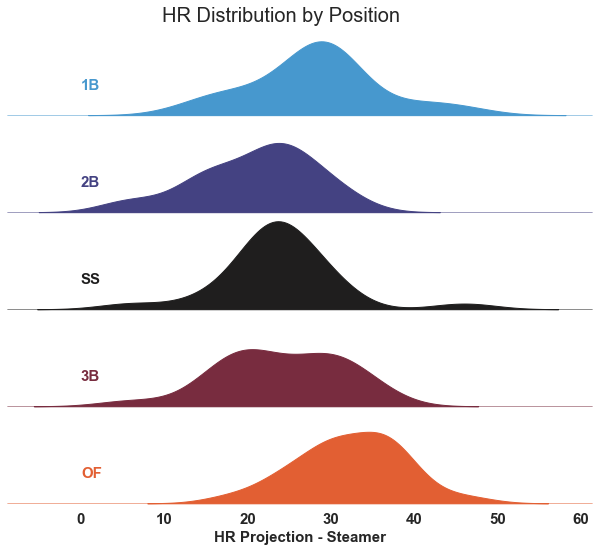
That long tail moving to the right of the first basemen (light blue) distribution in the image above shows us that there’s a larger selection of power in the 1B and OF positions than shortstop, second and third. Looking back up to the first image, you can see that players five through eleven are basically projected to hit the same amount of home runs. So, don’t think, “Oh no, first base is where I get power and I have to grab one now.” When looking at these visuals without the context of player name or team, we can see that you have many opportunities for power at the first base position and while there is a drop off after player rank 10, it trends upward again with players 16, 17, and 18.
Fantasy Pros draft simulator is a really nice place to practice drafting. Hopefully, these images will help you plan out your targets and find value while ignoring all the hype and bias that comes outside of just looking at projections.
| Rank | Name | POS | ADP | PA | Dollars | HR | RBI | R | SB |
|---|---|---|---|---|---|---|---|---|---|
| 1 | Vladimir Guerrero Jr. | 1B/DH | 5.4 | 656 | $38.45 | 46 | 123 | 110 | 3 |
| 2 | Freddie Freeman | 1B | 18.7 | 669 | $22.27 | 29 | 94 | 100 | 6 |
| 3 | Pete Alonso | 1B | 51.2 | 649 | $22.01 | 42 | 112 | 95 | 2 |
| 4 | Matt Olson | 1B | 40.3 | 656 | $19.10 | 39 | 104 | 93 | 3 |
| 5 | Paul Goldschmidt | 1B | 49.1 | 675 | $18.94 | 30 | 91 | 98 | 7 |
| 6 | Jared Walsh | 1B | 114.9 | 643 | $14.23 | 33 | 98 | 86 | 3 |
| 7 | Jose Abreu | 1B | 73.0 | 655 | $12.72 | 31 | 98 | 86 | 1 |
| 8 | Josh Bell | 1B | 127.6 | 633 | $12.63 | 31 | 98 | 86 | 1 |
| 9 | C.J. Cron | 1B | 124.1 | 574 | $11.24 | 30 | 91 | 79 | 1 |
| 10 | Joey Votto | 1B | 141.3 | 659 | $10.45 | 31 | 93 | 89 | 2 |
| 11 | Anthony Rizzo | 1B | 180.2 | 608 | $8.79 | 26 | 82 | 83 | 6 |
| 12 | Frank Schwindel | 1B | 233.8 | 576 | $7.79 | 26 | 78 | 78 | 3 |
| 13 | Nathaniel Lowe | 1B | 248.6 | 626 | $5.83 | 23 | 79 | 78 | 5 |
| 14 | Trey Mancini | 1B/DH | 189.5 | 657 | $5.41 | 25 | 82 | 80 | 1 |
| 15 | Yuli Gurriel | 1B | 194.3 | 589 | $5.02 | 18 | 77 | 72 | 2 |
| 16 | Luke Voit | 1B | 264.0 | 572 | $4.59 | 28 | 79 | 78 | 2 |
| 17 | Rhys Hoskins | 1B | 137.6 | 551 | $4.56 | 29 | 76 | 81 | 4 |
| 18 | Miguel Sano | 1B | 279.6 | 615 | $4.28 | 33 | 87 | 79 | 3 |
| 19 | Brandon Belt | 1B | 231.0 | 571 | $3.22 | 26 | 74 | 79 | 4 |
| 20 | Bobby Dalbec | 1B | 228.9 | 545 | $1.69 | 24 | 65 | 58 | 3 |
I’m taking Mike Trout if Mike Trout was a first baseman (also known as Tyler White)
I guess I’m confused as to why Hoskins would be the 17th ranked 1B with those projections? Doesn’t the calculator calculate its values directly from the projections? My first thought was maybe he’s getting a terrible AVG projection, but that’s not it, he’s projected in the .240 range (not ideal, but not crippling).
When I put my league parameters into the auction calculator, I got a $15 value for Hoskins, not $4.5. I understand that my league is different than the default settings, but 3x different? Something doesn’t seem right here to me, or I’m missing something obvious.
Im confused about that, and also the source for those projections. Going to Hoskins’ player page, his Steamer projections are much worse than that, with only 29 HR. Which still doesn’t explain the value discrepancy, although it’s possible that league settings are most of it.
I think these would be more useful with ADP rather than projected value on the x-axis though. Hoskins is the 10th 1B off the board, so that’s the price you pay for him. If you really think he’s number 17 at the position, he’s a guy to avoid, not a late-round opportunity for counting stats.
Yea, weird. It looks like the file I was using in my code was different than what I thought. I re-downloaded steamer projections and made the adjustment. That explains the projections being off.
See my comment below. My projections were slightly off. That explains part of it. The other part is that I isolated the player pool to players with an aPOS of $7.1, meaning only the first basemen who are only eligible at DH or 1B. That shoots Hoskins up in the rankings from 23 to 17 when you remove players like LeMahieu. You’re also correct about Hoskins’ AVG, he’s given -$3.9 in that category. I would guess the $15 valuation on Hoskins you’re getting has to do with your league settings. The default values him at $4.6. Are you using OBP? If that’s the case, his value shoots up even more, but still doesn’t reach $15.
I may just be stupid, but how are you converting m(stat) to actual projections for each category? For example, in my league Freddie Freeman has a mHR value of 2.6. How is the 2.6 converted into an actual HR projection? Thanks!
It works in the opposite. mHR values are calculated from projections. mHR is generated by taking a HR projection (in this case steamer) and comparing it to other players’ HR projections in the player pool. It is a z-score calculation. Check out this article for a rundown of how the auction calculator (and z-scores) works:
https://fantasy.fangraphs.com/using-the-auction-calculator-in-2022-a-beginners-guide/
For this article, I just merge the projections back in on the player name in a separate step to show how the actual projections in the table.
Thank you for this!