At the start of the new year, I was invited to participate in an Ottoneu mock draft with other industry people and I was excited to take on the challenge. We mocked a 12-team, FanGraphs points Ottoneu league. Each team had a $400 salary and a 40-man roster to fill. Chad Young tweeted his analysis of each pick and you can follow each piece of valuable insight here. But, he was being polite when he wrote:
The truth is, I didn’t really mean to do it, draft three top closers, that is. I won’t make excuses, but if I did make excuses I’d say that I’ve never actually participated in an Ottoneu first-year draft, both of my Ottoneu teams were inherited and that I had also never participated in slow draft before. I had a hard time keeping track of where I placed bids. Insert emoji of person with hands up in the air here. Yes, I made a rookie mistake and I am not a rookie, I swear. But, mock drafts are mock drafts and if you go into one without some kind of planned experiment, then what’s the point? My experiment? Come out with guns blazing! Pay top dollar for top dollar players. What ended up happening when it was all said and done? Let’s dig in a little and find out.

–
Hypothesis: Cornering the closer market will add value to my team.
The elite pen that Chad was intrigued by is projected by Steamer to be worth 1722.6 points. This draft took place prior to the unfortunate news that Liam Hendrick was diagnosed with Non-Hodgkin’s Lymphoma, so I used his 2022 points in this calculation. Here’s a pricing break-down:
The Elite Pen
| Name |
Team |
ADP |
IP |
rPTS |
PTS |
aPOS |
Projected 2023 |
Salary |
| Edwin Díaz |
NYM |
22 |
64 |
609.3 |
-16.9 |
45.4 |
$29.50 |
$23.00 |
| Emmanuel Clase |
CLE |
27 |
70 |
583.5 |
-20.2 |
45.4 |
$26.27 |
$25.00 |
| Liam Hendriks* |
CHW |
127 |
57.2 |
529.8 |
-16.8 |
26.9 |
$11.04 |
$19.00 |
*2022 Hendriks stats and value
**Projections use FanGraphs Auction calculator and Steamer
The crazy part about this is I technically got a discount on Diaz and Clase when assuming FanGraphs auction calculator values. But, what happens when you corner the market? You end up with a surplus of stats and while that’s valuable, it means that you valued it more than everyone else. If this were a real league, I’m sure it would be difficult to trade away one of these closers and get a return that I was happy with. Add to that the fact that Hendriks has more important things to fight through than the bottom of the ninth, and you can see that I’ve placed too many eggs in one basket. Larry Schechter wrote about this exact issue in his book, “Winning Fantasy Baseball”. I’ll change some of the things Schechter wrote to fit my situation, but the idea is the same:
“Suppose [Lucas]…goes over-board on closing pitchers because there are too many great deals (in his opinion) to pass up. Later he needs to try to trade a pitcher for a hitter. He has several [relief] pitchers he can trade…When he offers these pitchers for a trade, he will be offered hitters more in line with the auction price, not his value. In other words, nobody else thought [Clase] was worth more than $23, so he’s not going to receive more than a $23 hitter for [Clase]. He will be forced to trade [Clase] for a $23 hitter, thus negating the gain he thought he had by buying [Clase].”
Lastly, suppose I still was aggressive with closers and took both Clase and Hendriks, but used the $23 I spent on Díaz on a starting pitcher. In hindsight, which is 20/20, I would spend that $23 on a pitcher who actually went for $22. Maybe the bidding would have gone further up, but for this exercise, this logic is all I have. Here are the starting pitchers who went for $22:
What Could Have Been: SPs for $23
| Name |
Team |
ADP |
IP |
rPTS |
PTS |
aPOS |
Projected Salary |
Salary |
| Yu Darvish |
SDP |
79 |
189.2 |
872.6 |
16.0 |
$6.96 |
$23.95 |
$22.00 |
| Julio Urías |
LAD |
58 |
190.2 |
800.0 |
6.9 |
$6.96 |
$14.88 |
$22.00 |
**Projections use FanGraphs Auction calculator and Steamer
Just the points boost alone is enough to show how trading out that third closer for a more dependable stater at the same price makes more sense. Had I drafted Darvish instead of Díaz, I would have had an additional ~200 projected points to add to my total.
Conclusion: Drafting three elite closers is not the way to go, but drafting two and a good starting pitcher seems like a good strategy.
–
Hypothesis: Being aggressive and paying for top talent is better than waiting and spreading your money more evenly.
In addition to locking in closers and cornering the market like a savage, ruthless entrepreneur who walks out of his apartment building, onto the streets and screams, “Cash rules everything around me! C.R.E.A.M.! Get the money!”, I dove straight into top-tier hitter bidding:
The “Gunz Blazin'” Offense
*Projections use FanGraphs Auction calculator and Steamer
Having a roster with Vlad, Adley, J-Rod, and Soto made me giddier than a Canadian woman at a Shania Twain concert. But, that’s a lot of money spent early on. What we have here is a real “Stars and Scrubs” approach. The roster image above showed what I would consider my starting lineup, but just take a look at my bench:

That’s a long list of $1 players, but there are a few that I believe in. Regardless, how would things have looked had I passed on just one of my top targets, let’s say Julio Rodriguez at $47? Using the same logic as before and adding $1 to a few middle-of-the-pack players, I could have turned Julio Rodriguez into Seiya Suzuki and Jazz Chisholm, for example:
A One for Two Swap
| Name |
Team |
ADP |
PA |
rPTS |
PTS |
aPOS |
Projected Salary |
Salary |
| Seiya Suzuki |
CHC |
108 |
589 |
773.9 |
3.7 |
$19.96 |
$24.63 |
$24.00 |
| Jazz Chisholm Jr. |
MIA |
48 |
589 |
726.1 |
-2.3 |
$16.55 |
$15.25 |
$23.00 |
*Salary represents what I would have paid if I bid one more dollar and won
Obviously, the combination of these two players means I get more points, but who would have not been drafted? Well, that would have clearly been Adam Frazier. Here’s a breakdown:
J-Rod (rPTS 952.7) + Frazier (rPTS 445.8) = 1398.5 rPTS @ $48
or
Seiya (rPTS 773.9) + Jazz (rPTS 726.1) = 1500.0 rPTS @ $47
Conclusion: While there are a lot of assumptions being made here, the two middle-of-the-road players look better on paper. I’m saving $1 and generating 100 more points.
–
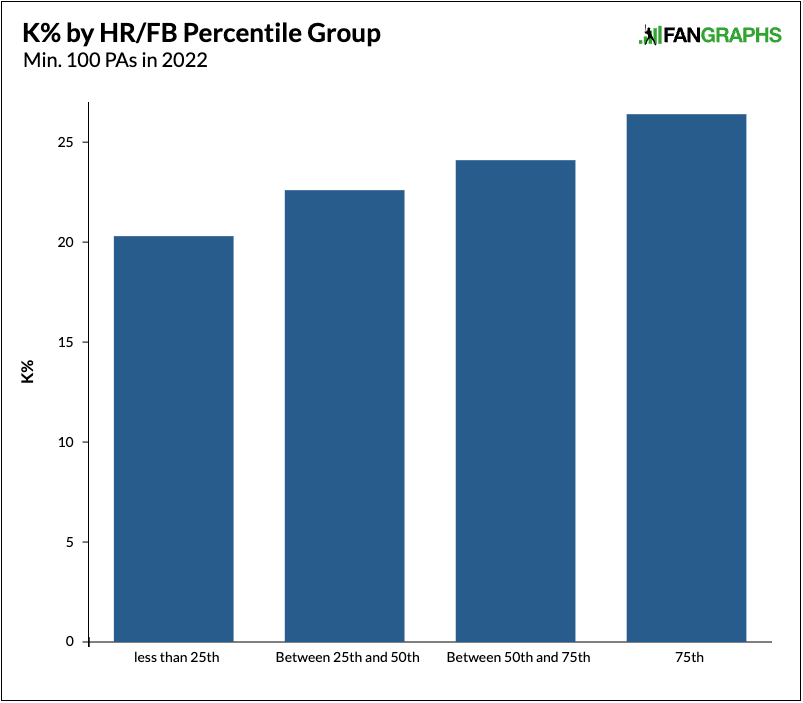
Hypothesis: I can still get a lot of playing time out of $1 players.
Last week I wrote about the value in keeping, or not keeping, prospects on your roster, especially if they are being paid more than $1. This is a tricky part of Ottoneu. First, Ottoneu points leagues have 162-game maximums for all positional players, so you have to be careful with how often you’re setting a full lineup. Maximums can sneak up on you when you least expect it. Having a solid bench is very important, but how much do you want to pay for players who will rarely be plugged into your starting squad? It’s a difficult thing to balance, but I tend to rely on plate appearances when stocking my bench. It’s terrible when you need to plug in a couple of substitutes, but everyone on the bench is in AAA or rarely starting. Here are all my $1 players’ projected plate appearances by steamer:
While many people target upside with their $1 bids, as they should, I chose to go with players who were still available and who can be counted on for plate appearances. I forced myself into this situation because of my aggressive spending from the outset, but I’d rather have players who I know I can plug in when I need to instead of players whose playing time may not be very reliable. The aggravating part about this strategy was that I was out of the bidding for players like J.D. Martinez ($3), Juan Yepez ($3), Jean Segura ($3), Gavin Lux ($2), and Brandon Drury ($2). These players were all taken at great value and I missed out.
Conclusion: Spending early and going after high-value players early forces you to fill your bench with $1 players, but $1 players can still carry playing time.
All in all, I’m happy with my lineup, I think I put together a decent rotation and I locked in the two best closers in the game. Things would have to go right for me to work into the top three at the end of the season, however. I would need a Giolito bounce back, a Morton-like Morton season, Tyler Anderson’s 2022 to be the real deal and for my players to stay healthy. That’s a lot to ask for, but if it all goes wrong, I can always start a re-build, tear down. That’s the fun part of Ottoneu.