The 2023 version of the Bullpen Report includes five different sections, as well as the closer chart, which can be found at the bottom of the page.
We will always include a link to the full Closer Depth Chart at the bottom of the Bullpen Report each day. It’s also accessible from the RosterResource drop-down menu and from any RosterResource page. Please let us know what you think.
Notable Workloads: Primary closers or valuable members of a closer committee who have been deemed unavailable or likely unavailable for the current day due to recent workload.
Injury News
Outlier Saves: Explanation for a non-closer earning a save during the previous day.
Committee Clarity: Notes on a closer committee that clarify a pitcher’s standing in the group.
Losing A Grip: Struggling closers who could be on the hot seat.
The “RosterResource” link will take you to the corresponding team’s RosterResource depth chart, which will give you a better picture of the full bullpen and results of the previous six days (pitch count, save, hold, win, loss, blown save).
Visualizations can give us better insight into our team’s performance, showing us aspects of the fantasy season that we hadn’t noticed of before. If you find yourself isolated to the merry-go-round of benching, starting, and looking at current auctions when it comes to in-season management, you’re likely missing something. Ottoneu has so many moving parts, so many extra subtleties that play a role in putting together a successful season. In this post, I’ll remind you of the great pre-made visualizations Ottoneu offers and I’ll give a few examples of how to effectively use them.
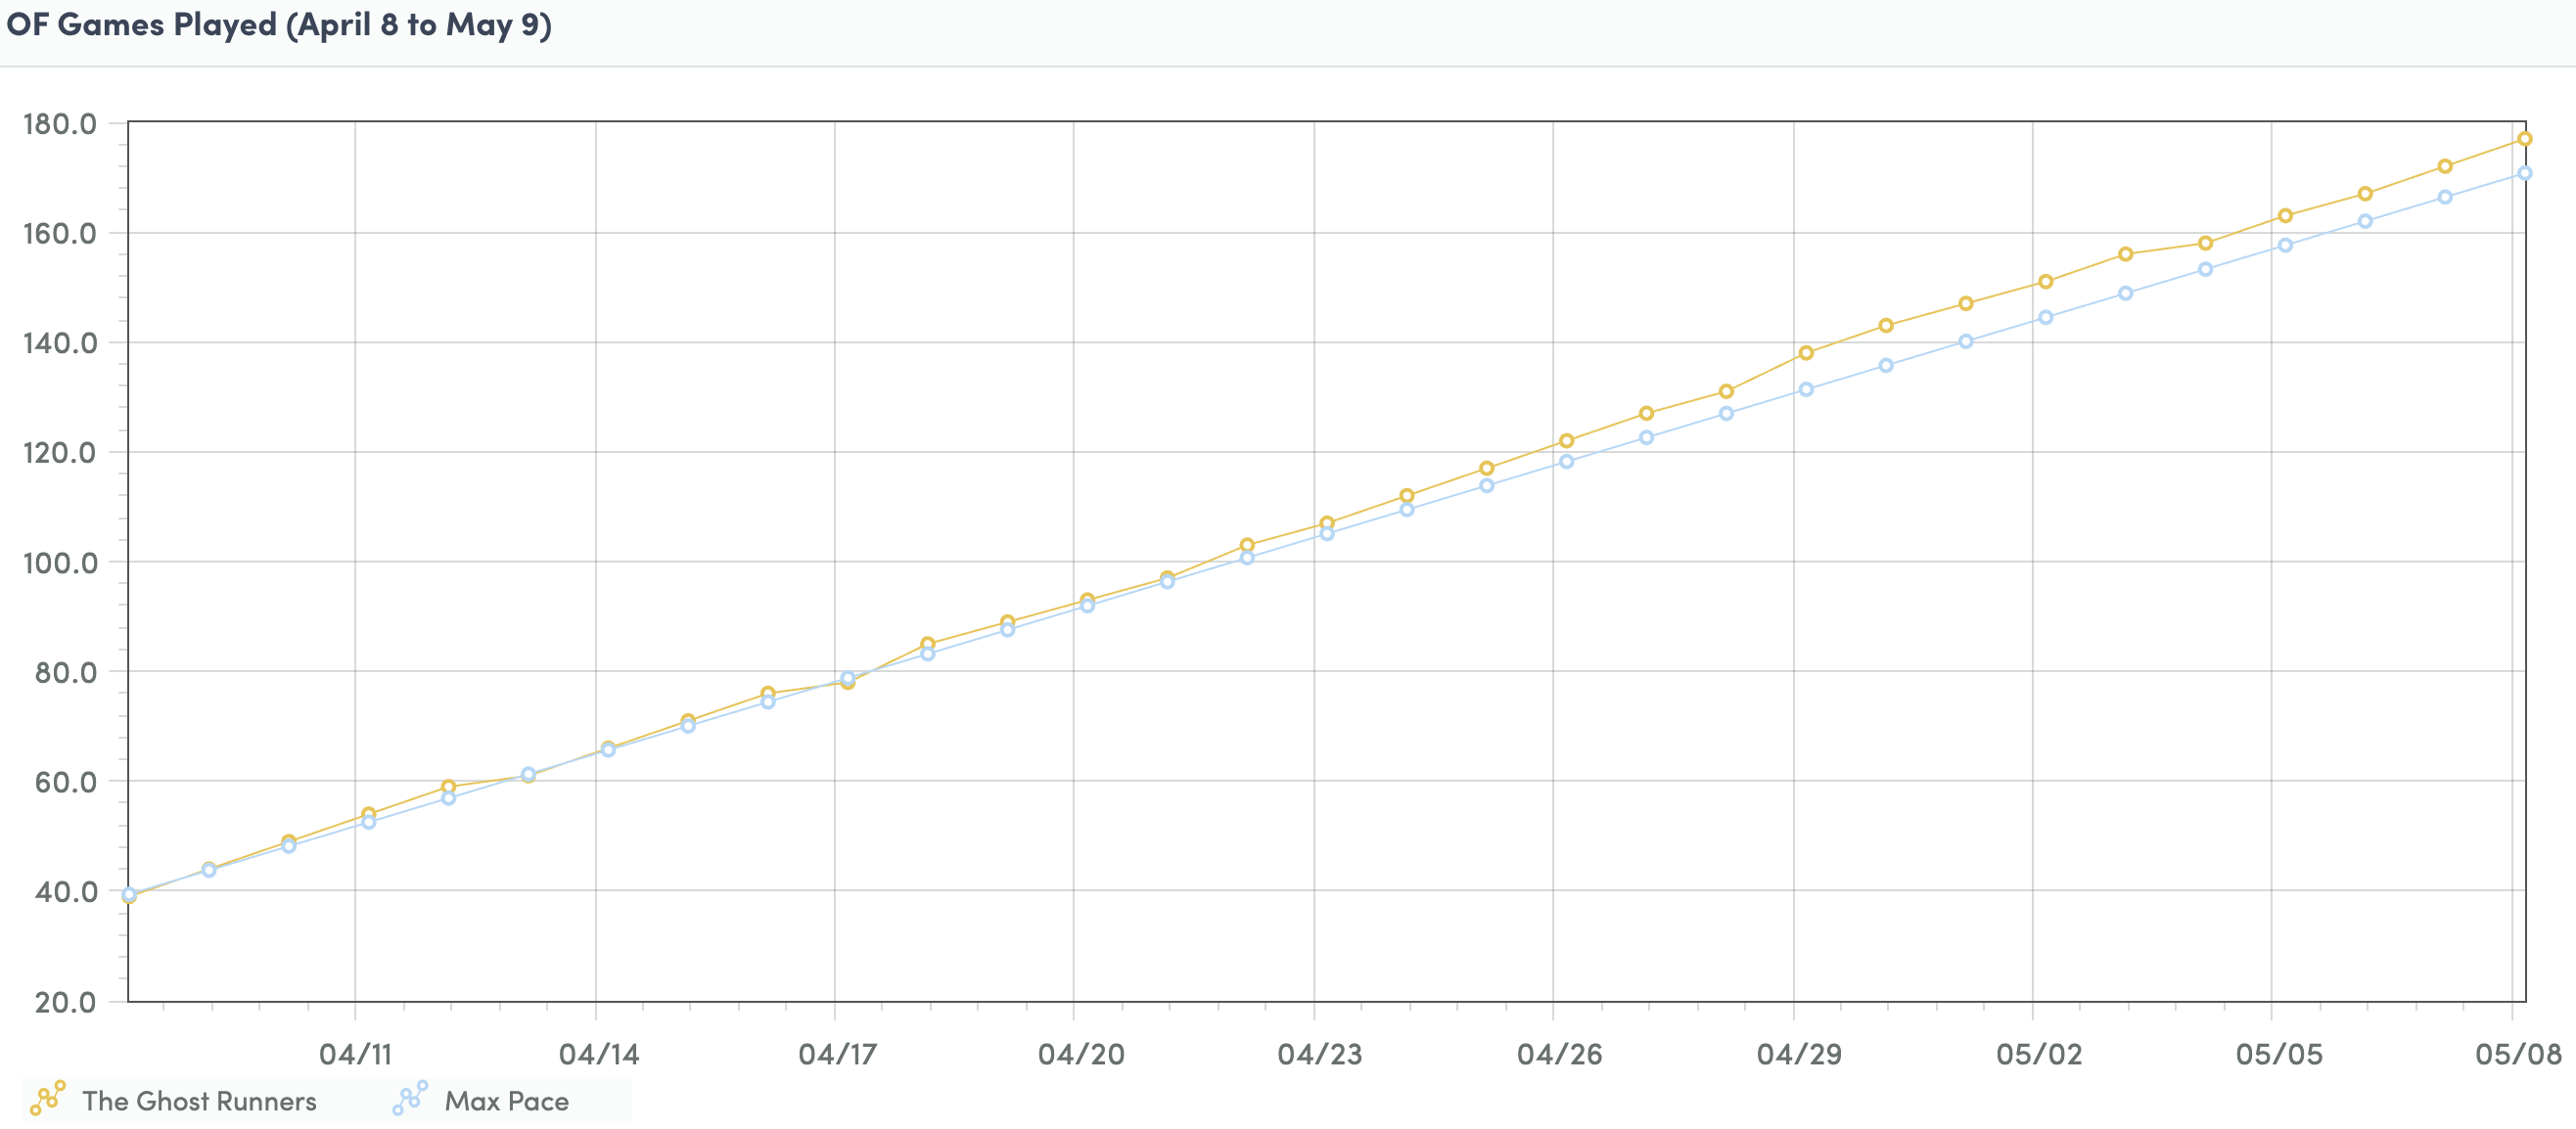
Viz #1: Pace and Limits
The pace visualizations may be the simplest, yet most useful. Check in on this as often as you can. If you notice that your team’s line, in this example, the yellow line, is going over the top of the blue line, you’re in trouble. There’s nothing worse than sitting in the top three in your league because you’ve boosted your pitching stats, going over the limit, and then watching helplessly as your team falls down the ranking ladder. On the other hand, don’t make your line so far below the “Max Pace” blue line that you are leaving points on the table.
Viz #2: Hitting Production Comparisons
Go to your league page and click on standings. Scroll down and you will find lots of helpful visualizations. In the (hard-to-see, I know) GIF below, keep an eye on the light-blue line representing my team and my per day points by offensive category.
It’s not always clear to me what I’m doing right and what I’m doing wrong in Ottoneu points leagues since I don’t have traditional roto scores to easily evaluate. Using visuals to see how you compare to top teams in your league can help. In the example above, I isolated the chart to only show my team and the two top teams in the league to see where I stand in relation. You can do this by simply clicking on the check boxes of teams you want to display below the x-axis. Then, I simply clicked through the stats I’m interested in analyzing. From this I can see that my team remains strong in walks and doubles, two big points accumulators, but that Im lacking in home runs. From here I can start thinking about ways of finding more power in hopes of balancing out some of my stats.
Viz #3: Pitching Production Comparisons
You can do the same exercise as above but with pitching statistics. Again, keep an eye on the blue line, my team. You’ll notice that compared to my competitors I am comparable in my daily saves and holds, but really lacking in strikeouts.
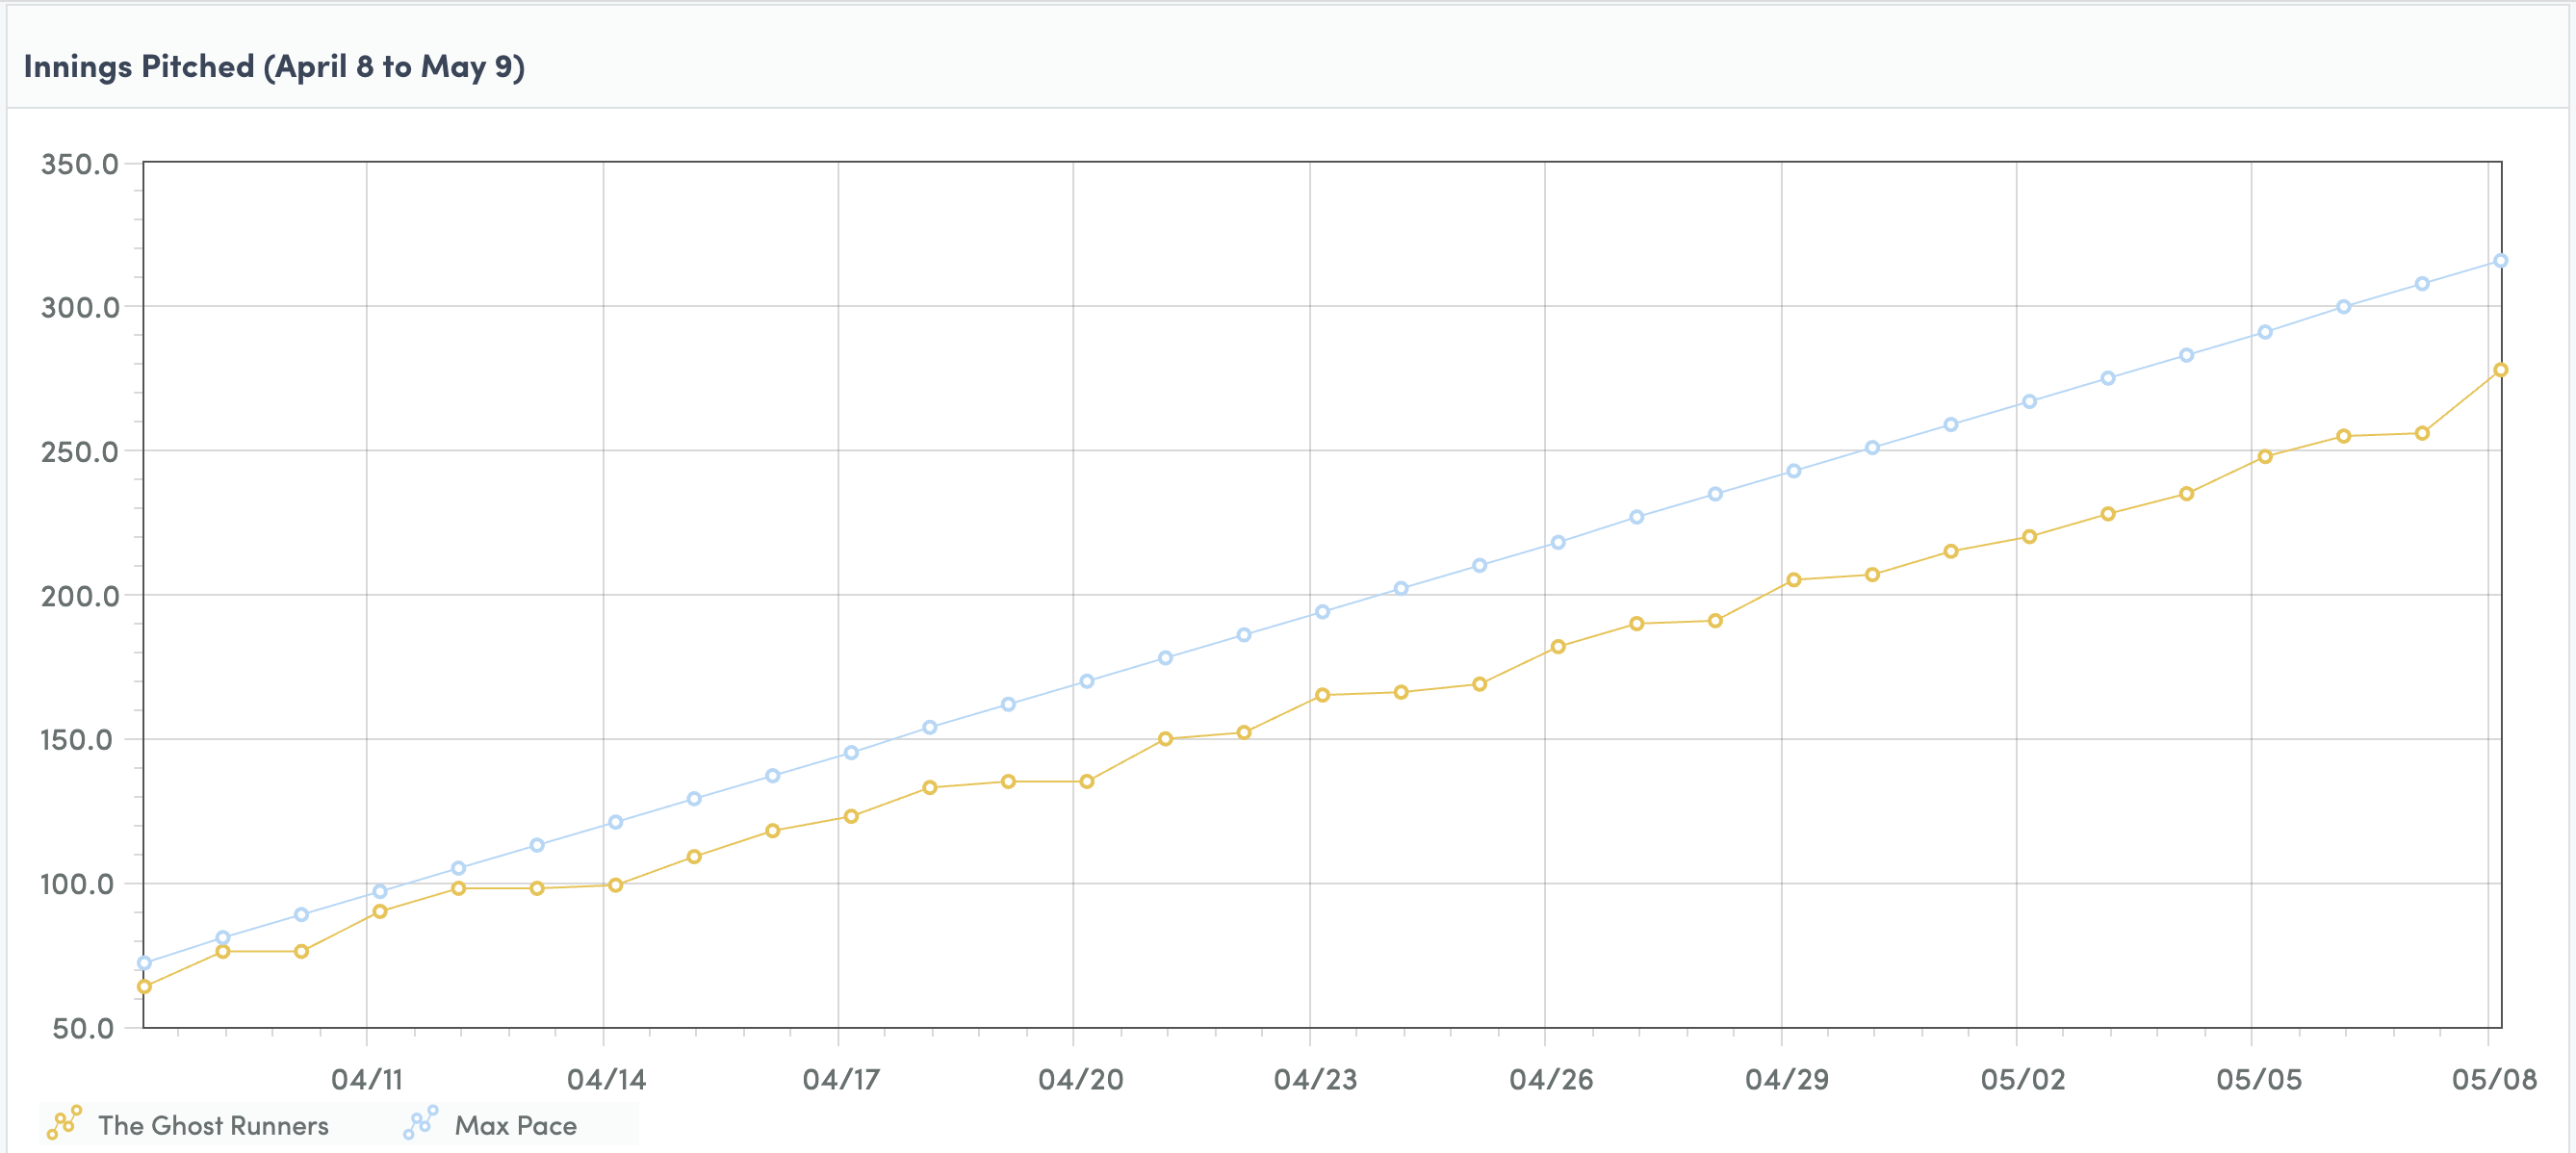
Now, if I couple this with the fact that my IP pace is well below where I should be by now, I can start thinking of adding more pitchers to my roster and getting more starts on the board.
Viz #4: Pitching Production Comparisons
Lastly, isolate the points per day visual down to the teams that are two places above and two places below you. This will help you identify how close you are to either advancing or being overtaken. In the visual below, my team is in yellow and I can see that I need roughly 10 more points per day to start advancing over my closest competitors. But, I can also see that I’m not separating myself from the teams that I’m beating by very much. It’s time to step on the gas!
Take the time to dig into these visualizations on your league standings page and you’ll get a much better sense of how your points are being gathered and what you need to do to move up the ranks.
The 2023 version of the Bullpen Report includes five different sections, as well as the closer chart, which can be found at the bottom of the page.
We will always include a link to the full Closer Depth Chart at the bottom of the Bullpen Report each day. It’s also accessible from the RosterResource drop-down menu and from any RosterResource page. Please let us know what you think.
Notable Workloads: Primary closers or valuable members of a closer committee who have been deemed unavailable or likely unavailable for the current day due to recent workload.
Injury News
Outlier Saves: Explanation for a non-closer earning a save during the previous day.
Committee Clarity: Notes on a closer committee that clarify a pitcher’s standing in the group.
Losing A Grip: Struggling closers who could be on the hot seat.
The “RosterResource” link will take you to the corresponding team’s RosterResource depth chart, which will give you a better picture of the full bullpen and results of the previous six days (pitch count, save, hold, win, loss, blown save).
I recently joined a men’s 30+ hardball league because, apparently, I love the bitter taste of failure. I felt like a superstar when I left my local sporting goods store with a scroll of a receipt and some fresh gear that would certainly make me, at least, look like I know what I’m doing out there. In my first at-bat, I struck out swinging, missing on a changeup by a country mile. This pitcher knew what he was doing.
He saw me whiff on a heater, threw it again and again as I timed it up and fouled off a few, changed pace and sent me back to the dugout, head down and red-faced. It was hard to time up. I’m serious. Now, replace that 75 MPH heater coming from a former D3 college pitcher with a 102 MPH heater coming from a man they call “The Mountain” and I would have certainly been found in the fetal position on the right side of the batter’s box.
Professional hitters, however, are used to this kind of thing. But, even they struggle. It’s all relative I suppose. Let’s take a look at a hitter, White Sox rookie Oscar Colás, trying to time up Félix Bautista on April 16th:
Colás quickly fouled one off and got the bat on the ball. But, prior to that, he took a ball up and in. The foul ball was his second look at Bautista’s four-seamer and waiting for pitch number three, he sat at 1-1. At this point, Colás saw two fastballs and it couldn’t have hurt to see one more. He took another ball, again the four-seamer, and got ahead in the count, 2-1. Three four-seamers down, Colás must have been feeling like he had Bautista timed. But, wait, doesn’t Bautista have a devastating splitter? That’s what the scouting reports said at least. Maybe that’s coming next? Nope:
Another heater and Colas barely got a hold it, but he was given another opportunity to time it up. Now at 2-2, he was thrown yet another heater and put it in play:
So when oh when does Bautista throw his splitter? At this point in the inning, Bautista threw six straight four-seam fastballs. He had his splitter ready and waiting, but the next batter, Seby Zavala didn’t get to see one. Instead, he was thrown one four-seamer and whiffed, then another that he put in play for a base hit. That means the four-seam count now came to eight in a row and hitters were catching on.
Early this season Orioles broadcasters have continually mentioned that Bautista, who got a late start to spring training due to trouble with his knee and shoulder, just hasn’t yet found the splitter. Stuff+ has given us a new way to look at whether a pitcher has or does not have a certain pitch. Let’s take a look at Bautista’s game-by-game splitter Stuff+ prior to this April 16th outing:
He may not have fully had it in his first few appearances, but the pitch was trending up. For context, the league average Stuff+ on a splitter among all relievers in 2023 currently sits at 103. There were only two games in this early time span where Bautista was below that mark. Prior to this April 16th appearance “The Mountain” started to find his groove with back-to-back appearances above 140. Coming off of two appearances with the splitter working and he hadn’t yet thrown it to a single batter in this game in question. But, just like a brilliant closer does, he waited for the perfect time.
Lenyn Sosa came to bat with two outs, having seen his teammates time up fastballs up in the zone, ready to attack. After a first pitch called strike on a four-seamer, perhaps Sosa was lulled into thinking it was just a fastball kind of day for Bautista. Wrong. The next pitch thrown to Sosa was a totally spiked splitter. In all honesty, it was spiked so hard that Sosa may have not have even identified it as a splitter. The next one, however, was gold:
Bautista then capped off his performance with a swinging strike on an unhittable splitter:
Bringing in the rest of Bautista’s appearances this season (last night’s (5/4) data hasn’t come in yet), we can see that he reached a peak in this April 16th game and in his next appearance on the 18th, but then came back down to earth a bit. What happened on the 29th? Four splitters that looked good, but certainly don’t look 322 Stuff+ good:
Splitter #1 was a non-competitive pitch. Splitter #2 earned a swinging strike, but it was left up in the zone and seems like it could have been sent for a ride. Splitter #3 was a big miss. Splitter #4 was a really good pitch and an even better take. All together it is unclear why these four splitters read at obscure/outlier levels, but perhaps there’s something going wrong in the data. Regardless, and what does seem clear, is there’s some potential for monitoring individual, put away pitches prior to matchups for both fantasy and real-life players. There’s a lot here that needs to be worked out, mostly creating a rolling average chart, quality checking game-by-game Stuff+ measures, and monitoring game-by-game Stuff+ to see if there’s any connection, not from a performance standpoint, but from a usage standpoint. I would like to answer the question, does an individual pitch’s Stuff+ measurement in the game prior, lead to increased usage in the following? For now, Bautista seems to be finding a devastating pitch and we’ll have to see how he utilizes it going forward.
The 2023 version of Ottoneu Hot Right Now will include three different sections:
Current Auctions: A closer look at players being auctioned at a high rate.
Roster Adds: Analysis of players with high add% changes.
Hot Performers: Players with a high P/G or P/IP in recent weeks.
The FanGraphs Ottoneu team plans to run this feature weekly, updating fantasy managers on the biggest movers in Ottoneu leagues with an analysis of how these players could or could not help your roster.
The 2023 version of the Bullpen Report includes five different sections, as well as the closer chart, which can be found at the bottom of the page.
We will always include a link to the full Closer Depth Chart at the bottom of the Bullpen Report each day. It’s also accessible from the RosterResource drop-down menu and from any RosterResource page. Please let us know what you think.
Notable Workloads: Primary closers or valuable members of a closer committee who have been deemed unavailable or likely unavailable for the current day due to recent workload.
Injury News
Outlier Saves: Explanation for a non-closer earning a save during the previous day.
Committee Clarity: Notes on a closer committee that clarify a pitcher’s standing in the group.
Losing A Grip: Struggling closers who could be on the hot seat.
The “RosterResource” link will take you to the corresponding team’s RosterResource depth chart, which will give you a better picture of the full bullpen and results of the previous six days (pitch count, save, hold, win, loss, blown save).
Using baseball-savant data and some Python code, I have written a script that will loop through a pitcher’s three most recent appearances and flag any pitcher who has shown an increase in their fastball velocity. In raw form, it looks something like this:
Looking at the table above we can see that each of these three pitchers increased their fastball (“FF” in savant data) consistently over their last three appearances. Don’t believe me? You can check my work with Savant visualizations:
While I wrote more specifically about the merits of paying close attention to game-by-game fastball increases, quoting many other studies and great pieces along the way, I won’t be writing about it again here. Instead, I’ll simply show you a list of the starters and relievers who have increased game-by-game average velocity on their four-seamers and hope that you can take it from there. Sure, you could scroll through stacks of player pages to find players who have increased velocity until the cows come home, or you could write some code that will detect those increases and flag those players for you. I chose the second way. If you find it useful, I’ll do it on a more regular basis. That’s it. This post is more about the data than the words:
The 2023 version of Ottoneu Hot Right Now will include three different sections:
Current Auctions: A closer look at players being auctioned at a high rate.
Roster Adds: Analysis of players with high add% changes.
Hot Performers: Players with a high P/G or P/IP in recent weeks.
The FanGraphs Ottoneu team plans to run this feature weekly, updating fantasy managers on the biggest movers in Ottoneu leagues with an analysis of how these players could or could not help your roster.
The 2023 version of the Bullpen Report includes five different sections, as well as the closer chart, which can be found at the bottom of the page.
We will always include a link to the full Closer Depth Chart at the bottom of the Bullpen Report each day. It’s also accessible from the RosterResource drop-down menu and from any RosterResource page. Please let us know what you think.
Notable Workloads: Primary closers or valuable members of a closer committee who have been deemed unavailable or likely unavailable for the current day due to recent workload.
Injury News
Outlier Saves: Explanation for a non-closer earning a save during the previous day.
Committee Clarity: Notes on a closer committee that clarify a pitcher’s standing in the group.
Losing A Grip: Struggling closers who could be on the hot seat.
The “RosterResource” link will take you to the corresponding team’s RosterResource depth chart, which will give you a better picture of the full bullpen and results of the previous six days (pitch count, save, hold, win, loss, blown save).
On Tuesday night the first round of the “Beltway Series” kicked off in D.C. and O’s fans showed out. It was a fun night all around. “Fired Up Guy” battled beltway traffic and came down to D.C. to give his support:
But the real fun was watching Dean Kremer work. Let me take you into a tense moment. It begins with no outs in the bottom of the third inning. CJ Abrams knocked a leadoff single into center field and waited patiently on first base. Next, Victor Robles reached, not first, but second on what was ruled an error by Gunnar Henderson. Take a look: