Workshop: Pitcher Injury Factors
Projecting pitcher injuries and their effect seems like the Holy Grail for fantasy analysis. From years of research on the subject, I find it’s just a frustration filled enterprise with no firm resolution. Until a start to the 2020 season has been agreed upon (or I eventually find an acceptable answer), I plan to continuously grind for a workable understanding of pitcher injuries.
First, this article will be a work in progress as I try to find answers to various questions. I can’t fill the RotoGraphs article list with a new article every time I make a change or add more information (Ed. note: Sure you can, Jeff, we’ll post all of ’em!). Every few days or so, I’ll summarize the findings from the previous article’s work and keep moving forward. The series will come to an abrupt end if the framework exists for a start to the season since other analysis will then take priority.
I’ve started down this path already with a couple of recent articles on pitcher injuries. Here is a summary of the findings:
- Accumulation of previous IL days leads to increase aging and injuries compared to other pitchers.
- Accumulation of arm injuries leads to increase aging and injuries compared to other pitchers.
- High fastball velocity leads to an increase in injuries compared to those who throw slower.
- Age doesn’t seem to be a factor with increase injuries beyond the baseline rate.
I need to combine these factors and I don’t feel confident about the results at all, but that’s why I’m asking for help. Using the benchmarks from the two articles, a pitcher gets one injury factor for:
- Throwing over 93 mph.
- Having two or more career arm injuries.
- Over 120 accumulated IL days with a bonus point for over 460 days.
And here are the 2019 starters (min 10 GS) grouped by the total injury factors.
| Name | Age | FBv | Total IL Days | On IL for Arm | Velo | Total IL | Arm | Factors |
|---|---|---|---|---|---|---|---|---|
| Charlie Morton | 36 | 94.4 | 551 | 4 | 1 | 2 | 1 | 4 |
| Homer Bailey | 34 | 93.0 | 626 | 8 | 1 | 2 | 1 | 4 |
| Nathan Eovaldi | 30 | 97.5 | 470 | 5 | 1 | 2 | 1 | 4 |
| Yu Darvish | 33 | 94.2 | 492 | 5 | 1 | 2 | 1 | 4 |
| Zack Wheeler | 30 | 96.7 | 460 | 5 | 1 | 2 | 1 | 4 |
| Adam Wainwright | 38 | 89.9 | 618 | 4 | 0 | 2 | 1 | 3 |
| Andrew Cashner | 33 | 93.9 | 375 | 4 | 1 | 1 | 1 | 3 |
| Brett Anderson | 32 | 90.8 | 918 | 6 | 0 | 2 | 1 | 3 |
| Carlos Carrasco | 33 | 93.5 | 432 | 5 | 1 | 1 | 1 | 3 |
| Chris Sale | 31 | 93.2 | 121 | 4 | 1 | 1 | 1 | 3 |
| Clay Buchholz | 35 | 89.5 | 717 | 4 | 0 | 2 | 1 | 3 |
| Gerrit Cole | 29 | 97.2 | 143 | 4 | 1 | 1 | 1 | 3 |
| Hyun-Jin Ryu 류현진 | 33 | 90.6 | 558 | 4 | 0 | 2 | 1 | 3 |
| Jason Vargas | 37 | 84.3 | 657 | 3 | 0 | 2 | 1 | 3 |
| Martin Perez | 29 | 94.1 | 377 | 5 | 1 | 1 | 1 | 3 |
| Matt Harvey | 31 | 93.2 | 433 | 4 | 1 | 1 | 1 | 3 |
| Michael Pineda | 31 | 92.6 | 511 | 5 | 0 | 2 | 1 | 3 |
| Rich Hill | 40 | 90.3 | 667 | 6 | 0 | 2 | 1 | 3 |
| Stephen Strasburg | 31 | 93.9 | 421 | 6 | 1 | 1 | 1 | 3 |
| Steven Matz | 29 | 93.4 | 244 | 5 | 1 | 1 | 1 | 3 |
| Vince Velasquez | 28 | 94.1 | 144 | 4 | 1 | 1 | 1 | 3 |
| Aaron Sanchez | 27 | 93.6 | 299 | 0 | 1 | 1 | 0 | 2 |
| Andrew Heaney | 29 | 92.5 | 419 | 4 | 0 | 1 | 1 | 2 |
| Anibal Sanchez | 36 | 90.5 | 427 | 5 | 0 | 1 | 1 | 2 |
| Anthony DeSclafani | 30 | 94.7 | 318 | 1 | 1 | 1 | 0 | 2 |
| Chris Bassitt | 31 | 93.5 | 290 | 2 | 1 | 1 | 0 | 2 |
| Clayton Kershaw | 32 | 90.4 | 217 | 3 | 0 | 1 | 1 | 2 |
| Cole Hamels | 36 | 91.4 | 182 | 4 | 0 | 1 | 1 | 2 |
| Danny Duffy | 31 | 92.4 | 414 | 7 | 0 | 1 | 1 | 2 |
| David Price | 34 | 92.0 | 199 | 4 | 0 | 1 | 1 | 2 |
| Dinelson Lamet | 27 | 96.1 | 289 | 2 | 1 | 1 | 0 | 2 |
| Drew Smyly | 31 | 91.2 | 355 | 3 | 0 | 1 | 1 | 2 |
| Dylan Covey | 28 | 94.4 | 131 | 2 | 1 | 1 | 0 | 2 |
| Eduardo Rodriguez | 27 | 93.1 | 162 | 0 | 1 | 1 | 0 | 2 |
| Edwin Jackson | 36 | 93.4 | 148 | 2 | 1 | 1 | 0 | 2 |
| Felix Hernandez | 34 | 89.6 | 313 | 4 | 0 | 1 | 1 | 2 |
| Frankie Montas | 27 | 96.6 | 183 | 0 | 1 | 1 | 0 | 2 |
| Ivan Nova | 33 | 92.4 | 299 | 4 | 0 | 1 | 1 | 2 |
| Jacob deGrom | 32 | 96.9 | 32 | 3 | 1 | 0 | 1 | 2 |
| Jake Arrieta | 34 | 92.5 | 140 | 3 | 0 | 1 | 1 | 2 |
| James Paxton | 31 | 95.5 | 361 | 2 | 1 | 1 | 0 | 2 |
| Jhoulys Chacin | 32 | 90 | 300 | 3 | 0 | 1 | 1 | 2 |
| Jon Gray | 28 | 96.1 | 136 | 0 | 1 | 1 | 0 | 2 |
| Jordan Zimmermann | 34 | 90.5 | 289 | 3 | 0 | 1 | 1 | 2 |
| Jose Urena | 28 | 95.9 | 124 | 1 | 1 | 1 | 0 | 2 |
| Kevin Gausman | 29 | 94 | 117 | 3 | 1 | 0 | 1 | 2 |
| Lance Lynn | 33 | 94.2 | 249 | 2 | 1 | 1 | 0 | 2 |
| Michael Wacha | 28 | 93.1 | 227 | 2 | 1 | 1 | 0 | 2 |
| Mike Foltynewicz | 28 | 94.9 | 84 | 3 | 1 | 0 | 1 | 2 |
| Mike Minor | 32 | 92.6 | 397 | 3 | 0 | 1 | 1 | 2 |
| Noah Syndergaard | 27 | 97.7 | 213 | 0 | 1 | 1 | 0 | 2 |
| Sonny Gray | 30 | 93.3 | 96 | 3 | 1 | 0 | 1 | 2 |
| Tyler Glasnow | 26 | 97 | 155 | 2 | 1 | 1 | 0 | 2 |
| Zach Eflin | 26 | 93.6 | 122 | 1 | 1 | 1 | 0 | 2 |
| Aaron Brooks | 30 | 92 | 183 | 0 | 0 | 1 | 0 | 1 |
| Aaron Nola | 27 | 92.9 | 143 | 2 | 0 | 1 | 0 | 1 |
| Adrian Houser | 27 | 94.4 | 0 | 0 | 1 | 0 | 0 | 1 |
| Antonio Senzatela | 25 | 93.7 | 29 | 1 | 1 | 0 | 0 | 1 |
| Blake Snell | 27 | 95.6 | 79 | 2 | 1 | 0 | 0 | 1 |
| Brad Keller | 24 | 93.4 | 0 | 0 | 1 | 0 | 0 | 1 |
| Brad Peacock | 32 | 92.2 | 257 | 2 | 0 | 1 | 0 | 1 |
| Brandon Woodruff | 27 | 96.3 | 57 | 0 | 1 | 0 | 0 | 1 |
| Brendan McKay | 24 | 93.7 | 0 | 0 | 1 | 0 | 0 | 1 |
| Cal Quantrill | 25 | 94.5 | 0 | 0 | 1 | 0 | 0 | 1 |
| CC Sabathia | 39 | 89.2 | 364 | 1 | 0 | 1 | 0 | 1 |
| Chase Anderson | 32 | 93.4 | 96 | 1 | 1 | 0 | 0 | 1 |
| Chi Chi Gonzalez | 28 | 92.2 | 182 | 1 | 0 | 1 | 0 | 1 |
| Chris Archer | 31 | 94.1 | 92 | 1 | 1 | 0 | 0 | 1 |
| Chris Paddack | 24 | 93.9 | 0 | 0 | 1 | 0 | 0 | 1 |
| Clayton Richard | 36 | 90.4 | 370 | 2 | 0 | 1 | 0 | 1 |
| Dakota Hudson | 25 | 93.7 | 0 | 0 | 1 | 0 | 0 | 1 |
| Daniel Norris | 27 | 90.8 | 357 | 0 | 0 | 1 | 0 | 1 |
| David Hess | 26 | 93 | 0 | 0 | 1 | 0 | 0 | 1 |
| Domingo German | 27 | 93.6 | 25 | 0 | 1 | 0 | 0 | 1 |
| Dylan Cease | 24 | 96.5 | 0 | 0 | 1 | 0 | 0 | 1 |
| German Marquez | 25 | 95.5 | 38 | 1 | 1 | 0 | 0 | 1 |
| Glenn Sparkman | 28 | 93.5 | 89 | 0 | 1 | 0 | 0 | 1 |
| Griffin Canning | 24 | 93.9 | 53 | 2 | 1 | 0 | 0 | 1 |
| J.A. Happ | 37 | 91.3 | 263 | 2 | 0 | 1 | 0 | 1 |
| Jack Flaherty | 24 | 93.9 | 0 | 0 | 1 | 0 | 0 | 1 |
| Jeff Hoffman | 27 | 93.7 | 31 | 1 | 1 | 0 | 0 | 1 |
| Jeff Samardzija | 35 | 91.9 | 139 | 2 | 0 | 1 | 0 | 1 |
| Jerad Eickhoff | 29 | 89.5 | 284 | 1 | 0 | 1 | 0 | 1 |
| Jon Lester | 36 | 90.3 | 162 | 0 | 0 | 1 | 0 | 1 |
| Jordan Lyles | 29 | 92.6 | 252 | 1 | 0 | 1 | 0 | 1 |
| Justin Verlander | 37 | 94.7 | 69 | 1 | 1 | 0 | 0 | 1 |
| Kyle Gibson | 32 | 93.3 | 57 | 1 | 1 | 0 | 0 | 1 |
| Lucas Giolito | 25 | 94.3 | 30 | 0 | 1 | 0 | 0 | 1 |
| Luis Castillo | 27 | 96.5 | 0 | 0 | 1 | 0 | 0 | 1 |
| Luke Weaver | 26 | 93.9 | 117 | 1 | 1 | 0 | 0 | 1 |
| Madison Bumgarner | 30 | 91.4 | 153 | 0 | 0 | 1 | 0 | 1 |
| Marcus Stroman | 29 | 92.5 | 217 | 1 | 0 | 1 | 0 | 1 |
| Masahiro Tanaka | 31 | 91.5 | 157 | 2 | 0 | 1 | 0 | 1 |
| Max Fried | 26 | 93.8 | 52 | 0 | 1 | 0 | 0 | 1 |
| Max Scherzer | 35 | 94.9 | 64 | 1 | 1 | 0 | 0 | 1 |
| Mike Clevinger | 29 | 95.5 | 79 | 0 | 1 | 0 | 0 | 1 |
| Mike Soroka | 22 | 92.5 | 129 | 2 | 0 | 1 | 0 | 1 |
| Miles Mikolas | 31 | 93.6 | 0 | 0 | 1 | 0 | 0 | 1 |
| Mitch Keller | 24 | 95.4 | 0 | 0 | 1 | 0 | 0 | 1 |
| Pablo Lopez | 24 | 93.6 | 108 | 2 | 1 | 0 | 0 | 1 |
| Patrick Corbin | 30 | 91.9 | 272 | 2 | 0 | 1 | 0 | 1 |
| Reynaldo Lopez | 26 | 95.5 | 14 | 0 | 1 | 0 | 0 | 1 |
| Ross Detwiler | 34 | 91.4 | 165 | 1 | 0 | 1 | 0 | 1 |
| Sandy Alcantara | 24 | 95.6 | 0 | 0 | 1 | 0 | 0 | 1 |
| Shane Bieber | 25 | 93.1 | 0 | 0 | 1 | 0 | 0 | 1 |
| Spencer Turnbull | 27 | 93.8 | 32 | 1 | 1 | 0 | 0 | 1 |
| Taylor Clarke | 27 | 93.7 | 16 | 0 | 1 | 0 | 0 | 1 |
| Trevor Bauer | 29 | 94.6 | 38 | 0 | 1 | 0 | 0 | 1 |
| Tyler Beede | 27 | 94.3 | 0 | 0 | 1 | 0 | 0 | 1 |
| Tyler Mahle | 25 | 93.3 | 33 | 0 | 1 | 0 | 0 | 1 |
| Tyler Skaggs | 28 | 91.4 | 430 | 2 | 0 | 1 | 0 | 1 |
| Walker Buehler | 25 | 96.6 | 16 | 0 | 1 | 0 | 0 | 1 |
| Yonny Chirinos | 26 | 93.9 | 81 | 1 | 1 | 0 | 0 | 1 |
| Zach Davies | 27 | 88.5 | 120 | 2 | 0 | 1 | 0 | 1 |
| Zach Plesac | 25 | 94 | 0 | 0 | 1 | 0 | 0 | 1 |
| Zack Greinke | 36 | 90 | 188 | 1 | 0 | 1 | 0 | 1 |
| Aaron Civale | 25 | 92.6 | 0 | 0 | 0 | 0 | 0 | 0 |
| Adam Plutko | 28 | 91.1 | 0 | 0 | 0 | 0 | 0 | 0 |
| Alex Young | 26 | 89.3 | 0 | 0 | 0 | 0 | 0 | 0 |
| Ariel Jurado | 24 | 92.4 | 0 | 0 | 0 | 0 | 0 | 0 |
| Asher Wojciechowski | 31 | 91.6 | 0 | 0 | 0 | 0 | 0 | 0 |
| Caleb Smith | 28 | 91.6 | 117 | 1 | 0 | 0 | 0 | 0 |
| Dallas Keuchel | 32 | 88.4 | 63 | 0 | 0 | 0 | 0 | 0 |
| Dario Agrazal | 25 | 91.2 | 0 | 0 | 0 | 0 | 0 | 0 |
| Dereck Rodriguez | 28 | 90.6 | 7 | 0 | 0 | 0 | 0 | 0 |
| Dillon Peters | 27 | 91.1 | 0 | 0 | 0 | 0 | 0 | 0 |
| Dylan Bundy | 27 | 91.2 | 30 | 1 | 0 | 0 | 0 | 0 |
| Elieser Hernandez | 25 | 90.6 | 53 | 0 | 0 | 0 | 0 | 0 |
| Eric Lauer | 25 | 91.9 | 30 | 1 | 0 | 0 | 0 | 0 |
| Erick Fedde | 27 | 92.3 | 88 | 2 | 0 | 0 | 0 | 0 |
| Gio Gonzalez | 34 | 89.3 | 80 | 2 | 0 | 0 | 0 | 0 |
| Jacob Waguespack | 26 | 91.6 | 35 | 1 | 0 | 0 | 0 | 0 |
| Jaime Barria | 23 | 91.7 | 0 | 0 | 0 | 0 | 0 | 0 |
| Jake Odorizzi | 30 | 92.9 | 75 | 0 | 0 | 0 | 0 | 0 |
| Jakob Junis | 27 | 91.5 | 13 | 0 | 0 | 0 | 0 | 0 |
| Joe Musgrove | 27 | 92.4 | 76 | 2 | 0 | 0 | 0 | 0 |
| Joey Lucchesi | 27 | 90.2 | 36 | 0 | 0 | 0 | 0 | 0 |
| John Means | 27 | 91.8 | 24 | 2 | 0 | 0 | 0 | 0 |
| Jordan Yamamoto | 24 | 91.5 | 27 | 1 | 0 | 0 | 0 | 0 |
| Jose Berrios | 26 | 92.8 | 0 | 0 | 0 | 0 | 0 | 0 |
| Jose Quintana | 31 | 91.4 | 0 | 0 | 0 | 0 | 0 | 0 |
| Jose Suarez | 22 | 91.8 | 0 | 0 | 0 | 0 | 0 | 0 |
| Julio Teheran | 29 | 89.7 | 28 | 0 | 0 | 0 | 0 | 0 |
| Kenta Maeda | 32 | 92.1 | 37 | 0 | 0 | 0 | 0 | 0 |
| Kyle Freeland | 27 | 91.9 | 51 | 0 | 0 | 0 | 0 | 0 |
| Kyle Hendricks | 30 | 86.9 | 66 | 1 | 0 | 0 | 0 | 0 |
| Marco Gonzales | 28 | 88.9 | 15 | 0 | 0 | 0 | 0 | 0 |
| Matthew Boyd | 29 | 92 | 0 | 0 | 0 | 0 | 0 | 0 |
| Merrill Kelly 켈리 | 31 | 91.9 | 0 | 0 | 0 | 0 | 0 | 0 |
| Mike Fiers | 35 | 90.4 | 11 | 0 | 0 | 0 | 0 | 0 |
| Mike Leake | 32 | 88.4 | 51 | 1 | 0 | 0 | 0 | 0 |
| Nick Margevicius | 24 | 88.3 | 0 | 0 | 0 | 0 | 0 | 0 |
| Peter Lambert | 23 | 92.7 | 0 | 0 | 0 | 0 | 0 | 0 |
| Rick Porcello | 31 | 90.5 | 27 | 1 | 0 | 0 | 0 | 0 |
| Robbie Ray | 28 | 92.4 | 94 | 0 | 0 | 0 | 0 | 0 |
| Ryan Yarbrough | 28 | 88.2 | 0 | 0 | 0 | 0 | 0 | 0 |
| Shaun Anderson | 25 | 92.6 | 16 | 0 | 0 | 0 | 0 | 0 |
| Steven Brault | 28 | 92 | 31 | 1 | 0 | 0 | 0 | 0 |
| Tanner Roark | 33 | 92.1 | 0 | 0 | 0 | 0 | 0 | 0 |
| Trent Thornton | 26 | 92.9 | 11 | 1 | 0 | 0 | 0 | 0 |
| Trevor Richards | 27 | 90.9 | 0 | 0 | 0 | 0 | 0 | 0 |
| Trevor Williams | 28 | 91.3 | 33 | 0 | 0 | 0 | 0 | 0 |
| Wade Miley | 33 | 90.5 | 83 | 1 | 0 | 0 | 0 | 0 |
| Yusei Kikuchi | 29 | 92.5 | 0 | 0 | 0 | 0 | 0 | 0 |
| Zac Gallen | 24 | 92.9 | 0 | 0 | 0 | 0 | 0 | 0 |
What seems off?
Two areas of exploration I see from just putting words to the ideas are age and recent injuries. I just need to make sure age doesn’t have a greater effect than is already factored in. Second, Carlie Morton near the top intrigues me. I wonder if a IL recency factor needs to be added in. I know that the two aren’t the only questions, but they’ll keep me busy for a bit. What else is missing and can be explored? Let’s find as many answers to this to pitcher injuries.
Append #1: Aging
I took all the Steamer Projections and look how it did at projecting IP and stats for different ages. I didn’t find much if anything. First is how the projections held up for players under and over 30 (projected GS/G >= .5 and IP >= 10)
| Age | IP | ERA | WHIP | K_9 | BB_9 |
|---|---|---|---|---|---|
| Under 30 | -10.4 | 0.44 | 0.04 | 0.31 | 0.15 |
| 30 and Over | -15.4 | 0.30 | 0.03 | 0.12 | 0.14 |
The older starters underperformed their projections by five innings but generally overperformed in the talent stats when compared to the Younger hitters.
Innings: Actual Minus Innings Projected Grouped by Age
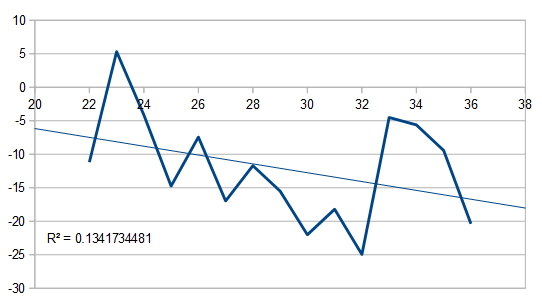
Rate Stats: Actual Minus Innings Projected Grouped by Age

I sort of see some trends … maybe.
6/19/20 update: While working with the Il days grouped by total days and the past two seasons, I found no signs that age was not properly accounted for.
Append #2: Previous Durability
| Previous Two GS | IP | ERA | WHIP | K_9 | BB_9 | Count |
|---|---|---|---|---|---|---|
| >= 60 | -12.4 | 0.08 | 0.00 | 0.14 | 0.03 | 432 |
| 50 to 59 | -11.2 | 0.53 | 0.07 | 0.25 | 0.24 | 502 |
| 40 to 49 | -4.9 | 0.68 | 0.10 | 0.38 | 0.31 | 839 |
| 30 to 39 | -3.5 | 0.73 | 0.10 | 0.41 | 0.73 | 2597 |
| 20 to 29 | 3.7 | 0.96 | 0.13 | 0.40 | 0.88 | 3357 |
The durable pitchers lose a few more innings but almost match their projections. It’ time to make a Morton clone. Years of injuries but a recent clean slate.
6/19/20 Update: I’ve been cutting and dicing the data based on the total IL days and the ones accumulated over the past two seasons. I ran the data while accounting for age. Age doesn’t seem to be an issue. Here is the most simplified data at this point:
| Total IL | Last 2 IL | IP | ERA | WHIP | K_9 | BB_9 |
|---|---|---|---|---|---|---|
| 120 or less | <= 30 | -8 | 0.32 | 0.03 | 0.36 | 0.06 |
| > 30 | -21 | 0.48 | 0.05 | 0.03 | 0.38 | |
| Over 120 | <= 30 | -17 | 0.24 | 0.01 | 0.13 | -0.01 |
| > 30 | -15 | 0.57 | 0.07 | 0.18 | 0.26 |
While these starters with over 120 career IL perform worse, being healthy over the past two seasons seems to stop a decline in talent. Now, I just picked 30 days out of thin air. My next step is to see if there is a better designation point.
Update: And 30 days was a damn fine guess. I’m not sure where to go next.
Jeff, one of the authors of the fantasy baseball guide,The Process, writes for RotoGraphs, The Hardball Times, Rotowire, Baseball America, and BaseballHQ. He has been nominated for two SABR Analytics Research Award for Contemporary Analysis and won it in 2013 in tandem with Bill Petti. He has won four FSWA Awards including on for his Mining the News series. He's won Tout Wars three times, LABR twice, and got his first NFBC Main Event win in 2021. Follow him on Twitter @jeffwzimmerman.
Jeff, this is interesting research. Two thoughts: I think the injury factors would be more useful for fantasy if playing time impact were separated from effectiveness (should I expect Ryu to be excellent whenever he isn’t on IL, or not?), and then for playing time and effectiveness, it would help to assess the independence of each injury factor and give each factor it’s appropriate weighting. That would help a fantasy player make an educated guess about the riskiness of each pitcher.
Thanks for doing all this work!
I like the idea of splitting apart more aging vs playing time.
I’m on it for an article early next week.
Jeff, just want to applaud your dedication to a herculean task. I’m not sure where this goes either, but if you can keep up this level of commitment, with your skill and perception, I believe the odds are excellent you will make extraordinary and long-lasting contributions.