Velocity Paired Fastballs & Unique Vertical Break Descriptions
Dan Hamilton-Imagn Images
In this week’s FAAB and Waiver Wire Report, I mentioned that José Soriano’s fastballs were a matched pair with a short description of the concept. I wrote the idea up in this year’s edition of The Process, but here is another description of it (so I can link it instead of writing it up every time I mention it). Besides the matched fastballs, I discuss having a unique drop rate compared to the other pitches, which leads to a plus pitch.
“Velocity Paired Fastballs” (horrible name, give me ideas)
The concept is an unproven theory that fastballs perform better than expected when thrown at the same speed but with a major difference in their vertical break. From the book, I describe the pitches as
… a sinker and four-seamer fastball within 0.5 mph and more than a 5” difference in vertical break
My theory is that a major league hitter has enough experience that they can pick up on a pitch’s speed, but are unsure of how much the pitch will break vertically. With each pitch dropping different amounts, the hitter is more likely not to square up the ball or miss it entirely.
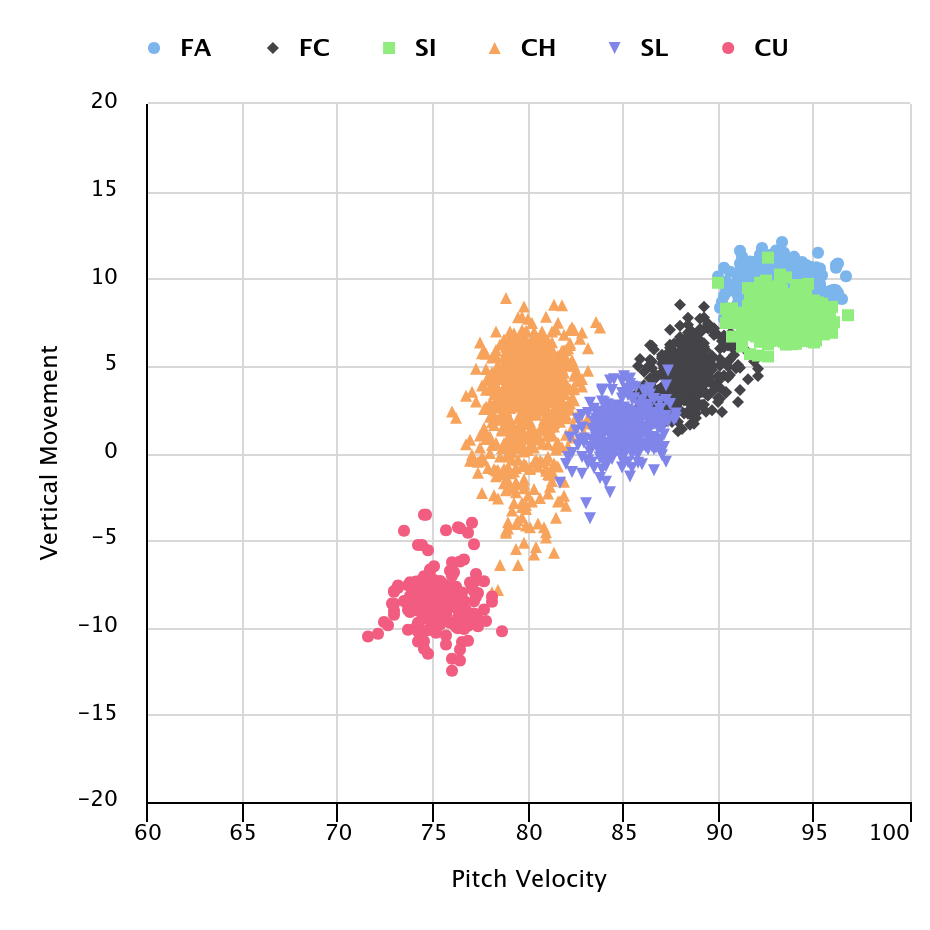
Bryan Woo is this concept’s poster child. Here is his Pitch Velocity vs Vertical movement chart from last season.
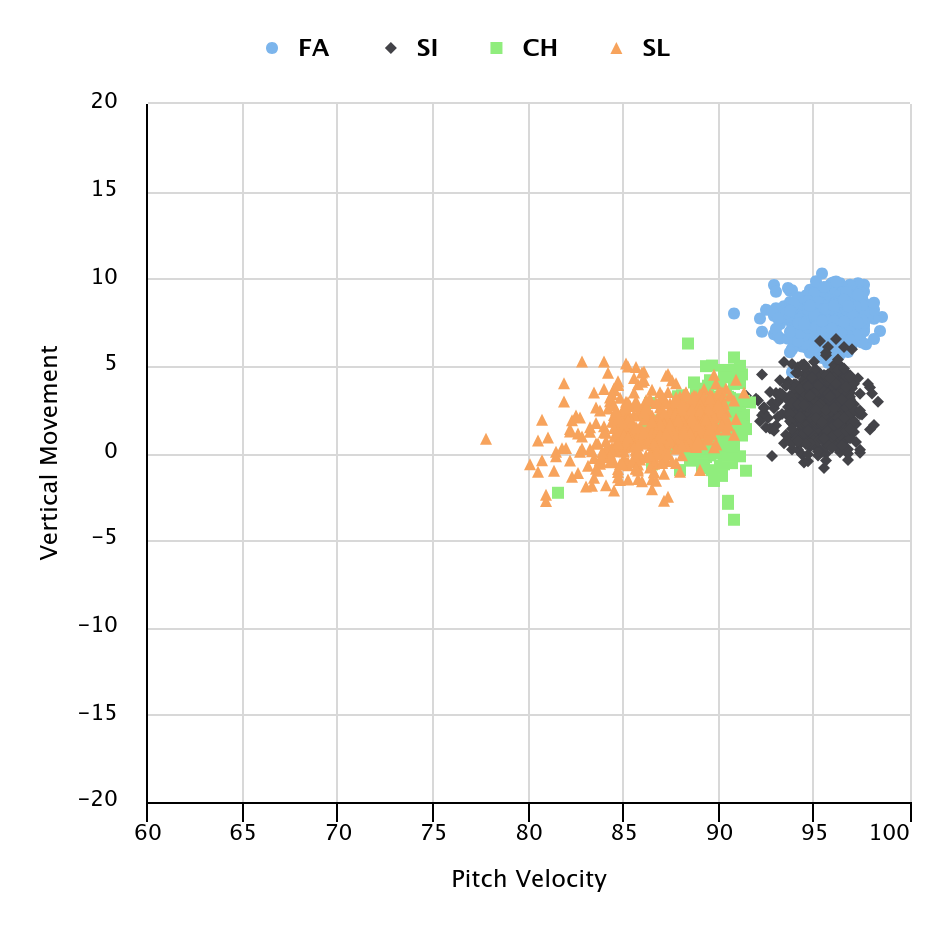
The drop on the pitches differs by ~6″ while both come in around 95 mph. The spray pattern on each pitch is distinct and they don’t overlap. Over Woo’s career, his four-seamer has a 14% SwStr% while batters have only hit a .606 OPS against it. The sinker doesn’t miss as many bats (6% SwStr%) but produces a 63% GB%, leading to a .638 OPS against.
On the other end of the spectrum is Huston Waldrep (who throws a bit faster). There isn’t as much distinction between his three fastballs. There is no way to know where one starts and the other ends.
None of his fastballs missed bats (4% to 8% SwStr%). While his sinker generated some weak contact (.587 vsOPS), his cutter (.985 vsOPS) and four-seamer (1.167 vs OPS) got hit around.
Unique Vertical Break Pitch (another horrible name)
With this concept, a pitch will stand out if its vertical drop is not proportional to the pitcher’s other pitches. The faster a pitch is thrown, the less time gravity has to act on the ball. Throwing a pitch that generates more or less vertical break than can be accounted for by the effect of gravity is key.
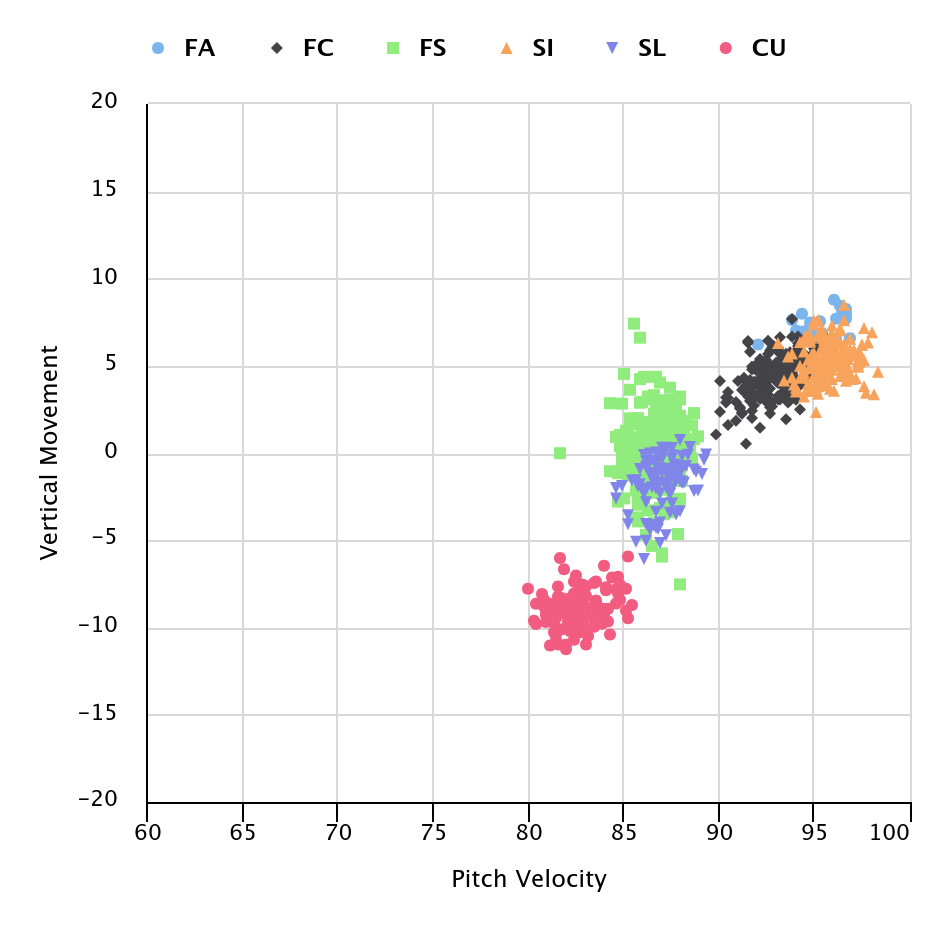
For an example of what not to do, here’s Shota Imanaga’s velocity vs vertical break plot.
A straight line can be drawn between each pitch. Each of his pitches drops proportionally to its speed.
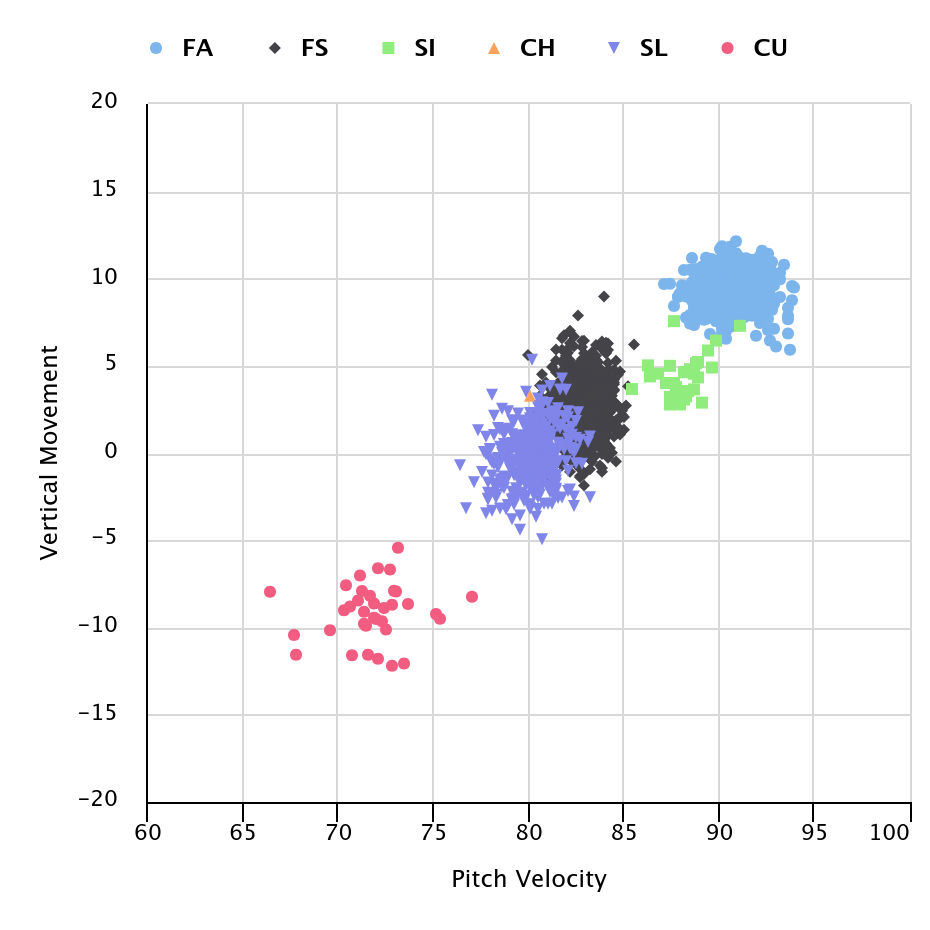
Now, here is the plot for Michael Wacha.
It is obvious which pitch doesn’t drop the same as the others. It is the same pitch with a career 17% SwStr%. While the changeup is a plus offering, his overlapping sinker and four-seamer don’t miss many bats and get hit around.
Not everything can be gleaned from these graphs, not even close. But when the pitch results don’t match the pitch’s stuff, take a look at the Velocity vs Vertical break graph. That can often go a long way towards explaining the disconnect.
Jeff, one of the authors of the fantasy baseball guide,The Process, writes for RotoGraphs, The Hardball Times, Rotowire, Baseball America, and BaseballHQ. He has been nominated for two SABR Analytics Research Award for Contemporary Analysis and won it in 2013 in tandem with Bill Petti. He has won four FSWA Awards including on for his Mining the News series. He's won Tout Wars three times, LABR twice, and got his first NFBC Main Event win in 2021. Follow him on Twitter @jeffwzimmerman.
Evil Twins?
I might suggest looking also at spin rate.