The Truth About Pitch Values
It seems as though each year, fantasy baseball analysts, “professional” and amateur alike, hone in on a new — or, if not new, then relatively untouched — metric or data set for their endlessly eager consumption. In 2015, FanGraphs introduced batted ball data to its leaderboards. In 2016, Statcast data was unveiled, although it arguably didn’t become popular until 2017, and before the 2017 season FanGraphs changed the game with its splits leaderboard. Baseball Prospectus has introduced myriad new metrics, too — DRA in 2015, DRC+ last year, etc. — and we began to lean into pitch-specific performance analysis last year. (The latter-most topic is relevant to what follows here.)
I recently joined Christopher Welsh and Scott Bogman of In This League on their podcast. I thought one of the evening’s questions was particularly topical and prescient (and I paraphrase): What will 2019’s it metric be? The question was asked with pitch values, something I’ve seen garner increasing attention on Twitter, in mind.
You can acquaint yourself with pitch values directly from the man who created them:
The run value of any event is the change in the expected number of runs scored over the rest of the inning from before and after the event happened. The expected number of runs scored is the average number scored from a given out and base-occupancy state. […] You can do the same thing taking each pitch as as event rather than the outcome of each at-bat. To do this you need to know the run expectancy from each count, in other words, the average run value of all events from at-bats which pass through a given count.
In other words, pitch value is effectively a pitch-specific earned run average, about which I warned as much on ye olde Twitter machine:
PSA: pitch values are effectively the ERA of pitch-level measurements. above-average pitch value (in a given season) ≠ above-average pitch
— Alex "Oxlade" Chamberlain (@DolphHauldhagen) January 2, 2019
I actually said that without quantifying it, though. So let’s quantify it.
FanGraphs hosts three different measures of pitch value: standard (for lack of a better descriptor — I have no idea what the formal name might be), PITCHf/x (custom leaderboard), and Pitch Info (also custom). I pulled all of these values along with ERA, FIP, xFIP, and SIERA for all qualified pitcher seasons since the start of 2014 (n=354).
For every unique pitcher-season, I summed the pitch-specific pitch values (i.e., wFA + wCH + etc.) from each data source to achieve what essentially amount to arsenal-specific pitch values. Because pitch values behave incrementally (like runs or RBI) and not like ratios (like ERA or WHIP), I had to take care to control for sample size. For example, an aggregate (full arsenal) pitch value of 20.0 is much more impressive across 100 innings of work than it is across 200.
(FanGraphs provides pitch values per 100 pitches — they’re identifiable with the “/C” suffix — but using them here would allow us to evaluate value only in relative terms, not absolute/total terms.)
After these adjustments, I specified the following regressions, written here in shorthand (adjusted r2 for each, after the colon):
- y = standard pitch values, x = ERA: r2 = 0.748
- y = PITCHf/x pitch values, x = ERA: r2 = 0.750
- y = Pitch Info pitch values, x = ERA: r2 = 0.751
- y = standard pitch values, x = FIP: r2 = 0.607
- y = standard pitch values, x = xFIP: r2 = 0.434
- y = standard pitch values, x = SIERA: r2 = 0.441
There are two key observations to glean from these results:
- Pitch values correlate most strongly with ERA, then FIP, followed by xFIP and SIERA. (Keep this in mind, as it’s important.)
- No single source for pitch values performed significantly, or even marginally, better than the others. Simply using the default leaderboard will suffice.
Indeed, pitch values are the ERA of pitch-level analysis. Most strikingly is how the correlations between pitch values and each ERA descriptor compare to one another. It’s a spitting image of how FIP, xFIP, and SIERA correlate directly with ERA:
- ERA to FIP: r2 = 0.566
- ERA to xFIP: r2 = 0.387
- ERA to SIERA: r2 = 0.391
FIP’s relative strength of correlation compared to xFIP and SIERA almost perfectly mirrors that of the pitch value correlations. Given the theoretical basis of pitch values and their relationship to player performance (almost exclusively outcomes-based), this is an unsurprising development, but it’s still fascinating to nerds like me.
Here’s my spiel: If you want to cite pitch values, that’s fine. But know that it’s the equivalent of citing a pitcher’s ERA: it does exactly what it’s supposed to do, which is describe what has happened and nothing else. Sometimes what has happened reflects actual talent and intent, other times not. Mostly, on a spectrum from descriptive to predictive, it skews heavily toward the former.
What we need to develop, in our attitude toward pitch values, is the same healthy skepticism we have naturally developed over time toward ERA. Pretend Jason Vargas (sorry, picking on you, Jason) has a 1.78 ERA through the end of May. How does that make you feel? What’s your first inclination? Probably to rip that sucker wide open, poke around its guts, find out why or how this could be happening — that is, what skills support the performance and/or if luck is involved.
Realistically, we could and probably should do the same for pitch values. It’s harder because, again, we simply lack the strength of intuition we possess for ERA. All pitches behave differently, and they’re almost all predicated upon small sample sizes. As if forecasting pitching performance wasn’t already hard enough with a full 200-inning sample, subdividing that performance further complicates things.
FanGraphs provides essential tools for pitch-level analysis, though, conveniently on each player’s splits page. Take Derek Holland, for example, the first name to pop up for me on FanGraphs’s search bar. Let’s look at his fastball. We can see, in the fourth and final module (Plate Discipline & Value), his fastball generated -11.0 runs of value in 2017 before rebounding to league-average stature (-0.9 runs) in 2018 as it had been in 2016 (0.0 runs). What happened in 2017, then? Well, the pitch suffered a .385 batting average on balls in play (BABIP) — the worst mark against his fastball in his career. While much more is at play here, the same way that more than just BABIP makes or breaks a pitcher as a whole, it’s reasonable to expect that a .385 BABIP is bad luck against a pitch with a .305 BABIP allowed over the course of Holland’s career. Pitch values, like ERA, is simply a description and an acceptance of what happened, with no skills- or luck-based contextualization beyond that.
In short, we can use all the same tools we use to evaluate pitchers as a whole to evaluate their pitches piecemeal without reinventing the wheel. Again, it’s a little more difficult, given sample size issues, year-to-year volatility, and the inherent uniqueness of each pitch. But difficulty is not a good reason to not do it!
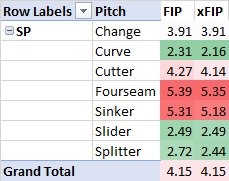
I know, pitch-specific FIP/xFIP/SIERA values would be helpful… they don’t exist formally, but I did my best to calculate league-average FIP and xFIP by pitch type for starting pitchers. Consider it an appendix to my recent post in which I contexualized league-wide pitch-specific performance for the 2018 season. My treat.
Honestly, I’d take this another step. If you’re trying to use pitch values to identify the Next Great Anything, you’re barking up the wrong tree. At best, it’s the first in a many step process, and it’s a step that can be skipped entirely.
What we want to find are guys who increased their breaking ball usage, adapted their fastball locations to optimize for tunneling, or disposed of a terrible pitch.
i do not disagree with this at all
Wouldn’t these things – increased breaking ball usage, adapted fastball location, disposing of a terrible pitch – be looking backward to explain recent and likely small sample success rather than identifying great things to come? As in, the pitcher was bad, now he is good, and this is why? I always read about and hear of the magical three plus or quality-pitch arsenals that allow a starter to thrive and make it through the order three times, or allow a pitcher to become a starter instead of being stuck in the bullpen. Yes, the sequencing of pitches and how each pitch works off another seems important. But isn’t there value in identifying a “plus” pitch, which to me means performing multiple standard deviations above league average?
I don’t think you’re wrong on either count. But I’ll expound:
1) We do end up talking about usage changes most often in hindsight, yes. Such is the nature of not being able to see the future. But that’s kind of the crux of it: so many breakouts stem from simply changing up pitch usage (i.e. leaning on a good breaking ball in place of a bad fastball) that it’s worth identifying guys with similar traits who could take the next step forward with some usage optimization. That said, I wouldn’t prescribe much more to it beyond that; it can be unwise the make declarations about bad pitchers with good pitches just because they achieve certain thresholds for certain metrics.
2) There is value in identifying a plus pitch, yes. But the point is pitch values tells you as much about a pitch being “plus” as does ERA tells you about a pitcher being “elite.” (It tells part of the story, but not the whole story, and just part of the story can be deceiving.) Like, we’re definitely paying more attention to Mike Foltynewicz now, but is he a true-talent 2.85 ERA guy? Probably not. Same with an extreme pitch value. I’ll call back on Derek Holland’s fastball above. Was it a minus pitch in 2017? Yeah, because it was bad. But is it a true-talent minus pitch? No; it just got a bit unlucky. So I’d say pitch values does well to call our attention to very good or very bad pitches, as you’ve suggested, but we should be reluctant to accept them at face value, as I suggest in the post.
Mostly, I just think pitch values doesn’t add a lot of value to our understanding of why the pitch is good, the same way ERA doesn’t add much value. I’d rather hear about the finer details (SwStr%, GB%, etc.) the same way I’d rather hear about the finer details of a pitcher’s performance.
I was very confused by why there are three sets of data for pitch values (and guilty of thinking pitch value stats were saying more than they do). Could any of the three data sets be married to statcast data?
I think theoretically they all could. But even bridging the gap between the different pitch value sources (mainly between “standard” and PITCHfx/Pitch Info) is already difficult enough. Statcast has soooo many pitch type classifications… it’s something I’ve wanted to do, but it seems like an unnecessarily daunting task.
Thanks for this post – you write about very complex things in a refreshingly straight-forward way.
Thank you!
I had twice taken deep dives into Jason Vargas’s 2017 season (in May and at the All-Star break) and didn’t see anything noteworthy other than his early-season luck with LOB% and BABIP. When I saw Alex’s reference to Vargas, I took the bait and looked at his pitch values from 2017. What I found out should be useful to illustrate Alex’s main point here.
First, let’s look at Vargas’s pitch values per 100 pitches pre-2017:
wFB/c = -0.51
wCB/c = -0.85
wCH/c = 1.34
This makes sense….over his career Vargas’s changeup had been his out pitch, with the fastball and curve in supporting roles.
Now look at his first 7 starts in 2017 (4/7 thru 5/11):
wFB/c = 0.57
wCB/c = 3.02
wCH/c = 4.87
Everything is getting better results, but especially the off-speed stuff. So what’s causing this? Well, let’s see what Vargas did in his first 3 post-TJ starts at the end of 2016:
wFB/c = -0.22
wCB/c = 4.86
wCH/c = 2.44
A little more corroboration for the improvement in his off-speed stuff, especially the curveball. And he’s thrown the curve at twice his career rate through this point in 2017 (17% vs 8%). Hmmm, are we on to a breakthrough with Vargas’s curve? Let’s see what happens over his next ten starts (5/17 through the All-Star break):
wFB/c = -1.73
wCB/c = 0.66
wCH/c = 2.46
Nope. In fact, Vargas’s peripherals over this stretch have shot back down to his career water mark; the favorable overall pitch values are basically due to batted-ball and strand rate luck.
Finally, here are his 2017 second-half pitch values:
wFB/c = -2.78
wCB/c = -0.03
wCH/c = 0.70
This pretty much washes out any evidence of a breakthrough….peripherals are mediocre, but now with some bad luck slapped on to make the pitch values ugly. It turns out the biggest story about Jason Vargas in 2017 is that he was healthy enough post-TJ to make 32 starts of Jason Vargas quality.
So what was so different about those first 7 starts in 2017 vs. the rest of the season? Looking back, Vargas began throwing the curve a lot more often beginning in May (over 21%), but began to lose 2-3 MPH on the pitch. It would appear that he was fooling fewer hitters with the curve, maybe because of the velocity, maybe because it was easier to pick up vs. the fastball, or maybe because of the higher usage rate. Whatever the cause, the key thing is that we had absolutely NO way of knowing from the early 2017 pitch values that Vargas wasn’t going to sustain his improvement. In a parallel universe, maybe Vargas holds on to his April 2017 mix of stuff and turns into an above-average starter. The pitch values, though they accurately describe Vargas got out of each pitch, couldn’t predict what he would get from them later on.