Should Projections for Astros Hitters be Tempered?
Yesterday, I noticed someone slid into my DM’s and I got my hopes up but instead I got this:
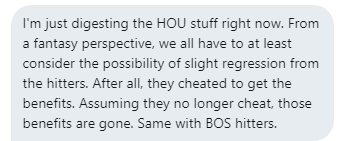
Maybe. Many of the Astros players didn’t think it helped.
Some Astros players told my investigators that they did not believe the sign-stealing scheme was effective, and it was more distracting than useful to hitters.
We just don’t know for sure of the effects of cheating so I guess I better take a stab and find out.
To start with, I went to the projection sources to find out how the projections weigh each year’s results. The weighted averages, along with some aging adjustments and regression, create the final projections. ZiPS is up first.
Dan Szymborski uses individual weightings for each component (strikeouts, doubles, etc) but at the end, the weighting is close to 8-5-4-2 where ‘8’ is the last season. According to the commissioner’s report, the Astros “only” cheated at home in 2017 so only 2 units (half of four, the third value) of the weighting will be boosted. The percentage of the projection’s input from the cheating is 10.5% (2/[8+5+4+2] or 2/19).
Assume for now the Astros hitters received a 10% increase in production by cheating. A hitter’s 2020 projection will be inflated by just 1% (10% of 10.5%).
Jared Cross informed me the Steamer projection weights are close to 5.0, 3.2, 2.0, 1.3, 0.8. If still assuming the same 10% more production from cheating, the projection boost percentage is 0.8% or less than 1%
(2.0/2)/(5.0+3.2+3.0+1.3+.8) * .10
1/12.3*.10
.081*.10
0.008
While I used 10% in the above examples, there are a couple of ways to see how much the trash can banging helped. The first and easiest method is to compare how the Astros did at home and away during the years in question. With wRC+ on a 100 scale where 100 is the league average, it’s easy to measure the percentage change. Here are the Astros wRC+’s for the past four seasons with the yearly change.
| Season | Home wRC+ | Difference | Away wRC+ | Difference |
|---|---|---|---|---|
| 2016 | 100 | 103 | ||
| 2017 | 121 | 21 | 122 | 19 |
| 2018 | 107 | -14 | 113 | -9 |
| 2019 | 136 | 29 | 116 | 3 |
From 2016 to 2017, the Astros had a gain of 2% points higher at home than on the road. Then they gave up all the gains and more from 2017 to 2018. The real anomaly happened from 2018 to 2109 where the home wRC+ jumped from 29% points while the value on the road was just 12% points.
If the small difference from 2017 to 2018 is going to be used, the huge disparity this past season must then be explained. According to MLB’s report, the Astros didn’t admit or get caught cheating in 2019.
Let’s ASSUME for second, the 26% difference in production was from cheating, and the Astros lose the advantage. The weighting would be more because the results just occurred and the home weighting is 21%. So 26% of 21% is a 5% drop. That’s a bigger deal. I know … 5% > 1%.
Next, I found out how common is a 21-point difference between the home and away values (2016 to 2019). It was the 7th highest difference with the 2016 Indians at 29 (115 wRC+ at home, 86 wRC+ on the road) being the most extreme. The difference is high but not unreasonable.
The 29-point jump from one season to the next was the 3rd largest jump with the 2016 to 2017 Athletics increasing from 80 wwRC+ to 117 wRC+. The Twins road numbers this past season was the second biggest jump from 88 wRC+ to 121 wRC+. Yes, the production jump at home was significant but just not unexplainable.
One issue with just using the overall team numbers is that the composition of the team could change from season to season. My next test takes the preseason steamer OPS projection (no wRC+ in the dataset) and sees how the hitters’ actual production compares. I’ve weighted the OPS values based on the players’ plate appearances. Also, I included the league-wide OPS values since offense production has been increasing the past few seasons.
| Season | Change in Home OPS | Change in Road OPS | League Change | |
|---|---|---|---|---|
| 2017 | .055 | .077 | 16 to 17 | 0.012 |
| 2018 | -.055 | -.005 | 17 to 18 | -0.022 |
| 2019 | .109 | .066 | 18 to 19 | 0.029 |
| Total | .109 | .138 | 16 to 19 | 0.019 |
The table closely mirrors the previous table with equal jumps in 2017, drops in 2018, and back up in 2019. The most interesting part to me is that the Astros hitters over the three seasons improved more on the road than at home.
With the above facts, I think the projections could be inflated from cheating by 1% on the extreme end. Most likely it’s zero. Zip. None. Since the banging happened three years ago, the “boost” has been watered down. Just feel free to draft away those cheating bastards with no reservations of the hitters missing their projections.
While some beat your favorite author leagues will be starting soon, feel free to go to the NFBC and sign up for their Draft or Online Championships. Also, for those with deeper pocketbooks, the NFBC Main Events are quickly filling up.
Jeff, one of the authors of the fantasy baseball guide,The Process, writes for RotoGraphs, The Hardball Times, Rotowire, Baseball America, and BaseballHQ. He has been nominated for two SABR Analytics Research Award for Contemporary Analysis and won it in 2013 in tandem with Bill Petti. He has won four FSWA Awards including on for his Mining the News series. He's won Tout Wars three times, LABR twice, and got his first NFBC Main Event win in 2021. Follow him on Twitter @jeffwzimmerman.
I saw a video of the cheating in action – Danny Farquhar figured out the Astros were sign-stealing in one game and changed up his signs. Somebody went and found video of the PA and it was against Evan Gattis in 2017 in a game that was fairly sparsely attended so you can hear the lid-banging in the background.
(BTW, video is NSFW for a swear word or two (or four) in the embedded video, not in the story itself but in the video)
https://ftw.usatoday.com/2019/11/astros-fiers-stealing-signs-danny-farquhar-video-mlb
I was initially going to question how useful that really was, but re-watching it I think Gattis gets the signal early enough that it could help. To me the real issue would be the fastball where you get no lid-banging and you’re waiting for the lack of a signal. Seems like it would take you very close to when the pitch is actually delivered and it’s awfully late to adjust at that point. I will say, seems to me like a huge advantage with runners on where the pitcher has to wait a split-second longer.
Entirely right. I get the outrage but but the significance is absolutely overstated. I work with a guy who now wants to pretend that Dodgers have a few WS rings lol.