Shapeshifters: Sliders
It seems we spend most Aprils ballyhooing about what should and shouldn’t be believed, what can and cannot be discussed. Some valid, some not. What I believe can sometimes get lost in early season analysis – or missed completely – is what the data (whether in April or September) can tell us beyond the numbers and beyond the sample.
Intent.
Good or bad, change or no change, we can find intent within data, regardless of sample size. Because, simply speaking, professional baseball is played by humans who are trying to be good at baseball. And like most humans, they will attempt to do more of what gets them a reward (being good at baseball) and less of what gets them a punishment (being bad at baseball).
If you start from there and work backward, intent can help you with analysis when the sample size is lacking. This can be more telling in regards to pitchers, at least early in the season, as they are the first-mover in baseball’s 1-on-1 battles, chooser of their path on every pitch.
Batters are the reactors and intent (beyond hit the ball) can be harder to judge as hitting is the hardest thing to do in sports and sometimes seems to rely on an unquantifiable measure of muscle memory voodoo. So I don’t make strong declarations about early hitting performances because we all know by now how quickly that switch can get flipped. One day they’re mired in a 1-for-20 slump, the next they’re crushing fools like Sly Stallone arm-wrestling in the name of child custody.
With the depths of information afforded to us by modern data collection, we can see further into a pitcher’s intent. What changes are intended, and which aren’t. What can be repeated and what shouldn’t be. Throwing your non-fastballs at a different speed?… Why? Does it work? Should it continue? Can it continue? More or less spin? Or arm angle, usage, or a dozen other things?… Why? What for? Rinse-repeat. (I’m sorry but I really wasn’t joking)
With that in mind, let’s take a look at some pitchers who have changed their stuff. Or rather, they’ve changed how some of their stuff moves. We’ll start with sliders, seeing whose movement has changed the most, and then take a closer look at a few players.
Patrick Corbin fans (or anyone that still owes him over $100 million) may want to surf away now.
2021 Slider Movement Increases
Let’s start with the 20 starting pitchers (min 50 pitches) who have the largest total movement (according to the spin direction leaderboard) increase over 2020. Note that we’re starting with total movement as our indicator but that the changes can come from one or both of the vertical and horizontal planes (according to the pitch movement leaderboard).
Besides total movement, the chart below includes the following data from 2021, as well as the difference compared to 2020.
zBrk – The amount of drop (inches) on the vertical plane with gravity included. A slower pitch will have more time to move and thus be affected by gravity more. That doesn’t necessarily mean that the pitch is better*.
zAvg – The amount of drop above or below the average for pitches thrown within +/- 2 MPH and from within +/- 0.5 feet of extension and release.
xBrk – The amount of break on the horizontal plane.
xAvg – The amount of break above or below average.
*For further reading
| Name | n | Use% | 2021 Move | Move +/- | 2021 zBrk | zBrk +/- | 2021 zAvg | zAvg +/- | 2021 xBrk | xBrk +/- | 2021 xAvg | xAvg +/- |
|---|---|---|---|---|---|---|---|---|---|---|---|---|
| Logan Allen | 77 | 28 | 14.4 | 4.5 | 42.7 | 1.3 | 1.4 | -1.0 | 13.3 | 5.6 | 5.7 | 4.1 |
| Huascar Ynoa | 137 | 43 | 7.8 | 4.3 | 42.8 | 4.5 | 6.7 | 3.1 | 2.6 | 1.5 | -2.2 | 0.6 |
| Zach Plesac | 112 | 28 | 9.2 | 4.3 | 25.6 | -5.3 | -7.6 | -4.0 | 0.4 | -1.3 | -3.7 | -1.2 |
| Brandon Woodruff | 53 | 12 | 7.5 | 3.4 | 40.1 | 5.9 | 6.3 | 4.3 | 4.4 | 1.5 | -0.3 | 0.6 |
| Zach Eflin | 84 | 24 | 9.0 | 2.9 | 27.0 | -1.8 | -6.9 | -3.9 | 1.6 | 0.1 | -3.0 | -0.7 |
| Yusei Kikuchi | 78 | 21 | 6.9 | 2.9 | 43.7 | 3.0 | 4.0 | 2.4 | 3.5 | 1.9 | -3.5 | 1.1 |
| Dane Dunning | 58 | 21 | 11.5 | 2.9 | 49.2 | 3.4 | 6.5 | 1.7 | 6.7 | 3.8 | -3.5 | 1.2 |
| Jack Flaherty | 157 | 32 | 10.1 | 2.7 | 34.1 | -1.2 | -4.2 | -2.0 | 8.4 | 2.0 | 0.7 | 0.1 |
| Luis Castillo | 63 | 15 | 4.8 | 2.6 | 40.2 | 4.4 | 3.1 | 1.1 | 1.9 | 1.9 | -4.6 | -1.4 |
| Alex Wood | 62 | 39 | 5.0 | 2.2 | 39.9 | 1.9 | 2.8 | 1.6 | 2.5 | 1.9 | -5.0 | 1.0 |
| Lucas Giolito | 54 | 16 | 7.1 | 2.1 | 29.8 | -4.4 | -5.1 | -2.7 | 2.4 | -1.1 | -2.3 | -1.2 |
| Patrick Corbin | 97 | 33 | 6.6 | 2.0 | 44.1 | 1.3 | -0.3 | 0.9 | 5.8 | 2.0 | -2.0 | 1.5 |
| Danny Duffy | 75 | 20 | 8.2 | 1.9 | 41.4 | 0.3 | 3.7 | 2.5 | 6.1 | 1.3 | -0.1 | 1.9 |
| Frankie Montas | 62 | 17 | 8.5 | 1.8 | 26.9 | -8.2 | -4.1 | -4.5 | 4.3 | -1.6 | 1.4 | -0.5 |
| Taijuan Walker | 80 | 23 | 8.4 | 1.7 | 29.8 | -3.8 | -4.5 | -2.4 | 4.7 | -0.2 | 0.7 | 0.2 |
| José Ureña | 93 | 27 | 6.6 | 1.4 | 30.9 | -1.9 | -4.0 | -1.3 | 2.7 | 0.7 | -2.1 | 0.5 |
| Yu Darvish | 103 | 22 | 17.6 | 1.3 | 42.0 | -0.7 | 1.3 | -1.0 | 16.3 | 1.4 | 8.4 | 1.0 |
| Joe Musgrove | 120 | 27 | 15.8 | 1.1 | 40.6 | -1.3 | 2.4 | 0.3 | 14.4 | 0.9 | 9.1 | 1.5 |
| Clayton Kershaw | 200 | 45 | 9.9 | 1.1 | 26.2 | -1.2 | -6.4 | -1.4 | 4.2 | -0.5 | 0.3 | -0.9 |
| Justus Sheffield | 119 | 33 | 8.1 | 1.1 | 42.6 | 0.5 | 2.6 | 0.4 | 6.4 | 0.7 | -1.1 | 0.6 |
Here are the same players with their change of use, velocity, and spin, as well as SwStr%, CSW%, and RV/100*.
*Run Value per 100 pitches – Every base-out situation (man on first with one out, etc) has a run potential that changes after each event (strikeout, ball, single, double, etc). The change in those run potentials is what we credit to the event. Run Values essentially tells us how a pitch has contributed to those changes. In 2021, Alex Wood’s slider comes in as the best at -7.7 RV/100, while Frankie Montas has the worst with a +6.7 RV/100.
| Name | 2021 Use | Use +/- | 2021 mph | mph +/- | 2021 spin | spin +/- | 2021 RV | RV +/- | 2021 SwStr% | SwStr +/- | 2021 CSW% | CSW +/- |
|---|---|---|---|---|---|---|---|---|---|---|---|---|
| Logan Allen | 28 | 1 | 81.2 | -1.7 | 2640 | 103 | 2.2 | 6.2 | 13.0 | -2.7 | 33.8 | 0.4 |
| Huascar Ynoa | 43 | -4 | 85.1 | -0.9 | 2482 | 185 | -1.5 | -0.1 | 20.4 | 2.0 | 40.9 | 5.0 |
| Zach Plesac | 28 | 0 | 87.2 | 0.9 | 2061 | -88 | -4.4 | -0.2 | 16.1 | -9.9 | 25.9 | -10.7 |
| Brandon Woodruff | 12 | 1 | 86.7 | -1.5 | 2602 | 77 | -3.7 | -2.7 | 13.2 | -5.0 | 39.6 | 4.0 |
| Zach Eflin | 24 | 4 | 86.8 | -1.7 | 2117 | -71 | 1.0 | 0.8 | 15.5 | 5.7 | 32.1 | 9.4 |
| Yusei Kikuchi | 21 | 5 | 82.4 | -0.9 | 2543 | 196 | 2.9 | 3.2 | 12.8 | -6.1 | 33.3 | -2.1 |
| Dane Dunning | 21 | -1 | 80.0 | -1.5 | 2128 | 52 | -2.4 | -4.6 | 19.0 | -2.8 | 24.1 | -3.3 |
| Jack Flaherty | 32 | 3 | 83.1 | -1.3 | 2403 | 56 | 0.6 | 1.0 | 18.5 | -7.7 | 32.5 | -4.9 |
| Luis Castillo | 15 | -3 | 84.2 | -2.6 | 2355 | -134 | -3.1 | -2.3 | 7.9 | -8.2 | 36.5 | -0.3 |
| Alex Wood | 39 | 11 | 84.4 | -0.2 | 2235 | -5 | -7.7 | -8.2 | 29.0 | 11.7 | 43.5 | 15.1 |
| Lucas Giolito | 16 | 1 | 86.1 | 1.2 | 2133 | 39 | 1.4 | 1.2 | 18.5 | -3.8 | 25.9 | -6.5 |
| Patrick Corbin | 33 | -8 | 78.3 | -0.9 | 2201 | -40 | 1.2 | 2.7 | 17.5 | -3.6 | 25.8 | -3.3 |
| Danny Duffy | 20 | 3 | 83.9 | 1.3 | 2460 | 68 | -2.8 | -5.4 | 17.3 | -0.6 | 28.0 | 2.7 |
| Frankie Montas | 17 | -8 | 89.2 | 3.1 | 2529 | 30 | 6.7 | 7.7 | 14.5 | 4.5 | 24.2 | -13.4 |
| Taijuan Walker | 23 | 1 | 86.5 | 1.3 | 2434 | -1 | 0.2 | -0.8 | 8.8 | -2.3 | 21.3 | -3.0 |
| José Ureña | 27 | -6 | 85.9 | 0.3 | 2355 | -20 | 2.1 | 2.2 | 12.9 | -1.2 | 28.0 | -4.1 |
| Yu Darvish | 22 | 7 | 81.7 | -0.3 | 2751 | -38 | -6.8 | -2.9 | 12.6 | -5.1 | 33.0 | -13.8 |
| Joe Musgrove | 27 | 3 | 83.7 | 1.2 | 2729 | 52 | -2.8 | -1.3 | 30.8 | 6.9 | 47.5 | 8.2 |
| Clayton Kershaw | 45 | 5 | 87.6 | -0.2 | 2682 | 6 | -2.4 | 0.0 | 24.0 | 2.2 | 35.5 | 2.4 |
| Justus Sheffield | 33 | 0 | 81.9 | 0.1 | 2535 | 32 | 3.8 | 5.5 | 17.6 | 3.7 | 26.9 | -0.2 |
Quick Hits
- Everything old is new again for poor Brandon Woodruff, who has moved back into Corbin Burnes‘ shadow after briefly eclipsing him as Milwaukee’s future ace. He’s been getting fewer whiffs with a slider that now has elite vertical movement (3rd-most among qualified pitchers) but more strikes, with a 39.6% CSW% that is up 4-points from 2020 (13th-highest). Woodruff has a 1.55 ERA through five starts but has only allowed two earned runs (0.72 ERA) since giving up three in his season debut versus the Twins.
- Well, at least we can say that Luis Castillo’s slider is technically performing better than it ever has, even as his SwStr% has been decimated. Unfortunately, his signature changeup keeps getting worse, essentially spending the last two years as an average pitch (according to RV) after three years of being elite. But we’ll chat more about that later. Castillo has allowed a combined 1 ER in two of his five starts…And 16 ER in his other three.
- It’s probably a good idea that Alex Wood has increased his slider use by 11-points considering it’s been the best this season according to RV/100 and has a 29% SwStr% that trails only deGrom, Bieber, Musgrove, and Snell. The hope, as always, is that Wood stays healthy, having not pitched more than 36 innings since 2018.
- Good gravy, someone call the fight on Frankie Montas’s slider. Being thrown 3-mph harder and losing substantial vertical movement, its +6.7 RV/100 is the worst in baseball among qualified starters. After allowing 6 ER on three home runs in his last time out, Montas now carries a 6.75 ERA through his first four starts. When he’s on, Montas can be devastating but good luck figuring out when that will be from week to week. (Update: Montas went
Patrick Corbin, Washington Nationals
2021 (4 GS, 16.1 IP): 0 W – 14 K – 2.02 WHIP – 10.47 ERA
Imagine a player with a pitch so good that he helps jumpstart the movement of “Maybe letting pitchers throw their best pitch more is a good idea?”. Someone with a pitch so good that it carries him from five years of 20% strikeout rates to around 30% in 2018-19, in the process helping convince a team to give him $140 million in free agency. A pitch so good that it even gives a label to the aforementioned movement, with “going full-Corbin” making a place in our baseball lexicon.
Now imagine throwing that pitch completely different for the last two seasons. Good idea?
Corbin’s 2021 line says no, as does 2020’s (2-7, 20.3% K%, 1.57 WHIP, 4.66 ERA). And yet, here we are facing a second year in a row of Corbin being a mess as his best pitch continues to decline.
The formerly nasty slider has gone from -1.9 RV/100 in 2018, to -2.2 RV/100 in 2019, to -1.5 RV/100 in 2020, and now sits at 1.0 RV/100 in 2021. Don’t let the relatively small changes get you twisted because they add up quickly when talking about per 100 pitches. Assuming 1200 sliders thrown (which Corbin reached in 2018-19, with 1155 thrown in 2017), his slider would swing by +30 RV compared to 2020 and +38 RV compared to 2019. Not great.
It’s not that Corbin has reversed course on his going Corbin-ness; the 30% usage through four starts is down from his typical 40% but that’s probably just early-season noise as things are climbing right back towards normal:

When looking at his movement on both planes, Corbin has technically added more. But when you throw a pitch slower, gravity will naturally be more of a co-pilot, making those gains less impressive.
| Year | MPH | Spin | Drop (in) | vs Avg (in) | % Drop vs Avg | Break (in) | vs Avg (in) | % Break vs Avg |
|---|---|---|---|---|---|---|---|---|
| 2016 | 81.0 | 2302 | 43.6 | 4.5 | 11 | 5.7 | 1.1 | 24 |
| 2017 | 80.9 | 2359 | 43.8 | 3.4 | 8 | 6.3 | -0.1 | -2 |
| 2018 | 81.7 | 2389 | 42.8 | 1.8 | 4 | 3.3 | -2.6 | -44 |
| 2019 | 81.7 | 2398 | 42.0 | 1.3 | 3 | 3.6 | -2.3 | -39 |
| 2020 | 79.2 | 2241 | 42.8 | -1.2 | -3 | 3.8 | -3.5 | -48 |
| 2021 | 78.3 | 2201 | 44.1 | -0.2 | 0 | 5.8 | -2.0 | -26 |
Two of those years are not like the other, two of those years do not belong. While Corbin has been getting more raw movement, he’s actually been getting worse when compared to pitches thrown at a similar speed and extension. And everything else screams trouble because while what batters have been able to do on contact hasn’t changed much (with the xwOBAcon against staying relatively steady), the whiffs have driven off of a cliff.
These aren’t some 2021 small-sample shenanigans; what started in 2020 has only gotten worse:
| 2018 | 2019 | 2020 | 2021 | |
|---|---|---|---|---|
| SwStr% | 30.2 | 27.9 | 21.2 | 15.2 |
| CSW% | 38.7 | 37.0 | 29.1 | 25.8 |
| Whiff% | 53.1 | 51.4 | 38.1 | 36.2 |
| wOBA | .194 | .200 | .253 | .274 |
| xwOBA | .197 | .204 | .250 | .300 |
| wOBAcon | .383 | .372 | .383 | .335 |
| xwOBAcon | .391 | .383 | .378 | .373 |
It’s not just the results that have changed, as his pitch specs also show dramatic changes. Spin? Down around 200 rpm from the slider’s heyday. Velocity? It was down over two ticks last season and has dropped another one in 2021. Corbin has also increased his release extension (how far off the mound the pitch is released) on all of his pitches but none more so than the slidepiece. After consistently living right around 6.0 ft, he’s been at 6.7 ft the past two seasons.
As for location, Corbin has gone from steady-Eddie with where he wants to attack, to living in a more hitter-friendly zone:

One more thing. We saw earlier how batters haven’t necessarily been doing more damage on contact against the slider but keep in mind that pitches don’t exist in a vacuum. And in a world where Corbin’s slider is driving off the whiff cliff, his sinker (and primary fastball versus RHB) is holding hands with it the whole way down.
Using 3D pitch visualizations from Baseball Savant, let’s look at this pitch pairing when Corbin faced RHB in 2019 (combined 73% usage) and 2021 (combined 60% usage).
Keep in mind that the left-handed Corbin used to handle righties with ease. But while his performance against LHB has stayed mostly steady (even this year), he has gone in the tank versus RHB. They posted a .254 wOBA against him in 2018 and a .298 wOBA in 2019. That rose to a .370 wOBA last season and now sits at a .505 wOBA in 2021.
Here he was in 2019, with the sinker in orange, slider in yellow, and the purple spheres representing the batter’s commitment point (167 ms before the plate). Note how they track together as they move towards the commit point, before diverging.
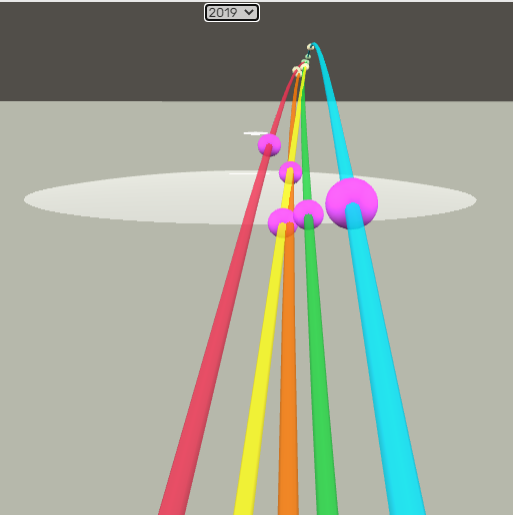
Here’s how that played in real life:
Patrick Corbin, 90mph Two Seamer and 83mph Slider, Individual Pitches/Overlay. pic.twitter.com/uZXYWfH6yZ
— Rob Friedman (@PitchingNinja) May 10, 2019
And now for 2021:

Notice any difference? Because I bet major league hitters can. Pulling back further, it’s easier to see how far the pitch paths have changed:
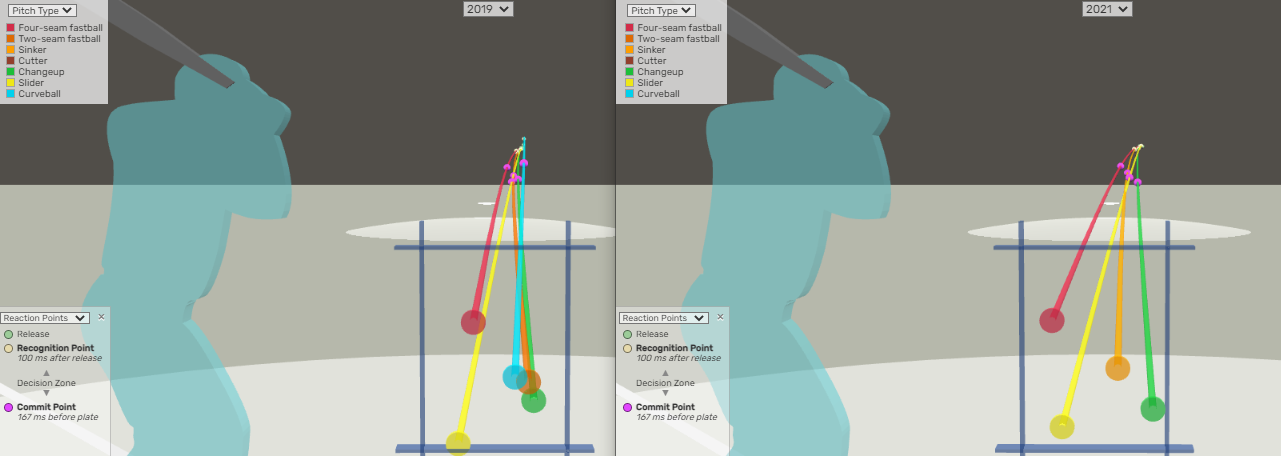
What happens when the slider is less of a threat because the batter can differentiate it sooner and the sinker has decreased slightly in speed (down 1 mph since 2019) and substantially in horizontal movement (from 0.6 inches above-average in 2019 to -2.0 inches below-average in 2021)?
This:
| Year | SLG | xSLG | wOBA | xwOBA | wOBAcon | xwOBAcon | EV | LA |
|---|---|---|---|---|---|---|---|---|
| 2017 | .550 | .476 | .403 | .369 | .421 | .379 | 91.1 | 3 |
| 2018 | .371 | .441 | .305 | .354 | .299 | .355 | 89.8 | 2 |
| 2019 | .439 | .512 | .335 | .365 | .359 | .400 | 91.1 | 4 |
| 2020 | .554 | .533 | .421 | .400 | .482 | .455 | 94.2 | 7 |
| 2021 | 1.235 | 1.300 | .712 | .710 | .810 | .806 | 96.1 | 23 |
Hitters aren’t just doing more damage, they’re doing it with more elevation and exit velocity than they ever have before. Is it a coincidence Corbin’s sinker is getting crushed more as his slider loses its whiff? Or have they been able to turn on the former as fear of the latter dissipates?
There’s no happy ending here as I have little reason for optimism after seeing more of what we saw in 2020 get repeated in 2021. Until he gets his filthy slider back (or completely reinvents himself again) Corbin just isn’t a viable starter in fantasy, beyond streaming. And even then, it’s a dicey proposition.
Those rostering Corbin, whether in season-long or dynasty, should sell about five minutes after he puts up his next decent start. Ideally, you can go back in time about a week.
Great article, very detailed. I really liked how you framed the analysis with pitchers being ones that act and hitters as the ones that react.
Thank you for reading, I appreciate the kind words.