Ride the Seam-Shifted Wake
With Statcast replacing their radar-based tracking systems with the new Hawkeye (optical-based) system in 2020, what we’re now able to see on the field has taken another giant leap forward. What was once inferred is now being observed and those observations have led to ground-breaking work by Barton Smith, Driveline Baseball, and others in fully parsing the forces in play when it comes to pitch movement.
I highly recommend the above readings (and a host of others) for a more in-depth explanation but here are some cliff notes for those new to the concept of seam-shifted wakes:
Every baseball spins in a certain direction, spinning around a certain axis, resulting in a certain movement. The old method of determining spin direction was to use the movement measured by Pitchf/x and work backward to infer what the spin axis should have been. Or, “the baseball moved this way, it must have spun in this direction”.
Hawkeye’s cameras, however, are able to observe what the spin axis actually is after leaving the pitcher’s hand. When comparing the two measurements (inferred and observed) the deviation between the two can tell whether more forces than the downward one of Magnus are at play.
The work of Smith and at Driveline has centered around how the seam orientation of the pitched baseball in flight is informing those “side forces” and how best pitchers can attempt to keep their seams in the place most conducive for their desired movement. Sounds difficult but it’s certainly possible and pitchers have been doing it unknowingly as long as baseball has been played, playing with and cycling through grips in search of the elusive nirvana that is “I just found one that works”.
This is all just scratching the surface on how seam-shifted wakes might be informing movement, as well as starting to quantify the catch-all and mysterious quality we call “deception”. Pitches with more SSW may be presented visually to batters in a way that their brains tell them will move in a different fashion than it actually does.
SSW looks to be important for multiple pitches but I’ve been most interested in whether it would help explain cutters, whose movement doesn’t always line up with the success (or lack of) against it.
Looking at research by Tom Tango in which he measured pitch-by-pitch performance according to the amount of movement, he didn’t have strong conclusions about cutters, leaving off with:
“Cutters are a different story. Their impact does not seem to be tied to their movement. Or if it is, it is not a clean distribution. I would say that Cutters are exception cases, and need special handling.”
But that was two years ago and pre-Hawkeye! With knowledge of the effects of side force, might cutters start dropping their veil of secrecy?
With a question in hand, our intrepid hero bravely set off to the Oracle of Tango.
A crafty minx, our lord Tango can be, but a clearer message awaited in the morning, with the aforementioned further breakdown appearing in full.
Using a similar methodology as when studying the relationship between movement (and other variables) on performance, he put each pitch into three bins: the 25% with the most SSW, the 25% with the least and the 50% in the middle. As with the research looking at the effects of total break and Magnus forces, each bin was totaled according to run value per 100 pitches.
Total Break:
1. -0.01
2. +0.23
3. -0.29
Magnus:
1. +0.13
2. -0.32
3. +0.45
SSW:
1. -0.61
2. -0.02
3. +0.58
Compared with the confusing values presented by the total break and Magnus, the effect of SSW is striking, as cutters with the most SSW led to -0.61 runs (per 100 pitches), compared to +0.58 runs with those having the least amount of SSW. Bingo.
One more time from TT:
Ah, but SSW on Cutters, that’s where it happens: by far, the cutters with the most SSW are the most effective, and those with the least amount of SSW are the least effective. Finally, we get to see some explanation for how to measure the effectiveness of cutters and it lies with the SSW.
With the secrets of good cutters starting to be discovered, I looked at the starting pitchers who have the highest deviation between their inferred spin direction and observed in 2021. The leaders are listed below, along with their deviations (if applicable) from 2020.
Also included is Tail% from Baseball Savant, which tells us what percent better or worse a player’s horizontal movement is in comparison to pitches thrown at a similar speed, as well as CSW% (called +swinging strikes) as a marker of general performance thus far.
It’s too early to make strong judgments on pitchers but I’m hunting for talent changes in April. While SSW doesn’t guarantee success, it does provide us another tool with which to look for clues.
| Name | 2021 Use% | 2020 Dev | 2021 Dev | Dev +/- (min) | 2020 Tail% | 2021 Tail% | 2021 CSW% | CSW +/- |
|---|---|---|---|---|---|---|---|---|
| Lance Lynn | 25.7 | 45 min | 1 hr 30 min | 45 | -1 | 46 | 35.2 | 8.8 |
| Marcus Stroman | 15.8 | n/a | 1 hr 30 min | n/a | 102 | 29.6 | ||
| Josh Fleming | 27.4 | 1 hr 30 min | 1 hr 30 min | 0 | -83 | -99 | 39.1 | 17.4 |
| Hyun Jin Ryu | 31.4 | 1 hr 15 min | 1 hr 15 min | 0 | -54 | -29 | 27.6 | -4.5 |
| Dustin May | 16.7 | 45 min | 1 hr 15 min | 30 | -94 | 0 | 46.2 | 18.9 |
| Max Scherzer | 13.3 | 30 min | 1 hr 15 min | 45 | -157 | -26 | 29.2 | 9.3 |
| Yusei Kikuchi | 39.3 | 45 min | 1 hr 15 min | 30 | -46 | 54 | 27.8 | -0.2 |
| Charlie Morton | 16.1 | 1 hr 45 min | 1 hr 15 min | -30 | 31 | -7 | 31.7 | -7.9 |
| Chase Anderson | 23.4 | 1 hr | 1 hr 15 min | 15 | 80 | 50 | 22.2 | -7.5 |
| Ryan Yarbrough | 42.5 | 1 hr 15 min | 1 hr 15 min | 0 | -31 | -21 | 36.2 | 4.2 |
| Joe Musgrove | 25.1 | 1 hr 30 min | 1 hr | -30 | -8 | -20 | 35.3 | -11.2 |
| Wade Miley | 47.0 | 1 hr | 1 hr | 0 | 52 | 28 | 18.3 | -12.2 |
| Eduardo Rodriguez | 25.2 | n/a | 1 hr | n/a | -28 | 35.9 | ||
| Yu Darvish | 33.9 | 1 hr 15 min | 1 hr | -15 | 63 | 61 | 38.3 | 2.5 |
| Tyler Anderson | 34.9 | 1 hr | 1 hr | 0 | 3 | -26 | 30.3 | 4.9 |
| Martin Perez | 36.7 | 1 hr | 1 hr | 0 | -141 | -53 | 21.2 | -1.1 |
| T.J. Zeuch | 18.0 | 1 hr 15 min | 1 hr | -15 | -52 | -106 | 33.3 | 15.4 |
| Corey Kluber | 27.700 | n/a | 1 hr | n/a | 83 | 35.6 | ||
| Merrill Kelly 켈리 | 14.7 | 45 min | 1 hr | 15 | -117 | -112 | 25.9 | 5.9 |
| Corbin Burnes | 50.0 | 45 min | 45 min | 0 | 119 | 21 | 39.4 | 5.1 |
| Jakob Junis | 23.9 | n/a | 45 min | n/a | 235 | 47.6 | ||
| Trevor Cahill | 16.8 | 60 min | 45 min | -15 | -81 | -101 | 50.0 | 14.3 |
| Michael Wacha | 41.1 | 1 hr 15 min | 45 min | -30 | -13 | -35 | 36.9 | 10.9 |
| Matt Moore | 14.3 | n/a | 45 min | n/a | -118 | 9.1 | ||
| Dallas Keuchel | 20.0 | 45 min | 45 min | 0 | -21 | -70 | 26.1 | -2.9 |
| Adam Wainwright | 23.8 | 60 min | 45 min | -15 | 68 | 92 | 32.1 | 3.0 |
| Carloz Martinez | 29.4 | n/a | 45 min | n/a | -106 | 27.7 | ||
| Aaron Civale | 25.4 | 60 min | 30 min | -30 | 79 | 87 | 17.4 | -11.9 |
| Nathan Eovaldi | 12.6 | 45 min | 30 min | -15 | 9 | -11 | 21.2 | -6.3 |
| Jordan Montgomery | 19.4 | 30 min | 30 min | 0 | -178 | -151 | 20.0 | 2.0 |
| Kohei Arihara | 13.9 | n/a | 30 min | n/a | -169 | 25.0 | ||
| Kyle Gibson | 18.0 | n/a | 30 min | 39 | -36 | 36.1 | 40.0 | |
| Brett Anderson | 11.8 | 30 min | 30 min | 0 | -151 | -117 | 15.0 | -9.7 |
| Chris Flexen 플렉센 | 29.8 | n/a | 30 min | n/a | 59 | 26.4 | ||
| Pablo Lopez | 9.3 | 60 min | 30 min | -30 | -112 | -765 | 12.5 | -13.8 |
| Erick Fedde | 24.6 | 1 hr 15 min | 30 min | -45 | 58 | 44 | 16.7 | -2.5 |
| Dean Kremer | 30.2 | 45 min | 30 min | -15 | 52 | 41 | 42.9 | 6.5 |
| Marco Gonzales | 13.1 | 30 min | 30 min | 0 | -99 | -151 | 15.4 | -7.1 |
| Madison Bumgarner | 38.2 | 60 min | 30 min | -30 | 14 | 13 | 30.0 | 1.9 |
| Chi Chi Gonzalez | 21.5 | 30 min | 30 min | 0 | -16 | 25 | 20.0 | -5.0 |
| Trevor Bauer | 30.2 | 45 min | 15 min | -30 | 79 | 44 | 44.6 | 7.2 |
| Chris Bassitt | 24.0 | 30 min | 15 min | -15 | -36 | -119 | 19.0 | -5.3 |
Lance Lynn, 1 hr 30 min deviation

Seasons come, seasons go, Lance Lynn piles up innings and strikeouts. These are just things that happen. Lynn has racked up 27 strikeouts in 19.2 innings, going 1-1 with a 0.92 ERA (1.36 FIP), and 0.92 WHIP. That’s top-10 value in the young season and the early strikeout heater is a nice bonus, as his 35.1% is a far cry from 25.1% in 2020 or even the 28.1% in his career year of 2019.
Strikeout rates are far too noisy to take too seriously this early in the season but it is interesting that his cutter – the pitch that started this Lynn-aisance in the first place – has come out of the gate firing on all whiffs, posting a 16.7% SwStr% that’s up from 11.6% in 2020 and 12.5% in 2019.
Along with his four-seam and sinker, Lynn has gotten even more confident in the zone, with his pitches thrown in the heart rising from 26% in 202o to 31% in 2021. And it’s not that he’s attacking the zone more because batters aren’t swinging; their 80% swing% on balls in the heart is seven points higher than league average and up from 78% in 2020.
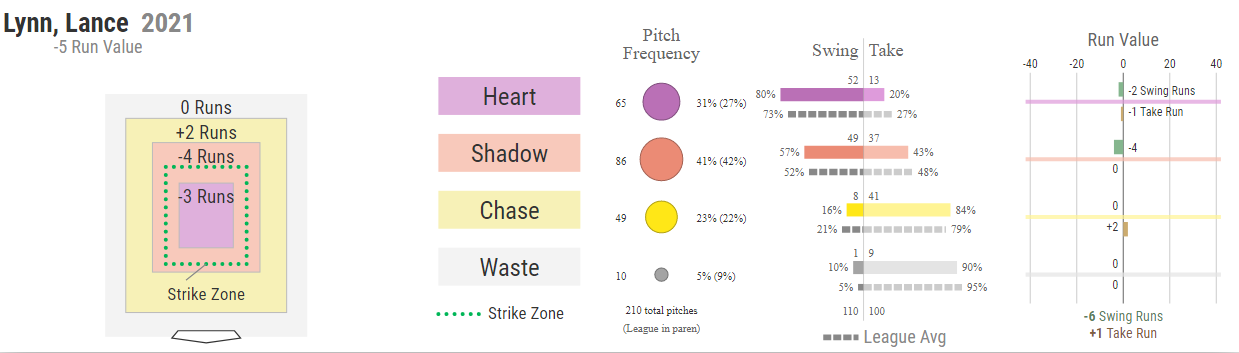
Might the 90-minute deviation on his cutter (up from 45-minute in 2020) be responsible for the extra slipperiness that hitters haven’t been able to latch on to? We only have the new observed spin angles from 2020-21 so we can’t know if 2019’s deviation looked similar to this year but when looking at the movement profile, it is giving off those vibes:
| Vertical Movement (inches) | Horizontal Movement (inches) | ||||||
|---|---|---|---|---|---|---|---|
| Year | Inches of Drop | vs Avg | % vs Avg | Inches of Break | vs Avg | % Break vs Avg | |
| 2021 | 30.7 | -2.7 | -10 | 3.7 | 1.2 | 46 | |
| 2020 | 27.1 | -1.2 | -4 | 2.1 | -0.1 | -4 | |
| 2019 | 29.6 | -2.5 | -9 | 3.3 | 1.3 | 67 |
I’m not expecting the 35% K% to hold but Lynn could reach some tail-end probabilities of fantasy value if he surpasses his 28% rate from 2019. His team offense and bullpen should position him well for wins in a soft division and his oldest of the old school manager will run that horse out until he says nay.
Even with the strong start, there are still plenty of Lynn owners who would listen to an offer if it came with a small premium attached. I’d be willing to pay because Lynn is just doing a best-case version of why I liked drafting him in the first place for what looked to be another topsy-turvy season.
Buckets of innings with a high floor on a good team. And now, maybe with more K’s? I’m on Lynn like he’s on ham.
Marcus Stroman, 1 hr 30 min deviation
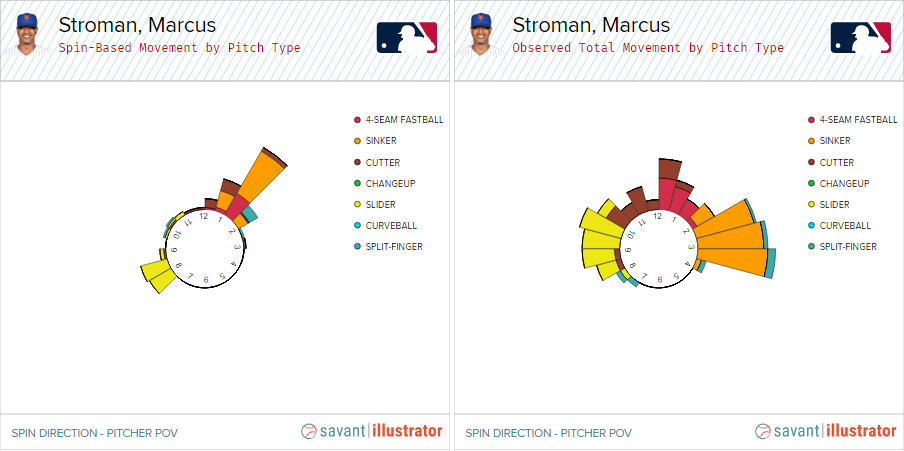
Tied with Lynn in deviation, what Stroman lacks in strikeouts he makes up for in being a national treasure. Only six strikeouts in his first 12.1 IP (13% K%) but two wins, 0.81 WHIP, and 0.79 ERA through two starts has to make those who grabbed him around his 185 ADP. Throwing it mostly to LHB, Stroman has used his cutter consistently in the low-teens over the years, although usage did spike to 24% in 2019.
It’s never been much of a strikeout offering before, however, carrying an 11.6% SwStr% in 2019 and 10.1% in 2018:
I love the talent, and as mentioned, Stroman is a national treasure. But his real-life value still outweighs fantasy because unfortunately, he still plays for the Mets, who have somehow managed to keep even Jacob deGrom and his 0.64 ERA winless in 2020. With wins always a shaky proposition and a limited strikeout ceiling, it’s hard to target Stroman via trade unless you find a really solid price.
Dustin May, 1 hr 15 min deviation
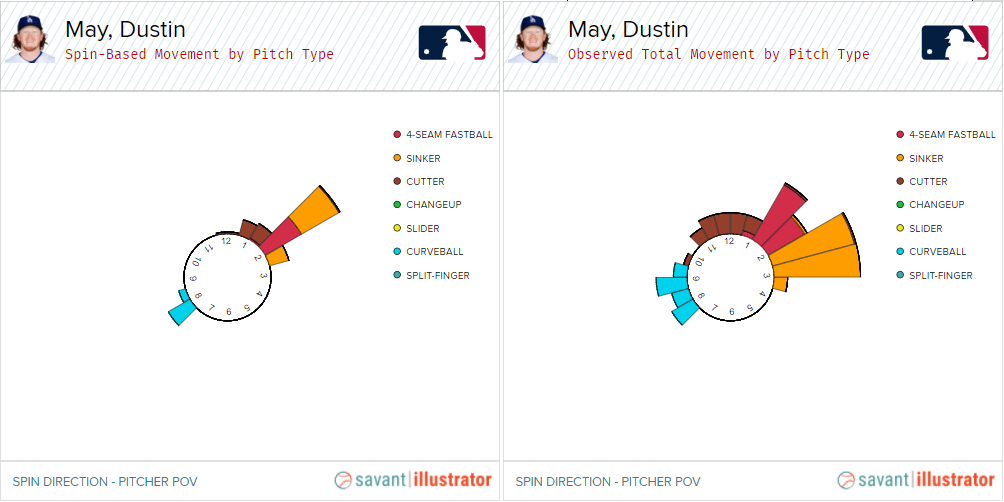
Like Lance Lynn, if he had premium velocity and a cascading waterfall of ginger curls, Dustin May is all about that heater, attacking batters with 85% fastballs in 2021, mixing in his curveball to round out the rest. May’s sinker (30 min deviation) and four-seamer (15 min deviation) also have some side force coming into play but it’s the cutter that’s the seam-shifted star, tying for second place in total deviation.
Look away Garrett Hampson fans:
After 38% usage to RHB in 2020, 24-of-26 cutters this season have been to LHB but that’s probably less about a sudden pitch-mix change and more about not bothering to throw righties anything else until they can handle the 73% sinkers he’s thrown at them so far. The cutter’s early effectiveness can’t be argued, however, carrying a 46.2% CSW through his first two starts with the bulk of the freight being carried by a vulgar 42.3% SwStr%.
Once again, very small sample but when a right-handed pitcher with upper-90’s heat is dominating lefties with a whiff-heavy cutter, I’m paying attention. Honestly, I’ve never been that in on May but am now looking to acquire, both in dynasty and redraft. Like Lynn, May can fill the zone up with hard-to-handle fastballs, with a strong bullpen and offense behind him.
Wins, whiffs, with the lettuce of a god. What more could you want?
Jakob Junis, 45 min deviation

Junis has been mostly mediocre over his career and after battling COVID and injury in 2020 was relegated to the bullpen to start 2021. However, after a strong spot start against Cleveland (5 IP, 0 ER, 6 K) Junis earned a second against Toronto on Thursday, again going five innings and striking out six, allowing two earned runs.
This might be something more than just a two-start blip, as Junis is succeeding on the back of the brand-new cutter he’s throwing 35% of the time. Getting an elite 11.9 inches of break (124% more break than average), batters have managed just one single against it so far, with a 28.6% SwStr%:
As of Friday morning, Junis is rostered in 6% of all Yahoo leagues, 3% in ESPN, and 30% in Fantrax, lining up to face the Rays (who have an 81 wRC+ and .279 wOBA vs RHP in 2021) at home in his next time out, followed by a trip to Detroit (who has Akil Baddoo). Wins are always going to be a wild-card for Royals pitchers but you have to grab Junis now, at least until we see if his new cutting style continues to dominate the opposition.
Amazing piece. SSW is definitely the next frontier of pitch design research. however i have to say something about it seems a little off to me. we know that the movement of the ball is a result of forces being applied to it. we know these forces include gravity, drag/air resistance, the magnus force, and now, SSW. what bugs me is that on the baseball savant leaderboard, the entirety of the deviation between observed movement and spin induced movement is attributed to SSW. and without a clearer definition of what exactly SSW is and a way to determine it’s magnitude and direction independently, we can’t really make that assumption. there might also be other forces that we don’t know about contributing. SSW might work differently then we expect and it might not be responsible for the entirety of the deviation. so i just don’t feel safe saying that entire difference is SSW. if anybody knows more about SSW then me and wants to explain why that assumption can be made, I’d love to hear
I think knowing that there are non-Magnus side forces at play is the biggest takeaway, even if we don’t completely understand them fully. That’s one of the things I find so exciting, is that we’re really just at the beginning of breaking this all down.
Also, thank you for reading!
Check this out:
https://vixra.org/pdf/2101.0046v1.pdf
4 of the top 13 are on my Scoresheet team! That’s good, right?
As long as one isn’t Marco Gonzales…; )
Regarding Junis, are we even sure that’s a cutter, or is Savant just suddenly classifying his slider as a cutter? Because the 2021 “cutter” is same speed, movement, and frequency as his slider from years past, which is suddenly 0% in 2021 per Savant.
It’s a cutter.
https://www.mlb.com/news/jakob-junis-adds-cutter-to-pitch-arsenal